- 1State Key Laboratory of Advanced Electromagnetic Engineering and Technology, School of Electrical and Electronic Engineering, Huazhong University of Science and Technology, Wuhan, China
- 2State Grid Hubei Electric Power Company Limited, Wuhan, China
The distributed maximum power point tracking (DMPPT) technology, based on a DC optimizer (DCO, a DC/DC micro-converter) for each single photovoltaic (PV) panel, is one of the most popular solutions to mitigating the waste of solar energy when suffering mismatch conditions. However, the trade-off between the additional costs of deploying the panel-level power electronic equipment and the improved generation benefits of a large-scale PV plant (LPP) remains to be further studied. This study presents a static modeling method for the DCO-based distributed LPPs to study the long-term energy generation characteristics based on historical hourly weather data and then evaluate the economic benefits. The operational characteristics of the PV strings equipped with series-connected DCOs for three different topologies (Boost, Buck, and Buck-boost) are investigated, and then the control strategies for the PV-DCO generation units are proposed to maximize the energy generation of LPPs under frequent mismatch conditions. Different mismatch scenarios caused by the panel aging, geographical location settings, and the partial shading in PV arrays are simulated in the model. Six typical centralized or distributed PV plant configurations are carried out for comparison in case studies, to explore the generation characteristics and the advantages of energy production for the DCO-based distributed LPPs. Besides, the Levelized cost of energy (LCOE) which considers both the energy generation benefits and investment costs is introduced to the economic evaluation of different structures of LPPs.
Introduction
Solar photovoltaic (PV) technology plays an increasingly important role in energy supply as it is freely available, environmentally friendly, and economically efficient (Ma et al., 2019; Li et al., 2020; Chen et al., 2021). The PV cumulative installed capacity has experienced significant growth from 138 GW in 2013 to 760 GW in 2020 worldwide, which shows the great potential for low-carbon energy system transition (World Energy Outlook, 2020).
Conventionally, PV panels are series-connected into a string to achieve a high DC voltage and then the strings are connected in parallel to create an array of the large-scale PV plant (LPP). Central inverters are employed to implement the global maximum power point tracking (GMPPT) technology on each PV array and connect the plant to the power grid, which is called centralized configuration. However, modules in a PV plant may show different operational characteristics when suffering from partial shading or other mismatch problems (Bana and Saini, 2017; Wang et al., 2020). The shaded panels of the PV string would limit the current of the unshaded panels since they are connected in series, thus resulting in a great solar energy loss. Besides, the mismatch conditions may cause the “hotspot” problem in the PV array; for this reason, the bypass diode is introduced to each PV panel. The seriously shaded modules in a string are usually shorted out by diodes to maintain the total power generation. However, the utilization of bypass diodes may trigger an additional problem of multiple maxima in the power-voltage curve of the PV array, resulting in difficulties in the optimization process of GMPPT implementation (Batzelis et al., 2014; Cao et al., 2020a).
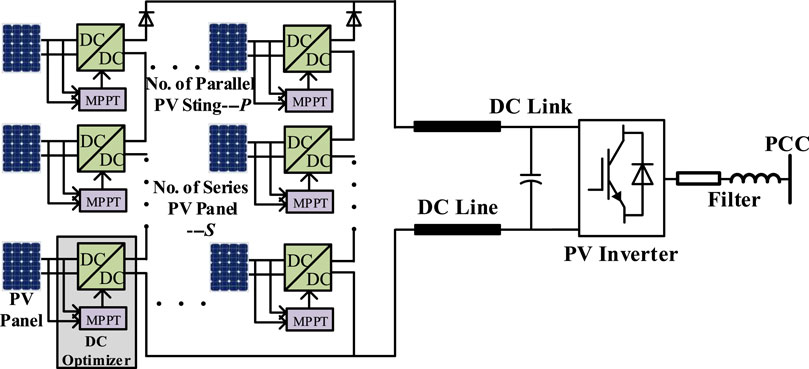
Various approaches have been proposed to solve the local optimal problems under multiple extremum points. Studies (Ram et al., 2017; Alik and Jusoh, 2018; Cao et al., 2020b) have presented the improved searching methods of GMPPT techniques under mismatch conditions based on fuzzy logic control, artificial neural network, and particle swarm optimization methods. Although GMPPT shows the advantages of implementation simplicity, reduced cost, and immediate adoption, the severe power loss caused by frequent mismatch conditions remains unresolved. To address this problem, the distributed maximum power point tracking (DMPPT) technology, based on a DC optimizer (DCO, a DC/DC micro-converter) for each single PV panel, is increasingly developed for LPPs due to its superior generation efficiency, unified configuration, and modular layout (Khan et al., 2016; Vavilapalli et al., 2018; Zhang et al., 2021). Figure 1 shows the overall structure of the DCO-based distributed LPP with the series-connected structure. The PV-DCO array contains P parallel PV strings, each of which includes S cascaded PV-DCO units. A grid-connected inverter is deployed for the PV array to integrate solar energy into the power system through a short DC transmission line. The individual power optimization process (MPPT) can be realized for each PV panel with the controllers of DCOs, which eliminates the adverse effects of mismatch conditions for PV arrays compared with the global searching algorithms.
With the DCO-based distributed configuration, the waste of solar energy when suffering partial shading is greatly mitigated, leading to an improvement in the economic benefits of LPPs. However, the trade-off between the additional costs of deploying the panel-level power electronic equipment and the improved generation benefits for an LPP remains to be further considered. The modeling and analysis of long-term energy generation characteristics of LPPs equipped with panel-level DCOs are critical to studying the feasibility and economics of this type of structural design compared with conventional centralized configurations.
The existing modeling research studies on the DCO-based LPPs mainly focus on the dynamic models covering the high-efficiency topologies (Wang et al., 2013; Amir et al., 2019), distributed control strategies (Biswas et al., 2017; Lópezdel Moral et al., 2018), or the stability analysis (Mahdavyfakhr et al., 2017; Wang et al., 2020) for the PV system, which cannot be used for the long-term energy production calculation of PV plants. In the studies by Petrone and Ramos-Paja (2011) and Cook et al. (2018), the static models were developed for the calculation and assessment of long-term energy production of LPPs. However, none of them considered the operational characteristics of the panel-level DCOs assembled in the array. In the study by Castro et al. (2020), a steady-state model is also proposed for a multi-array PV system constructed in parallel to study the power flows and power generation issues; nevertheless, the modeling method is not applicable to analyze the mismatch problems involved in series-connected PV-DCO generation units, and only the Boost topology is considered in the micro-converters.
On the other hand, with the increased availability of DCOs, quantifying the energy generation characteristics and benefits of DMPPT solutions becomes necessary for the design of LPPs (Khan and Xiao, 2017; Wijeratne et al., 2019). Existing studies on this point can be divided into two categories. The former focuses on short-term performance under some specific mismatching conditions. Olalla et al. (2013) demonstrated that a portion of energy loss due to partial shading and panel aging can be recovered by distributed power electronics, and the corresponding economic evaluation method is carried out. Simulation results in the study by MacAlpine et al. (2012) proved that panel-level power optimization can recover 34–42% of the short-term energy lost to partial shading caused by clouds. However, the medium- or long-term analysis is more valuable and persuasive for the design of an LPP. Therefore, some researchers turn their attention to the long-term energy production of LPPs based on the experienced data. The literature (De Prada-Gil et al., 2016) has utilized the reliability multi-state models which assume that each PV module has several states of service to the annual output calculation and evaluation of PV plants. However, the micro-converter is designed for a PV string or array rather than the panel level. The literature (Hanson et al., 2014) has shown an annual generation performance increase of 5.8% after installation of the module-level DCO, which is verified experimentally against a system that has site survey images. Nevertheless, the energy loss due to panel-level mismatch that occurs in series-connected PV-DCO units is underestimated, since it is assumed to be an ideal situation that all the PV panels can operate in their independent MPPT modes under severe partial shading conditions, which is impossible in practice. Moreover, since only one topology of the DCOs is taken into consideration in the studies by De Prada-Gil et al. (2016) and Hanson et al. (2014), the comparative analysis of the operational characteristics and economic benefits with different DCO topologies is lacking, which involves the structural optimization design of DCO-based distributed LPPs.
Within the context alluded to above, this article presents a modeling and analysis method for the long-term energy generation evaluation (on the year level) of the LPPs equipped with panel-level DC optimizers, which considers three different topologies for DCOs and multiple types of mismatch conditions that occur in PV strings and arrays. Besides, the improved DMPPT control strategies designed for cascaded PV-DCO generation units are proposed, and then the solar energy loss caused by array mismatch problems can be greatly compensated for the LPPs compared with the traditional GMPPT control strategy. The main contributions of this study are listed as follows:
• A static modeling method is presented for the DCO-based distributed LPPs to study the long-term energy generation performances during 1 year with hourly simulation accuracy, combining historical hourly weather data and various mismatching factors.
• For various DCO topologies including Boost, Buck, and Buck-boost, different control strategies for the PV strings equipped with series-connected DCOs are proposed to maximize the energy production of LPPs when suffering severe mismatch conditions.
• An energy generation evaluation method is proposed to analyze the economic benefits of LPPs, based on the Levelized cost of energy (LCOE) which considers the trade-off between energy production yields and plant investment costs during the life cycle of LPPs.
• Contrastive analysis with six typical centralized or distributed PV plant configurations is carried out to explore the optimal structure and layout for LPPs during the long-term energy generation, and then the suggestions for design improvement can be given.
The rest of this article is organized as follows. Fundamental Models introduces the fundamental model of the PV-DCO generation unit. Control Strategies for Series-Connected PV-DCO Units proposes the control strategies for series-connected PV units based on the operational characteristics of the PV-DCO strings with different topologies. Framework for Static Modeling of Energy Generation Evaluation presents the framework of the static modeling method for the evaluation of the long-term energy generation performance in LPPs. Case Study gives the case studies involving six typical PV plant configurations. Finally, the conclusions are drawn in Conclusion.
Fundamental Models
Model of PV Panels
PV panels are the main components of a PV plant, which generate power based on the photoelectric effect on semiconductor materials. Usually, a simplified engineering model for describing the current-voltage characteristic of a PV panel is employed in the design of the PV system (Ma et al., 2019), as shown in Eqs 1, 2:
where U and I represent the operating voltage and current for PV panels, C1 and C2 are intermediate variables that are determined by four electrical parameters: short-circuit current Isc, open-circuit voltage Uoc, the voltage Um, and the current Im at the maximum power point. Solar radiation S and temperature T are the environmental factors around the PV panels, which affect the above four parameters with a certain rule as indicated in Eq. 2, resulting in the differences in current-voltage characteristics.
Model of DCOs
In DMPPT configurations, DCOs are introduced and equipped on the output port of PV panels to track the MPP and adjust the output voltage of PV-DCO generation units by changing the conversion ratio. The inherent voltage limit characteristic for DCOs is shown in Eq. 3:
where the Uin and Uout represent the input and output voltages of the DCO, the kdco indicates the conversion ratio of the DCO, and the kdcomin and kdcomax are the lower and upper limits of kdco, which bound the operating range according to the electrical topology of the DCO. Three topologies including Boost, Buck, and Buck-boost are discussed in this article. Boost topology owns the characteristic of converting the input voltage to a higher output voltage while Buck topology is the opposite. Buck-boost topology combines the features of both Buck and Boost topologies. The upper and lower bands of the conversion ratio kdco for different topologies are given as follows (Wang et al., 2013):
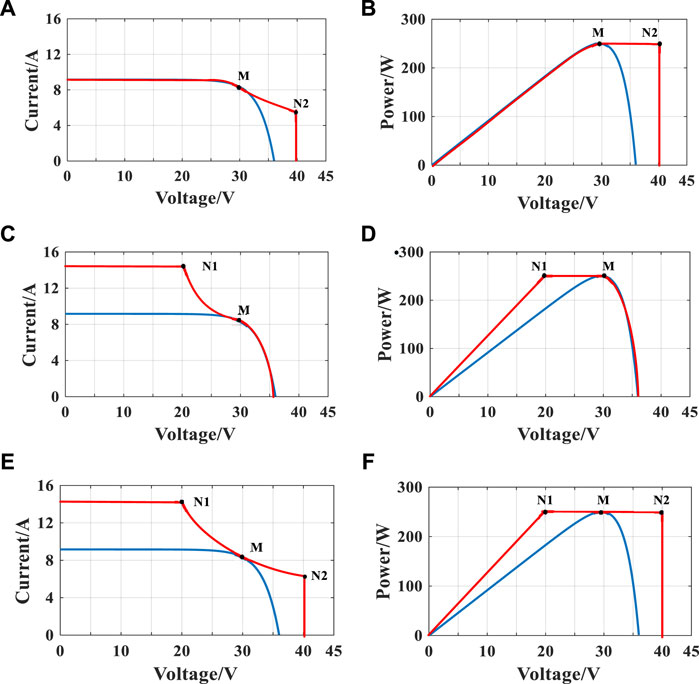
With the above operational constraints, the operational capability of the three DCO topologies when connected to the PV panel can be presented in Figure 2. The output characteristic curves of DCOs are in red and the tracked PV panels are in blue: (A), (C), and (E) represent current-voltage curves while (B), (D), and (F) represent power-voltage curves. M indicates the maximum power point of the PV panel while N1 and N2 stand for the point with minimum and maximum operating voltages for each DCO, respectively. These characteristic curves will be used as constraints for the optimization program involving the energy generation evaluation of LPPs described in Framework for Static Modeling of Energy Generation Evaluation.
Control Strategies for Series-Connected PV-DCO Units
For DCO-based PV systems, each DCO is connected with a PV panel from the input side to implement the MPPT algorithm on the controller of the DCO. At the output side, DCOs connect either in parallel or in series according to the voltage limit characteristic of PV inverters. The series or parallel connections are all applicable for the Buck-boost topology since the range of the PV operating voltage in this topology is flexible. However, the disadvantages of low efficiency and complex control technology limit its application and popularization. For Buck topology, the series connection is the only choice due to its lower voltage output; in this way, the output voltage of the whole PV arrays can be raised to match the rated voltage of grid-connected inverters through the sum of DCO voltages in series. On the contrary, the Boost topology is suitable for both series and parallel connections due to its higher voltage output feature.
The parallel connection structure is easier to control and achieve the maximum power output. However, the higher voltage conversion ratio between a single PV panel and DC link may limit the efficiency of the DCO. For the series connection structure, a lower voltage conversion ratio means higher efficiency. However, either the Boost or the Buck topology, the DCOs connected in series will inevitably influence each other for their unilateral operation capability (the features that can only increase/decrease the voltage), which led to the maximum available power sometimes being unachievable when suffering mismatch. This is the reason why the series-connected DCOs cannot control each PV panel in its own individual MPPT mode under severe partial shading conditions. Therefore, analyzing the interactions between the PV-DCO generation units in a PV string is critical, and the corresponding control strategies for the PV-DCOs should be studied to maximize energy generation when the PV panels deployed in the arrays cannot work in the MPP mode simultaneously. The rest of this section presents the control strategies for series-connected Boost DCO and Buck DCO based on that.
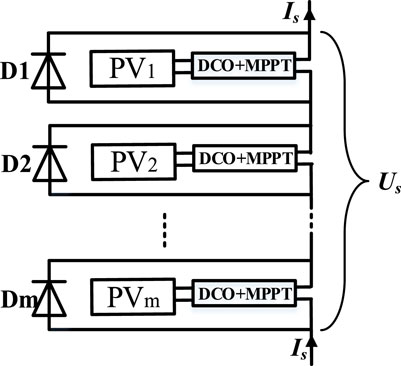
Figure 3 shows a PV string consisting of PV panels connected in series by corresponding DCOs and bypass diodes. The output voltage and current of each DCO in a PV string should satisfy Kirchhoff’s law:
where m represents the number of DCOs in a PV string and i indicates the index. Us and Is represent the string voltage and current, respectively. UDCO,i and IDCO,i are the output voltage and current of the ith DCO. As several PV strings in parallel share a common DC link in a PV array (as shown in Figure 1), the output voltages of all the strings equal the DC link voltage UDC. When suffering serious mismatch conditions, series-connected Boost or Buck DCOs are unable to make all PV panels work in the MPP mode while satisfying the rated operating range of the DC link voltage because the operating range of the panels (the current-voltage characteristic curves) under severe partial shading could be narrowed and the conversion ratios kdco may exceed the threshold values.
Control Strategy for Boost Topology
Assuming that each panel in the PV string can operate at the maximum power point (PMPP,i, UMPP,i, and IMPP,i), the ideal maximum output power Pmax and current Imax of the string could be obtained by using Eq. 8:
where PMPP,i, UMPP,i, and IMPP,i indicate the power, voltage, and current of the ith PV panel at the MPP working mode, and UDC is the rated DC link voltage. Combining (4) and (7), the constraint between the string output current and individual panel operating current can be given in Eq. 9 due to the topological feature where the input current must be greater than the output current for the Boost DCO (kdco ≥ 1).
If Eq. 9 is satisfied for all PV-DCO units, the PV string could obtain the ideal maximum output power Pmax and all of the PV panels could reach the MPP. This usually happens when there are no mismatch problems in the PV array. However, when suffering the mismatch conditions such as the partial shading, the MPP currents IMPP,i of the panels shaded by the cloud will be reduced. In severe cases, the IMPP,i of the shaded panels could be less than the Imax; then Eq. 9 will not be satisfied and this part of PV panels cannot operate in the MPPT mode. There are two choices to be compared:
a. Bypassing the shaded PV panels and the remaining normal PV panels are controlled in the MPPT mode.
b. Adjusting the working points of normal PV panels slightly below their MPP points and the shaded PV panels are controlled in the MPPT mode.
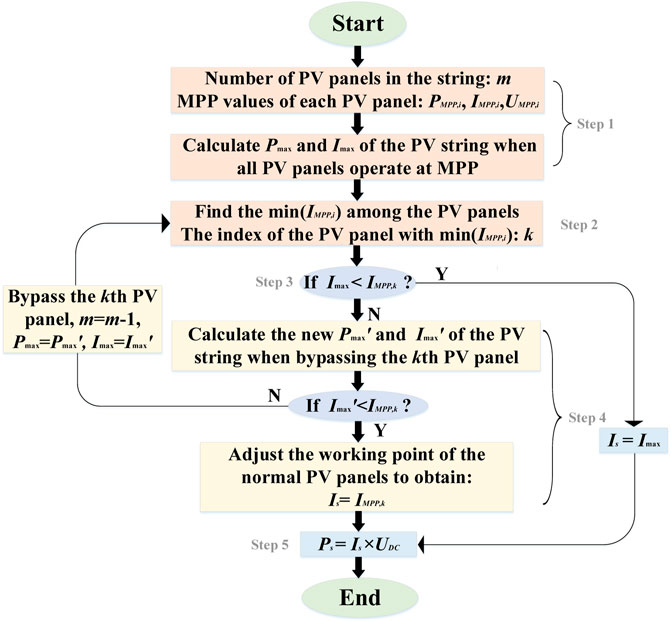
Based on the above two treatments, the flowchart of the control strategy for obtaining the maximum power output of the PV string can be presented as shown in Figure 4. Briefly, the first step involves calculating the output power Pmax and current Imax of the PV-DCO string when all series-connected PV panels operate in the MPPT mode, based on the simplified PV engineering model as indicated in Eqs 1, 2, 8. Step 2 then finds the minimum MPP current IMPP,k of the PV panels. Step 3 compares the quantitative relationship between the IMPP,k and Imax and determines whether all PV panels can operate in the MPPT mode. If the boolean output is “Y,” perform the string power calculation in final Step 5. Otherwise, Step 4 determines whether the panels under partial shading should be bypassed to maximize the power generation. Finally, Step 5 calculates the total power output of the PV string after the optimization process.
Control Strategy for Buck Topology
Similarly to the Boost topology, the ideal string power and current should be first calculated using Eq. 8. Considering (5) and (7), the value of the string current should be bigger than the operating current of all PV panels (kdco ≤ 1), which can be expressed as follows:
If constraint Eq. 10 is satisfied for all PV-DCOs, the PV string could obtain the Pmax and all of the PV panels could work at the MPP. Otherwise, the normal PV panels with the higher MPP current IMPP,i cannot operate in the MPPT mode and should be transferred to a new working point (Pnew,j, Unew,j, Inew,j) below the MPP, to obtain the maximum power output of the PV string in case of maintaining a current balance. The corresponding control method can be expressed in Eq. 11:
where n represents the number of normal PV panels and j indicates the index, u represents the index of the shaded PV panels from n+1 to m, and Ps stands for the maximum power output by the PV string after the adjustment.
Control Strategy for Buck-Boost Topology
Different from the Buck or Boost topology, the conversion ratio kdco of DCOs in the Buck-boost topology is more flexible with a larger value range as indicated in Eq. 6. Thus, there is no fixed quantitative relationship between the output current of the PV string Is and the operating current of PV panels IMPP,i. All of the series-connected PV panels can output their own individual MPP power whether there is a mismatch condition in the PV array or not. The control strategy, in this case, remains the same as the original DMPPT control.
Framework for Static Modeling of Energy Generation Evaluation
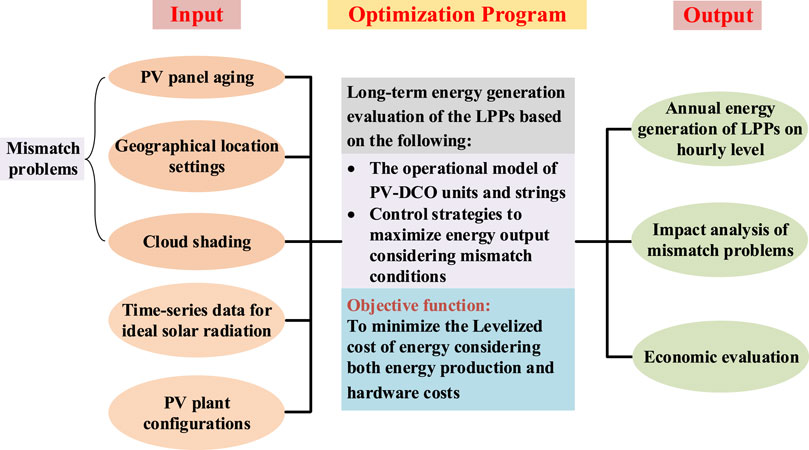
This section gives a static modeling method for the evaluation of long-term energy generation performances of LPPs. The model framework is shown in Figure 5. First, the input information of the optimization program in the model should be clarified. PV panel aging, geographical location settings, and partial shading by clouds, which may cause mismatch conditions on PV energy harvest, are modeled and analyzed as the input information. Besides, the other two input variables are the time-series data for the ideal solar radiation and plant configurations, which are the basic parameters for a certain PV plant. With these five input information, the optimization process of the long-term energy generation evaluation of LPPs can be carried out based on the operational model of PV-DCO units/strings and the control strategies of DCOs described in Fundamental Models and Control Strategies for Series-Connected PV-DCO Units. The objective function of the optimization model is to minimize the LCOE of LPPs during the life cycle. Finally, the output information including the annual hourly energy generation data, the impact analysis of mismatch problems on energy production, and the economic evaluation for LPPs of different structures under various scenarios can be obtained to explore the energy generation performances and economic benefits for the DCO-based distributed LPPs.
Impact Factors for Mismatch Conditions
PV Panel Aging:
The aging is inevitable and shows the individual difference in a PV array. For a PV panel, the main reason for the loss in energy production when aging occurs is the degradation in short-circuit current (Chandel et al., 2015), as shown in Eq. 12:
where
Considering that the aging coefficient is reflected in the variation of short-circuit current, the modified current-voltage characteristic considering PV panel aging can be deduced by substituting the Eq. 12 to Eq. 1 as follows:
Geographical Location Settings:
The mismatch condition caused by geographical location settings can be reflected in the different solar radiation received by individual PV panels in the PV plant (Seme et al., 2019). The actual solar radiation S(t) received by the PV panel placed at an inclined angle of
where Ss(t) is the vertical incident short-wavelength light intensity in the horizontal plane, and
After the site of the PV plant is determined, the time-series data for ideal solar radiation Ss(t) can be obtained from the MERRA as shown in Figure 6 (take Jiuquan of Gansu Province as an example). The variation trend of the maximal solar radiation received by PV panels is consistent with the declination angle of the Sun δ from the first hour to the 8760th hour during a year. When given the known Ss(t), the actual solar radiation received by the PV panel is mainly influenced by the inclined angle
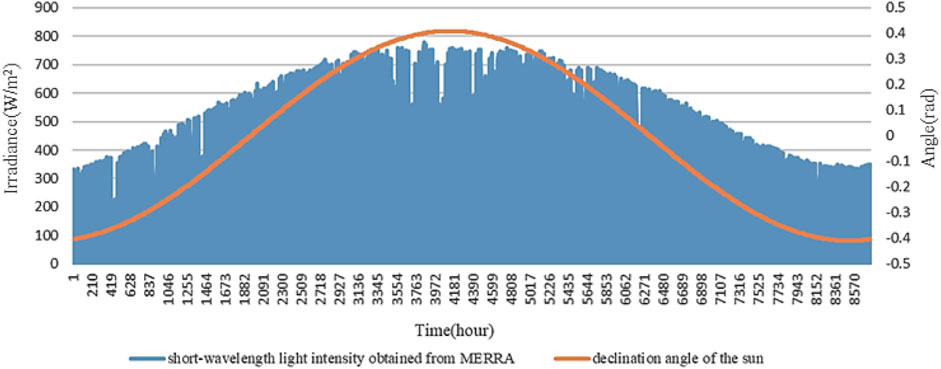
FIGURE 6. Hourly data for the ideal solar radiation Ss(t) received by the PV panel and the declination angle of the Sun
Partial Shading by Clouds:
Irradiance fluctuations due to cloud shading are the main cause of mismatch problems in LPPs. Power losses can be up to 25% during a partial shading event caused by the slow-moving clouds. Therefore, the impact of moving clouds on the solar radiation received by PV panels is supposed to be investigated.
Figure 7 gives a simplified simulation of the cloud movement for a 12 × 9 PV array consisting of 108 PV panels. The moving direction is from the upper left to the bottom right (Sánchez Reinoso et al., 2013). The effective radiation received by each PV panel is reduced in proportion to the coverage of the cloud (the gray area) at a given time, as expressed in Eq. 16:
where coordinate (x,y) indicates the position of the PV panel in a PV array, S and Sc represent the solar radiations received by the PV panel before and after partial shading occurs, respectively, and
Available PV Plant Configurations
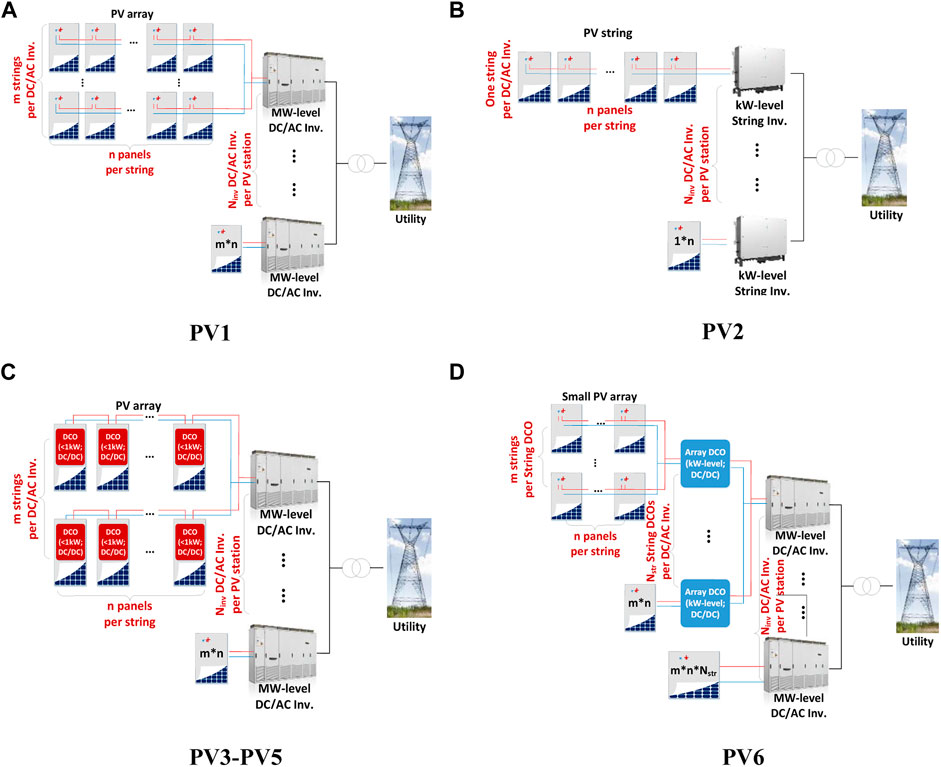
Six typical centralized (PV1∼PV2) or distributed (PV3∼PV6) configurations of LPPs are carried out for comparison in this study, as shown in Figure 8: PV1---PV plant with conventional array-level central inverters; PV2---PV plant with string-level inverters; PV3---PV plant with series-connected panel-level Boost DCOs and central inverters; PV4---PV plant with series-connected panel-level Buck DCOs and central inverters; PV5---PV plant with series-connected panel-level Boost-Buck DCOs and central inverters; and PV6---PV plant with small array-level Boost DCOs in parallel and central inverters.
PV1 represents the conventional array-level GMPPT configurations and can be viewed as the baseline scenario. In this configuration, several PV panels are series-connected to form a PV string by corresponding bypass diodes, and then several PV strings are parallel connected into a PV array by corresponding blocking diodes. Each PV array is connected with a central converter. The numbers of series-connected PV panels Npanel and parallel-connected PV strings Nstring in a PV array are constrained by the parameters of central inverters, given in Eqs 17–19:
where UDCmax and IDCmax represent the maximum input DC voltage and current of the central inverter, respectively. Umpptmin and Umpptmax show the lower and upper operation voltage limits for the MPP tracker. Tmin and Tmax indicate the minimum and maximum ambient temperature for PV panels.
PV2 employs string-level inverters equipped with multiple MPP trackers in place of central inverters compared to PV1. An improvement of power generation by implementing string-level MPPT can be achieved in this configuration, but still belonging to the GMPPT architecture. Similar constraints should be satisfied for string inverters as indicated for central inverters.
PV3–PV5 are series-connected DMPPT architectures with three different topologies of DCOs. PV-DCO units are connected in series to form a PV-DCO string with panel-level decentralized MPPT implementation. Several PV-DCO strings share a common DC link in a PV system and are connected to the central inverter. The series-connected PV-DCO units for PV3–PV5 are constrained by Eqs 4–6, respectively, and the proposed control strategies are adopted.
PV6 shows the parallel-connected DMPPT architectures. Buck topology can only convert the voltage to lower and Buck-boost topology may suffer lower conversion efficiency than boost topology under the same conversion ratio. Thus, the Boost topology is chosen for the DCOs in this configuration to match the high-level DC link voltage for central inverters. Besides, a small PV array instead of a single panel is connected to the input side of the Boost DCO since the difference between the panel-level voltage and the DC-link voltage is so high that it results in lower energy generation efficiency of LPPs.
The total number of PV panels employed for each type of plant configuration should be identical in the following comparative analysis in Case Study.
LCOE Calculation
The LCOE is used for the economic evaluation for the long-term energy generation performances of LPPs in this study, which equals to the hardware cost C divided by the total energy production Plife during the life cycle, given by Eq. 20:
The hardware cost considering the capital and installation costs of PV components Ci, as well as the operation and maintenance costs Com over the lifetime of PV plants, is expressed in Eq. 21:
where CW is the installation cost per unit capacity of the PV components, including PV panels, inverters, DCOs, cables, etc., and W represents the installed capacity. Rom and nlife indicate the annual O&M rate and life cycle of a PV plant, respectively.
The life-cycle energy production Plife is calculated based on the energy yield for the first year P1 and the annual energy loss coefficient Ap, given by Eq. 22:
Assuming that the power loss of PV plants caused by PV panel aging grows linearly year by year, the Ap could be calculated by dividing the reduced energy production for the 25th year compared with the 1st year by the nlife (the life cycle is 25 years in this study). The energy reduction (P25—P1) during the life cycle can be obtained after the optimization process of annual energy production (as presented in Figure 5) for the 1st year and 25th year, respectively.
Case Study
In this section, different case studies are carried out to verify the correctness and validity of the proposed static model and energy generation evaluation methods. First, the hourly energy generation performances without mismatch problems are studied. Second, the impact analysis of the various mismatching factors on long-term energy generation of LPPs is presented, and the simulation scenarios only considering one mismatching factor are built, including the PV panel aging, the geographical location settings of plants, and the partial shading condition caused by clouds. Finally, the comparative analysis of the six typical PV plant configurations for the operational economy of LPPs is simulated combining three different mismatching factors, to explore the optimal structure and layout.
Data Preparation
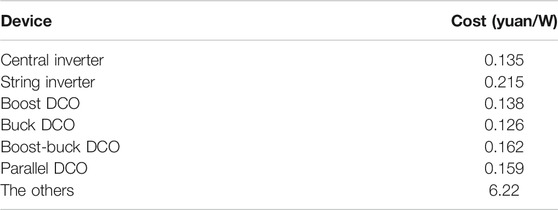
The investigated PV plant is assumed to be located in the city of Jiuquan, Gansu province (98.5E, 40N), in which all the PV panels are placed at the best-inclined angle. The total capacity of the PV plant is 10 MVA. Solar radiation and temperature profile are obtained from Modern-Era Retrospective Analysis for Research and Applications (MERRA) (Project Science Office (2016). Table 1 gives the parameter values of the employed PV panels. The parameters of central inverters, string inverters, and three types of DCOs are collected from three manufactures (ABB; Sungrowpower; Solaredge, 2021), as well as the relationship curves between conversion efficiency and input power of the electrical topologies. According to the rated capacity of the PV plant and the nominal DC output power of PV panels, the layouts of the six typical PV plants are listed in Table 2 to be compared. Table 3 investigates the investment costs per unit of capacity for the components of PV plants (Annual Energy Outlook, 2019). The life cycle of the LPP is set as 25 years as stated in the latest global PV report (World Energy Outlook, 2020). The annual O&M rate for a PV plant is usually 3% (U.S. Energy Information Administration, 2019).
Hourly Energy Generation Performances Without Mismatch Problems
Assuming that all the PV panels in the PV plant are placed at the azimuth of zero, and there is no PV panel aging and cloud shading events in the PV array. In other words, the mismatch conditions are not considered in this scenario. The total energy production of the PV plant for six typical configurations during a year is calculated on the hour level as displayed in Figure 9.
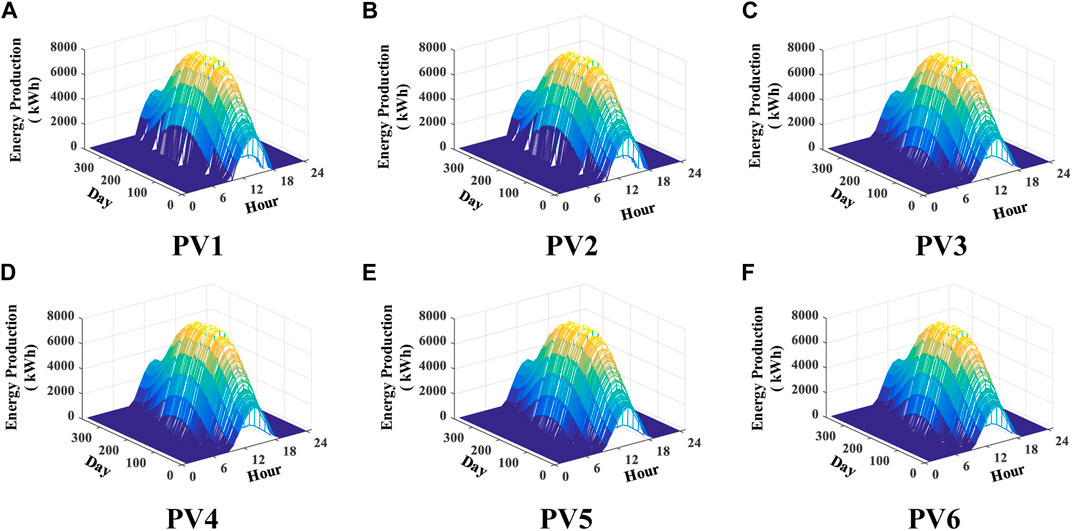
FIGURE 9. Energy production for each hour during a year of the six configurations. (A) PV1. (B) PV2. (C) PV3. (D) PV4. (E) PV5. (F) PV6.
As shown in Figure 9, the shape of the energy envelope curve mainly depends on the solar radiation received by the PV plant when there are no mismatch problems. The generation performances among these six configurations are similar since there are no energy loss events caused by mismatch conditions and the advantages of DMPPT structures cannot be highlighted. Since the solar radiation around noon is better than that in other times, the energy generation will also peak at about 12:00 and drop to almost zero before 8:00 and after 19:00 in a day. Besides, the daily peak values of energy production throughout the year show a similar variation trend to that of the ideal solar radiation distribution as shown in Figure 6. More specifically, PV1 and PV2 can yield more power than the other four configurations during the periods with stronger solar radiation in a day for the reason of not considering the transmission loss of DCOs. However, during the periods (08:00, 09:00) and (18:00, 19:00) in a few days, the energy production for PV1 and PV2 is nearly zero since the received radiation is too poor to produce sufficient input voltage for the GMPPT operation of centralized inverters. Therefore, total annual energy production for DMPPT configurations may exceed PV1 and PV2 if the conversion efficiency of DCOs is high enough.
Impact Analysis of Mismatch Problems
The impacts of the three factors for mismatch conditions on solar energy yields of LPPs are analyzed one by one in this section.
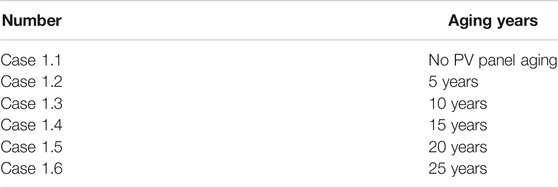
PV Panel Aging: Assuming that all the PV panels in the PV plant are placed at the same azimuth of zero and there is no cloud shading. Six cases are set as listed in Table 4 to analyze the impact of PV panel aging on the long-term energy production of LPPs. Considering that the difference of aging degrees between PV panels in an array will increase as the aging year increases because of the multiplicative effects of the random variable
Figure 10 compares the energy production performances for six typical PV configurations under the given cases: (A) annual total energy production of LPPs and (B) the average increased energy production per hour (marked in the red lines) for PV2∼PV6 compared to PV1 in case 1.6. In Figure 10A, the energy productions of the PV plant for all configurations decrease from case 1.1 to case 1.6 since the energy loss caused by the PV panel aging becomes more serious with the increase in the aging coefficient. Comparing Case 1.1 to Case 1.6, the energy loss in PV1 and PV2 is greater than that in PV3∼PV6 due to the lower generation efficiency of the GMPPT structure compared to the DMPPT deployment when suffering mismatch conditions. Besides, the overall energy generation level in PV1 is lower than that in PV2 due to the array-level GMPPT control. On the other hand, it can be found in Figure 10B that PV2 owns the minimum average energy production level (63.64 kWh) while PV3 and PV4 enjoy the maximum (about 92.35 kWh). It indicates that the mismatch problems caused by the difference in the aging coefficients of PV panels could be greatly mitigated by the proposed control strategies of Boost and Buck DCOs. Since the energy transmission efficiency is lower for Buck-boost DCOs, the generation level in PV5 (77.71 kWh) is between that of PV1 and PV3/PV4. PV6 shows a smaller production increase (74.11 kWh) than PV5 because of the greater effect of mismatch problems in small array-level DCO deployment compared with the panel-level DMPPT structure. Moreover, the box areas in PV3 and PV4 are almost zero, which shows the smaller variance of the hourly energy generation performances throughout a year compared with other configurations, resulting in better stability for energy capture with the proposed control strategies for DCOs.
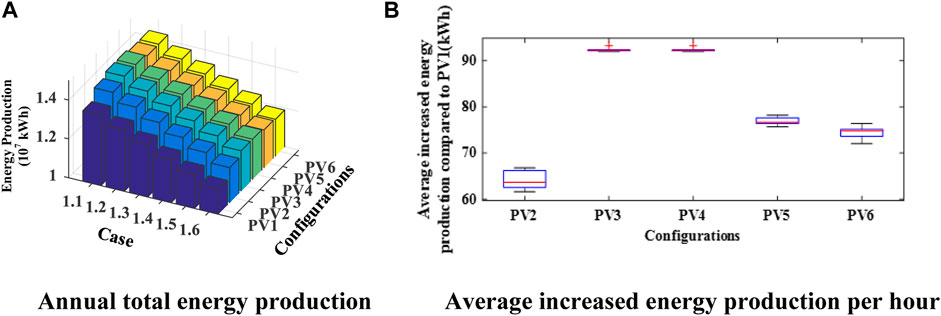
FIGURE 10. Comparison of six cases for the PV panel aging. (A) Annual total energy production. (B) Average increased energy production per hour.
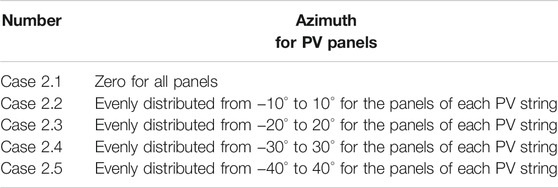
Geographical Location Settings: Assuming that there is no PV panel aging and cloud shading events. Five cases are set as listed in Table 5 to analyze the impact of the azimuth setting of PV panels on the energy production of LPPs (Case 2.1 is the baseline scenario). Considering the terrains of PV plant sites could be gentle or steep, the PV panels should be placed at various azimuths to maximize the received solar radiation.
The comparison of the energy production performances for six typical PV configurations in the five given cases is displayed in Figure 11: (A) annual total energy production of LPPs and (B) the average increased energy production per hour (marked in the red lines) for PV2∼PV6 compared to PV1 in case 2.5. Similar to the conclusions drawn in the cases for PV panel aging, the energy productions of LPPs decrease from case 2.1 to case 2.5 gradually as shown in Figure 11A since the azimuth settings for PV panels are more uneven and the solar radiations accepted by PV panels become less. The DMPPT configurations including PV3∼PV6 show a better mitigation effect for the energy loss under mismatch conditions. In Figure 11B, the average increased energy production per hour for PV2∼PV6 are 69.29 kWh, 101.71 kWh, 102.06 kWh, 85.61 kWh, and 85.16 kWh, respectively, whose variation trend is similar to the analysis of case 1.6 (as shown in Figure 10B). However, the box areas of PV3 and PV4 become manifest, which indicates that the mismatch problems caused by geographical location settings impose a bigger influence on long-term energy production than that for the PV panel aging, and the DMPPT technology could not completely make up for the energy loss sometimes.
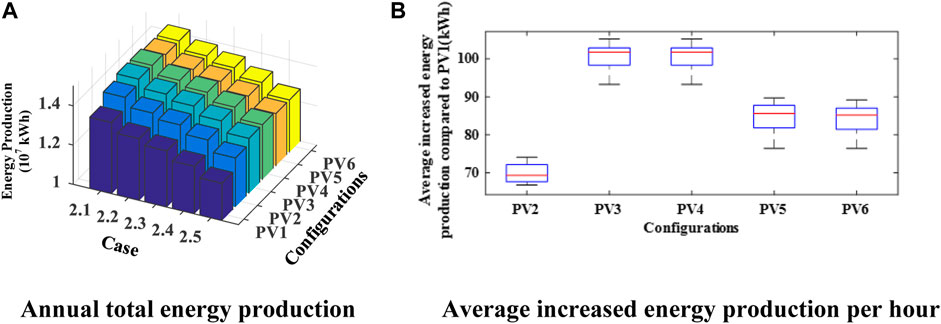
FIGURE 11. Comparison of five cases for the geographical location settings. (A) Annual total energy production. (B) Average increased energy production per hour.
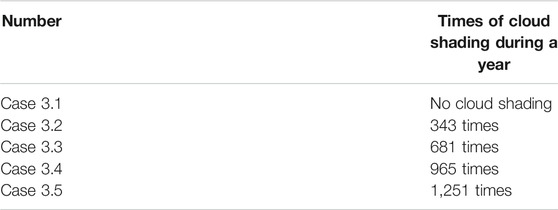
Partial Shading by Clouds: Assuming that all the PV panels in the PV plant are placed at the same azimuth of zero and there is no PV panel aging. Five cases are set as listed in Table 6 to analyze the impact of cloud shading on the energy production of LPPs (Case 3.1 is the baseline scenario). The duration of the partial shading caused by clouds is assumed as 1 h per time, and the cloud cover coefficient τ is generated in a random way.
Figure 12 shows the energy production comparison for six configurations in the five given cases: (A) annual total energy production of LPPs and (B) the average increased energy production per hour (marked in the red lines) for PV2∼PV6 compared to PV1 in case 3.5, a severe mismatch scenario. As shown in Figure 12A, the annual energy productions of the PV plant for all configurations also decrease from case 3.1 to case 3.5 since the more times the cloud shading occurs, the less radiation the panels receive, and the more energy is lost. However, it should be noted that the rank of the six PV configurations for the energy production level in cases 3.1–3.5 shows some differences compared to the first two case sets (cases 1.1–1.6 and 2.1–2.5). More specifically, PV4 enjoys better energy generation performances than PV3. It indicates that a better effect can be obtained with the control strategy of series-connected Buck DCOs to deal with the mismatch problems than that of series-connected Boost DCOs. The main reason is that the severely shaded PV panels may be shorted by the bypass-diodes according to the control strategy of Boost DCOs to avoid affecting the solar energy utilization of normal panels in PV-DCO strings; nevertheless, all of the PV panels within the strings can output the power in Buck-DCO–based LPPs.
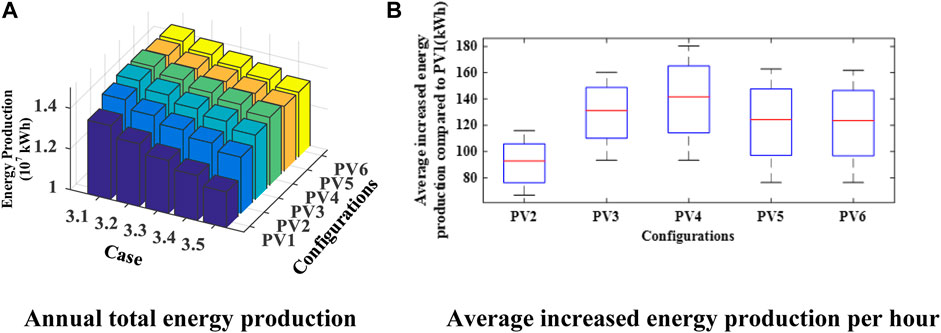
FIGURE 12. Comparison of five cases for the partial shading by clouds. (A) Annual total energy production. (B) Average increased energy production per hour.
Similarly, the average increased energy production per hour for PV2∼PV6 is 92.69 kWh, 131.05 kWh, 141.55 kWh, 124.31 kWh, and 123.51 kWh, respectively, which is consistent with the changing trend of the annual total energy production levels in Figure 12A. Besides, the significant increases in the box areas of all configurations can be found in Figure 12B, which proves that the mismatch problems caused by cloud shading impose the biggest influence on the long-term energy production performances compared to the other two factors including the PV panel aging and geographical location settings. Although the DCO-based DMPPT technology could not entirely mitigate the power loss when suffering serious partial shading, the improvement of energy production is still considerable compared to the GMPPT-based LPPs (PV1 and PV2).
Synthetic Analysis and Economic Evaluation
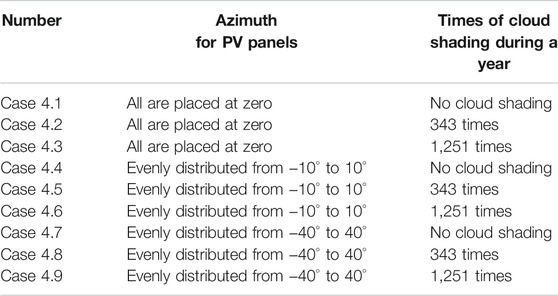
To combine all the impact factors, three types of mismatch conditions are coordinated in this section for the synthetic analysis and economic evaluation of the long-term energy generation performances of LPPs. Nine cases are carried out as listed in Table 7 to compare the life-cycle energy production characteristics and the LCOEs for six PV plant configurations based on (20–22). Since the effect of the panel aging on power loss is less than the other two factors, the annual aging coefficients for all the cases are set as the same. Different combinations for the placed azimuth for PV panels and times of partial shading by clouds in a year are reflected in these nine cases.
Figure 13 simulates the trend of life-cycle energy production in two dimensions (azimuth and partial shading) to include all possible mismatch conditions bounded by the settings in Table 7 from PV1 to PV6. Energy production decreases with either the increased placed azimuth for PV panels or times of cloud shading. For PV1 and PV2, the energy yields are smaller than those in the other four DMPPT configurations during the life cycle. Besides, the mean curvatures of the surface that represents the decline rates of energy production when suffering a mismatch are larger in PV1 and PV2, showing that the DMPPT is superior to the GMPPT in dealing with mismatch conditions. Similarly, it can be seen that PV4 enjoys the most energy generation level and the least decline rate when suffering mismatch, which indicates that the Buck topology is a superior choice for the long-term energy generation over the entire life cycle for LPPs.
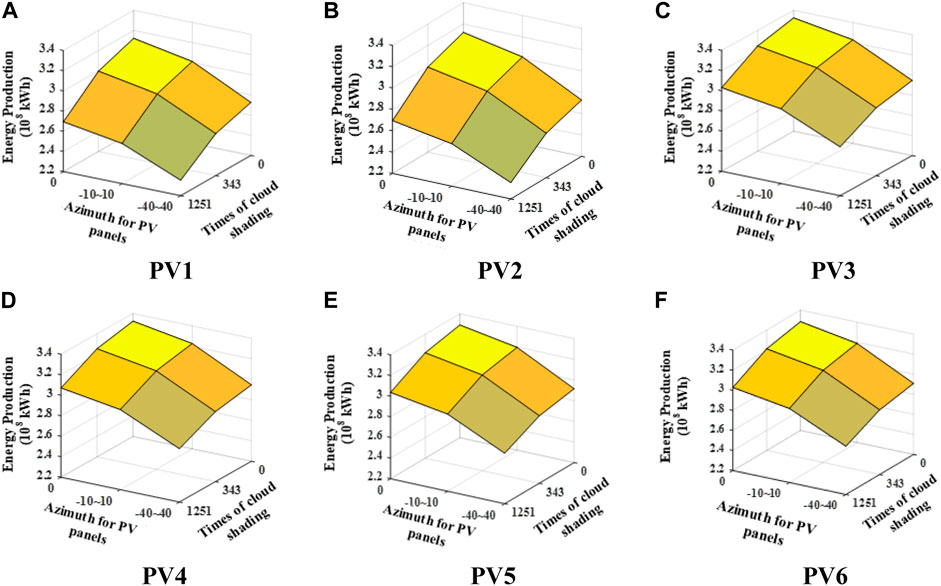
FIGURE 13. Life-cycle energy production of PV plants for six configurations. (A) PV1. (B) PV2. (C) PV3. (D) PV4. (E) PV5. (F) PV6.
On the other hand, the total investment costs of LPPs for six configurations can be calculated as given in Table 8. PV1 enjoys the least hardware cost due to its simple structure. PV2 owns the most investment cost due to the expensive string inverters. The costs for PV3 and PV4 are different since the hardware cost of Buck DCOs is less than that of Boost DCOs. Besides, deploying panel-level power electronic devices requires additional costs compared to PV1. PV5 and PV6 share almost the same cost, which is more expensive than that in PV3 and PV4 since the higher voltage ratios between DCOs and inverters in PV5 and PV6 require the higher cost for DCOs.
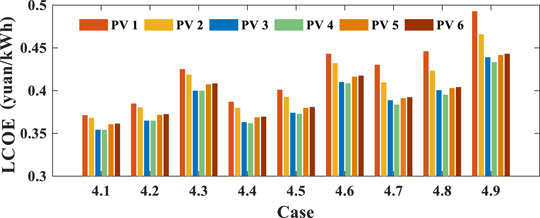
Based on the life-cycle energy production and total investment costs, the LCOE of the six PV configurations in cases 4.1–4.9 can be calculated using Eq. 20 as shown in Figure 14. For each PV configuration, the LCOE shows the same changing trend from case 4.1 to case 4.9 since more energy production corresponds to a smaller LCOE when the investment costs are the same. In addition, it can be seen that PV3∼PV6 show more cost-effective LCOE for all the cases than PV1 and PV2. The main reason is that the additional benefit from increased energy generation with DMPPT control methods is more than the additional costs for the deployment of the panel-level DCOs; in other words, net earnings are achieved by the DCO-based distributed structures for LPPs compared to the GMPPT configurations. More importantly, when the mismatch problems become more serious, the PV4 configuration equipped with the Buck DCOs shows more competitive LCOE performances for all the nine cases due to the more efficient control strategy for energy generation and the lower hardware costs for DCOs, compared with the PV3 configuration involving Boost DCOs.
In conclusion, the PV4 configuration deploying panel-level Buck DCOs and the corresponding DMPPT control strategy is the optimal choice for LPPs in terms of the optimization objective for minimizing the LCOE. PV3, PV5, and PV6 own a relatively lower LCOE than PV1 and PV2, which can be regarded as the sub-optimal solution depending on the actual operational situation of PV plants.
Conclusion
This article presents a modeling and energy generation evaluation method for large-scale PV plants equipped with panel-level DCOs. Based on the operational characteristics and the proposed control strategies for PV-DCO strings with three different topologies (including Boost, Buck, and Buck-boost), the design-oriented analysis method is proposed for the economic evaluation of the long-term energy generation performances in LPPs, considering frequent mismatch conditions. The modeling for various factors affecting mismatch problems, including panel aging, geographical location settings, and partial shading by clouds, are structured in this study. After that, six typical centralized or distributed PV plant configurations are carried out for comparison analysis, and finally, the optimal designing scheme with the least LCOE is obtained for LPPs. The main conclusions can be listed as follows:
a. The influence of the partial shading by clouds on the mismatch problems is more serious than that of the PV panel aging and geographical location settings.
b. The DCO-based DMPPT configurations, especially the Buck topology, have higher energy utilization efficiency than the GMPPT operation structure in terms of the long-term energy generation performances for LPPs when considering frequent mismatch.
c. The PV plant configuration, which deploys panel-level Buck DCOs and the proposed control strategy for maximizing solar energy captures, is the economically optimal choice for LPPs with the least LCOE.
It is worth pointing out that the interaction for the power flow between PV power plants and the thermal power generators of AC systems is not considered in the proposed static models. Since the unit commitment could affect the power output of PVs, the power flow calculation methods for the power system incorporating the DCO-based large-scale distributed PV plants can be further studied in our future works for the steady-state power flow studies of practical electrical networks.
Data Availability Statement
The original contributions presented in the study are included in the article/Supplementary Material; further inquiries can be directed to the corresponding author.
Author Contributions
QW and JF contributed to the conception and design of the study. QW, LL, DL, XA, and JF organized case studies. QW wrote the first draft of the manuscript. All authors contributed to manuscript revision and read and approved the submitted version.
Funding
This study received funding from the Science and Technology Project of State Grid Hubei Electric Power Company Limited (Number: SGHB0000DKJS2104209). The funder had the following involvement with the study: the organization of case studies, the manuscript revision of this article and the decision to submit it for publication.
Conflict of Interest
DL was employed by State Grid Hubei Electric Power Company Limited.
The remaining authors declare that the research was conducted in the absence of any commercial or financial relationships that could be construed as a potential conflict of interest.
The reviewer DC and the handling editor declared their shared affiliation at the time of the review.
Publisher’s Note
All claims expressed in this article are solely those of the authors and do not necessarily represent those of their affiliated organizations, or those of the publisher, the editors, and the reviewers. Any product that may be evaluated in this article, or claim that may be made by its manufacturer, is not guaranteed or endorsed by the publisher.
Abbreviations
DCO, DC optimizer; DMPPT, distributed maximum power point tracking; GMPPT, global maximum power point tracking; LCOE, Levelized cost of energy; LPP, large-scale PV plant; MERRA, Modern-era retrospective analysis for research and applications; PV, photovoltaic.
References
Abb (2020). Main Parameters and the Relation Curve between Efficiency and Output of central Inverter. Available at: https://search.abb.com/library/Download.aspx?DocumentID=3AXD50000026013&LanguageCode=en&DocumentPartId=1&Action=Launch. (Accessed February 11, 2020).
Alik, R., and Jusoh, A. (2018). An Enhanced P&O Checking Algorithm MPPT for High Tracking Efficiency of Partially Shaded PV Module. Solar Energy 163, 570–580. doi:10.1016/j.solener.2017.12.050
Amir, A., Amir, A., Che, H. S., Elkhateb, A., and Rahim, N. A. (2019). Comparative Analysis of High Voltage Gain DC-DC Converter Topologies for Photovoltaic Systems. Renew. Energ. 136, 1147–1163. doi:10.1016/j.renene.2018.09.089
Bana, S., and Saini, R. P. (2017). Experimental Investigation on Power Output of Different Photovoltaic Array Configurations under Uniform and Partial Shading Scenarios. Energy 127, 438–453. doi:10.1016/j.energy.2017.03.139
Batzelis, E. I., Georgilakis, P. S., and Papathanassiou, S. A. (2014). Energy Models for Photovoltaic Systems under Partial Shading Conditions: A Comprehensive Review. IET Renew. Power Gener. 9 (4), 340–349. doi:10.1049/iet-rpg.2014.0207
Biswas, J., Kamath, A. M., Gopi, A. K., and Barai, M. (2017). Design, Architecture, and Real-Time Distributed Coordination DMPPT Algorithm for PV Systems. IEEE J. Emerg. Sel. Top. Power Electron. 6 (3), 1418–1433. doi:10.1109/jestpe.2017.2756698
Cao, D., Hu, W., Zhao, J., Huang, Q., Chen, Z., and Blaabjerg, F. (2020a). A Multi-Agent Deep Reinforcement Learning Based Voltage Regulation Using Coordinated PV Inverters. IEEE Trans. Power Syst. 35 (5), 4120–4123. doi:10.1109/tpwrs.2020.3000652
Cao, D., Hu, W., Zhao, J., Zhang, G., Zhang, B., Liu, Z., et al. (2020b). Reinforcement Learning and its Applications in Modern Power and Energy Systems: A Review. J. Mod. Power Syst. Clean. Energ. 8 (6), 1029–1042. doi:10.35833/mpce.2020.000552
Castro, L. M., Rodríguez-Rodríguez, J. R., and Martin-del-Campo, C. (2020). Modelling of PV Systems as Distributed Energy Resources for Steady-State Power Flow Studies. Int. J. Electr. Power Energ. Syst. 115, 105505. doi:10.1016/j.ijepes.2019.105505
Chandel, S. S., Nagaraju Naik, M., Sharma, V., and Chandel, R. (2015). Degradation Analysis of 28 Year Field Exposed Mono-C-Si Photovoltaic Modules of a Direct Coupled Solar Water Pumping System in Western Himalayan Region of India. Renew. Energ. 78, 193–202. doi:10.1016/j.renene.2015.01.015
Chen, H., Wang, Y., Ding, Y., Cai, B., and Yang, J. (2021). Numerical Analysis on the Performance of High Concentration Photovoltaic Systems under the Nonuniform Energy Flow Density. Front. Energ. Res. 9, 705801. doi:10.3389/fenrg.2021.705801
Cook, T., Shaver, L., and Arbaje, P. (2018). Modeling Constraints to Distributed Generation Solar Photovoltaic Capacity Installation in the US Midwest. Appl. Energ. 210, 1037–1050. doi:10.1016/j.apenergy.2017.08.108
De Prada-Gil, M., Domínguez-García, J. L., Trilla, L., and Gomis-Bellmunt, O. (2016). Technical and Economic Comparison of Various Electrical Collection Grid Configurations for Large Photovoltaic Power Plants. IET Renew. Power Gener. 11 (3), 226–236. doi:10.1049/iet-rpg.2016.0304
Hanson, A. J., Deline, C. A., MacAlpine, S. M., Stauth, J. T., and Sullivan, C. R. (2014). Partial-shading Assessment of Photovoltaic Installations via Module-Level Monitoring. IEEE J. Photovoltaics 4 (6), 1618–1624. doi:10.1109/jphotov.2014.2351623
Khan, O., and Xiao, W. (2017). Review and Qualitative Analysis of Submodule-Level Distributed Power Electronic Solutions in PV Power Systems. Renew. Sustain. Energ. Rev. 76, 516–528. doi:10.1016/j.rser.2017.03.073
Khan, O., Xiao, W., and Zeineldin, H. H. (2016). Gallium-Nitride-Based Submodule Integrated Converters for High-Efficiency Distributed Maximum Power Point Tracking PV Applications. IEEE Trans. Ind. Electron. 63 (2), 966–975. doi:10.1109/tie.2015.2491888
Le, L., Zhang, M., Ai, X., and Yang, X. (2018). “Evaluation of Energy Production for Large-Scale Photovoltaic Plant with Different Configurations,” in International Conference on Power System Technology (POWERCON), Guang Zhou, November 6–8, 2018, 1453–1458. doi:10.1109/powercon.2018.8602327
Li, H., Li, H., Lu, W., Wang, Z., and Bian, J. (2020). Optimal Power Flow Calculation Considering Large-Scale Photovoltaic Generation Correlation. Front. Energ. Res. 8, 590418. doi:10.3389/fenrg.2020.590418
López del Moral, D., Barrado, A., Sanz, M., Lázaro, A., and Zumel, P. (2018). Analysis and Implementation of the Buck-Boost Modified Series Forward Converter Applied to Photovoltaic Systems. Solar Energy 176, 771–787. doi:10.1016/j.solener.2018.10.053
Ma, T., Gu, W., Shen, L., and Li, M. (2019). An Improved and Comprehensive Mathematical Model for Solar Photovoltaic Modules under Real Operating Conditions. Solar Energy 184, 292–304. doi:10.1016/j.solener.2019.03.089
MacAlpine, S. M., Erickson, R. W., and Brandemuehl, M. J. (2012). Characterization of Power Optimizer Potential to Increase Energy Capture in Photovoltaic Systems Operating under Non-uniform Conditions. IEEE Trans. Power Electron. 28 (6), 2936–2945. doi:10.1109/tpel.2012.2226476
Mahdavyfakhr, M., Rashidirad, N., Hamzeh, M., Sheshyekani, K., and Afjei, E. (2017). Stability Improvement of DC Grids Involving a Large Number of Parallel Solar Power Optimizers: An Active Damping Approach. Appl. Energ. 203, 364–372. doi:10.1016/j.apenergy.2017.06.044
Olalla, C., Deline, C., and Maksimovic, D. (2013). Performance of Mismatched PV Systems with Submodule Integrated Converters. IEEE J. Photovolt. 4 (1), 396–404. doi:10.1109/jphotov.2013.2281878
Petrone, G., and Ramos-Paja, C. A. (2011). Modeling of Photovoltaic fields in Mismatched Conditions for Energy Yield Evaluations. Electric Power Syst. Res. 81, 1003–1013. doi:10.1016/j.epsr.2010.12.008
Project Science Office (2016). NASA’s Earth Observing System. Available at: https://eospso.nasa.gov/. (Accessed December 20, 2016).
Ram, J. P., Babu, T. S., and Rajasekar, N. (2017). A Comprehensive Review on Solar PV Maximum Power point Tracking Techniques. Renew. Sustain. Energ. Rev. 67, 826–847. doi:10.1016/j.rser.2016.09.076
Sánchez Reinoso, C. R., Milone, D. H., and Buitrago, R. H. (2013). Simulation of Photovoltaic Centrals with Dynamic Shading. Appl. Energ. 103, 278–289. doi:10.1016/j.apenergy.2012.09.040
Seme, S., Sredenšek, K., Štumberger, B., and Hadžiselimović, M. (2019). Analysis of the Performance of Photovoltaic Systems in Slovenia. Solar Energy 180, 550–558. doi:10.1016/j.solener.2019.01.062
Solaredge (2021). Relation Curve between Efficiency and Output of the DCOs of Different Electrical Topologies. Available at: https://www.solaredge.com/sites/default/files/application_note_solaredge_optimizers_efficiency.pdf. (November 5, 2021).
Sungrowpower (2021). Main Parameters and the Relation Curve between Efficiency and Output of String Inverter. Available at: http://www.sungrowpower.com/index.php?s=/Home/business/product_detail/id/136.html. (September 25, 2021).
Annual Energy Outlook (2019). Levelized Cost and Levelized Avoided Cost of New Generation Resources in the Annual Energy Outlook 2019. Washington, DC:Energy Information Administration. Tech. Rep.
Vavilapalli, S., Umashankar, S., Sanjeevikumar, P., Ramachandaramurthy, V. K., Mihet-Popa, L., and Fedák, V. (2018). Three-stage Control Architecture for Cascaded H-Bridge Inverters in Large-Scale PV Systems - Real Time Simulation Validation. Appl. Energ. 229, 1111–1127. doi:10.1016/j.apenergy.2018.08.059
Wang, F., Wu, X., Lee, F. C., Wang, Z., Kong, P., and Zhuo, F. (2013). Analysis of Unified Output MPPT Control in Subpanel PV Converter System. IEEE Trans. Power Electron. 29 (3), 1275–1284. doi:10.1109/epe.2013.6631752
Wang, Q., Yao, W., Fang, J., Ai, X., Wen, J., Yang, X., et al. (2020). Dynamic Modeling and Small Signal Stability Analysis of Distributed Photovoltaic Grid-Connected System with Large Scale of Panel Level DC Optimizers. Appl. Energ. 259, 114132. doi:10.1016/j.apenergy.2019.114132
Wijeratne, W. M. P. U., Yang, R. J., Too, E., and Wakefield, R. (2019). Design and Development of Distributed Solar PV Systems: Do the Current Tools Work? Sustain. Cities Soc. 45, 553–578. doi:10.1016/j.scs.2018.11.035
World Energy Outlook (2020). World Energy Outlook 2020. Paris, France: International Energy Agency, Tech. Rep.
Keywords: large-scale photovoltaic, DC optimizer, mismatch condition, modeling, generation characteristics, levelized cost of energy
Citation: Wang Q, Le L, Li D, Ai X, Fang J, Yao W and Wen J (2022) Modeling and Energy Generation Evaluations of Large-Scale Photovoltaic Plants Equipped With Panel-Level DC Optimizers. Front. Energy Res. 10:825994. doi: 10.3389/fenrg.2022.825994
Received: 30 November 2021; Accepted: 10 January 2022;
Published: 10 February 2022.
Edited by:
Weihao Hu, University of Electronic Science and Technology of China, ChinaReviewed by:
Di Cao, University of Electronic Science and Technology of China, ChinaBin Zhang, Aalborg University, Denmark
Copyright © 2022 Wang, Le, Li, Ai, Fang, Yao and Wen. This is an open-access article distributed under the terms of the Creative Commons Attribution License (CC BY). The use, distribution or reproduction in other forums is permitted, provided the original author(s) and the copyright owner(s) are credited and that the original publication in this journal is cited, in accordance with accepted academic practice. No use, distribution or reproduction is permitted which does not comply with these terms.
*Correspondence: Jiakun Fang, amZhQGh1c3QuZWR1LmNu
 Qin Wang
 Lingling Le1
 Xiaomeng Ai
 Wei Yao