 Mustafa Tahir
 Sideng Hu
 Zipeng Liang
- Department of Electrical Engineering, Zhejiang University, Hangzhou, China
In modular power converters, the dc-link capacitor has the highest failure rate due to thermal stress, reducing system performance and reliability. Current harmonics are one of the prominent causes of thermal stress on the dc-link capacitor that may get instigated by the resonance between the dc-link capacitor and stray inductance of the busbar. The dc-link capacitor current harmonics mitigation through busbar design optimization has not been reported. The challenge lies in analyzing the profound resonance characteristics of high order dc-link busbar impedance network as no insightful information can be obtained from impedance analyzers. This paper features a new strategy for high power modular converters that splits the high order dc-link busbar impedance network into corresponding lower-order sub-units. Then, the required relationship between resonating components and corresponding resonance frequencies is attained by exploiting the structural symmetry of the standard modular power unit as well as the inheritance relationship between sub-circuit units and the combined network. Finally, leveraging the derived resonant frequencies expressions, busbar structure is optimized, and up to 23% reduction in capacitor RMS current is achieved. Simulation and experimental results are provided to validate the efficacy of the proposed analysis method. The in-depth theoretical study featured in this paper can dictate not only the busbar design optimization but also a key to improve capacitor lifetime and reliability of the system.
Introduction
Modular design approach has been widely adopted in high capacity power converters as it streamlines the assembly, processing, replacement and capacity expansion. In modular converters, capacitors are used in dc-link and a busbar is an indispensable part of the system as it interfaces different power modules (Liang et al., 2021; Wang et al., 2021; Zhao et al., 2021). The performance and reliability of the converter is influenced by the failure rate of different system components, with the dc-link capacitor having the highest failure rate of 30% due to heating issues (Zhao et al., 2021). Among different stressors impacting the dc-link capacitor, current harmonics is a leading cause (Jedtberg et al., 2017). The stray inductance of the busbar may resonate with the dc-link capacitor, producing current harmonics and overheating issues in the capacitor (Zhang et al., 2015; Alizadeh et al., 2018; Callegaro et al., 2018; Wang et al., 2020; Niu et al., 2021; Tahir et al., 2021; Zhao et al., 2021). For dc-link of high power modular converters, non-laminated busbar is attractive owing to its large current capacity, ease of manufacturing and low cost (Liang et al., 2021); however, the adverse effects may get even worse due to its large stray inductance (Callegaro et al., 2018; Li et al., 2018; Alizadeh and Alan Mantooth, 2021). To achieve a reliable converter operation along with low cost busbar solution, it is crucial to analyze the relationship between the busbar stray inductance and the resonance that can dictate the busbar optimization (Meng et al., 2020).
Busbar optimization is an active research area and most of the researchers have investigated the busbar to reduce stray inductance and achieve symmetrical commutation loops (Caponet et al., 2002; Chen et al., 2014; Gui et al., 2019, 2021). The above studies have presented interesting results, concluding that special placement methods enable symmetrical commutation loops and multilayer busbar can minimize the stray inductance, albeit multilayers may increase the cost. Apart from stray inductance reduction, the ampacity of the busbar is explored in (Coneybeer et al., 1994), thermal analysis of busbar is undertaken in (Smirnova et al., 2016) and researchers in (Xu et al., 2019) have presented the insulation design and assessment. However, dc-link busbar optimization to mitigate the resonance is still obscure as it necessitates an explicit relationship between the busbar stray inductance and the resonance. For a high-order multi-port impedance network, as shown in Figure 1, it is challenging to analyze the resonance characteristics and underlying circuit parameters using impedance analyzers (Horibe, 2017) or numerical calculation methods (Hasan et al., 2014; Tan et al., 2018). In multi-port network systems such as back-to-back converters (Portillo et al., 2006), a more complex multi-port impedance network is formed due to the double number of power modules. Therefore, the capacitance of each power module and parasitic inductance of each segment of the busbar may resonate. The higher order of such busbar impedance network makes the harmonic distribution ambiguous, and the harmonic current transmission path gets more diverse. As a result, it becomes challenging to get the direct coupling relationship of parameters and no insightful information can be obtained to clearly locate the specific components that instigate resonance. Consequently, busbar structure optimization to suppress capacitor current harmonics and consequential thermal stress reduction is limited. Therefore, it is crucial to investigate an effective method to extract the resonant mode set for a high-order bus impedance network to improve the impedance characteristic analysis of multi-mode network system as well as to obtain a relationship between main resonant modes and corresponding resonant circuits. Resonance analysis of impedance networks has been discussed in the literature where stray inductance impact on resonance is investigated. For instance, resonance analysis for the impedance network of wind power plants has been discussed in (Hasan et al., 2014). Researchers in (Varricchio et al., 2004) proposed a modal analysis-based solution for the harmonic reduction in an industrial system. Similar studies have also been presented in (Badrzadeh et al., 2012; Kocewiak, 2012; Bollen and Yang, 2013). The above studies for system-level resonance analysis can be useful to guide the optimal filter location in wind power systems. However, for converter-level, the explicit and in-depth resonance analysis using the unit partition method to guide busbar optimization for modular wind power converter has not been reported to suppress capacitor current harmonics, which is the unique contribution of this study.
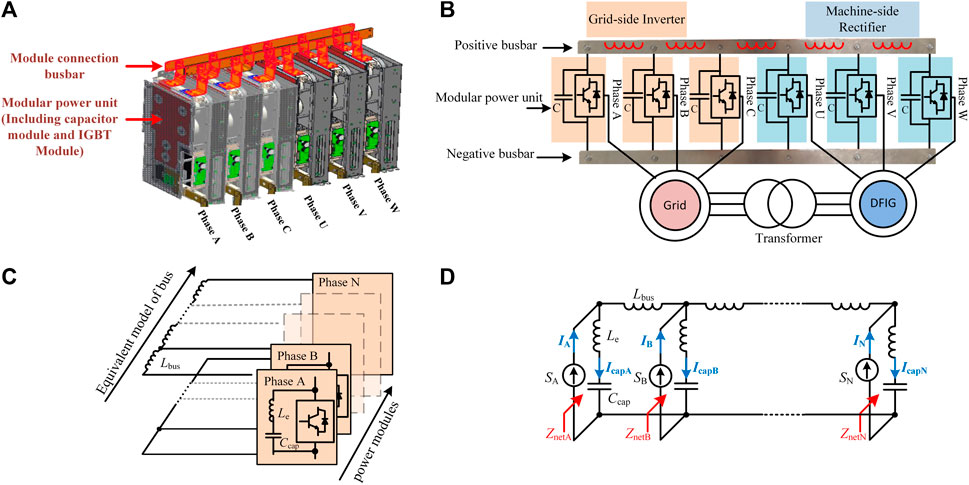
FIGURE 1. (A) Three-dimensional structure of the DC link of two-level back to back converter (B) Back to back converter topology (C) Combined impedance network of power module and busbar (D) Equivalent topology of busbar impedance network.
To investigate the resonance characteristics of the high-order impedance network, this paper proposes a new unit partition strategy for modular power converters that exploits the structural symmetry of the modular unit and leverages the inheritance relationship between the resonant characteristics of the low-order unit and the combined network. First, the correlation principle between the sub-unit and the combined network’s resonant mode is described, and a strategy for selecting a sub-unit is developed. Then, resonant mode of the network is decomposed into a unit resonant mode and a network resonant mode. Subsequently, a method of extraction, peak damping coefficient, and other parameters of resonant modes are deduced and analyzed exhaustively. Finally, exploiting the derived resonant frequencies expressions, the stray inductance is optimized to shift the peaks of resonance frequencies away from harmonic frequencies and current harmonic suppression is achieved.
Busbar Impedance Network and Unit Analysis Strategy
Modular Converter and Busbar Impedance Network
A back to back converter system with a standard power module structure is depicted in Figures 1A,B. Unlike capacitor modules with a centralized layout structure, capacitors are divided across each module and combined with power semiconductor devices to form a standardized modular power unit. The overall topology of the converter is then established by connecting the power modules using a dc-link busbar.
In a modular unit, capacitors and switching devices are connected using a laminated busbar, and different modular units are interfaced using a non-laminated dc-link busbar. The structure/volume of each standardized power module and the distance between the two connection ports is the same. Therefore, the busbar is divided into five segments and the stray inductance Lbus between adjacent segments is approximately the same as shown in Figure 1C. The equivalent multi-port network is illustrated in Figure 1D, where bus current and harmonics are regarded as current sources. For phase X (X is A, B,..., N), IcapX and IX represent capacitor current and bridge current, respectively. Besides, ZnetX is the equivalent input impedance of phase X and Zcap denotes the impedance of a capacitor module, including the capacitance Ccap and the total parasitic inductance of a modular unit Le, which is the sum of the stay inductance of capacitors in a modular unit and that of its laminated busbar.
As UX is the capacitor voltage of the X-phase module, accordingly, the proportional relationship (GX) between the capacitive current IcapX and the bridge arm current IX is shown in Eq. 2.
Eq. 2 depicts that resonance peaks in GX will occur at specific frequencies that stem from resonance between dc-link capacitors and stray inductance, leading the equivalent input impedance (ZnetX) to infinity (Xu et al., 2005; Hasan et al., 2014). As a result, the corresponding IcapX of resonance frequency gets amplified, causing insulation degradation and overheating problems in the capacitors.
There will be a multi-peak resonance mechanism owing to the multi-port and high-order characteristics of the network. Infinite port impedance can be utilized as a criterion for analyzing the network resonance characteristics, as port impedance is infinite and behaves as an open-source during the resonance event. Therefore, the unit partition strategy can be adopted by dividing the high-order network into lower-order ones.
Principle of Unit Analysis Method in Busbar Impedance Network
The impedance network clarified in Figure 1D can be regarded as a cascade combination of units with the same structure, as shown in Figure 2.
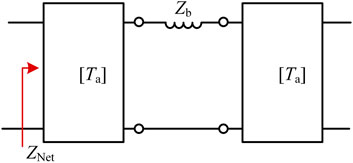
FIGURE 2. Network manifestation with cascaded units.
In Figure 2, the unit transmission parameter matrix is defined as Ta, and each element in the matrix is a two-port transmission parameter. From the two-port network characteristics, the port impedance ZTa can be obtained, as shown in Eq. 4 (Hayt et al., 2011; Sudhakar and Palli, 2015):
Note that the transmission parameter matrix of the connecting branch is TB and the branch impedance of the connecting unit is ZB. When two identical units are cascaded into a combined network, as shown in Figure 2, the transmission parameter matrix is regarded as Tnet, and the port impedance is recorded as Znet:
Eqs 4, 7 show that the resonance characteristics of high-order impedance networks have two features. First, the high-order impedance network Eq. 7 and the sub-unit impedance Eq. 4 contain the same denominator common factor term T21, indicating that the high-order network retains the sub-unit resonance mode. This type of resonant frequency transfers from the unit to the combined network called the self-resonance frequency of the unit. Secondly, the remaining term T11 + T22 + ZbT21 in Eq. 7 represents the newly added resonance mode after the sub-units are combined into a network, called the network-associated resonance frequency. By removing the self-resonance frequency of the unit in Eq. 4 and reducing the order of Eq. 7, the corresponding resonant frequency of this part can be obtained.
Eqs 4, 7 show that the reconstruction method of the network structure formed by the cascading of lower order units can associate the main resonant modes in the complex network. Capacitors count influences the resonance modes and order of the system (Cui and Xu, 2007). To ensure all lower order units are symmetrical, the approach n = km can be adopted while dividing a network. The number of capacitors m in the lower order unit should be a prime number (such as 2, 3 and 5), k is the number of cascaded lower order units and n indicate the total number of capacitors in the complete network. Taking a network of 6 capacitors as an example, select the lower order unit with 2 capacitors and 3 lower order units need to be cascaded to form a complete network of 6 capacitors (m = 2, k = 3, n = 2 × 3 = 6). Likewise, for a network of 9 capacitors, select the lower order unit with 3 capacitors and 3 units need to be cascaded (m = 3, k = 3, n = 3 × 3 = 9). Similarly, for a network of 10 capacitors, select the lower order unit with 5 capacitors and 2 units need to be cascaded (m = 5, k = 2, n = 5 × 2 = 10).
The step-by-step process of exploiting the unit partition strategy for analyzing a busbar impedance network is illustrated in Figure 3. Firstly, low-order units in a high-order impedance network are selected and resonance modes of low-order units are analyzed. Subsequently, the unit’s self-resonant mode of the high-order network, corresponding resonance circuit and frequency expressions are obtained. Afterwards, in the port impedance expression of the high-order network, the existing unit resonance mode is dissected, and the high-order impedance network is reduced to obtain the network-associated resonance mode. Once all the resonant frequencies expressions are attained, the overlap of resonant frequencies of impedance network with the harmonic frequencies of bridge current, which deteriorates the capacitor current harmonics, is inspected. Finally, busbar stray inductance is tuned to suppress the current harmonics by avoiding the overlap. Based on this process, a comprehensive characteristics analysis of the busbar impedance network for a back to back converter is presented below.
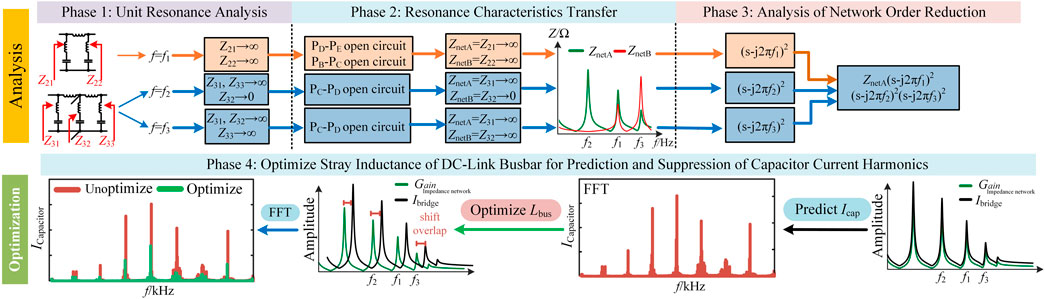
FIGURE 3. Analysis process for busbar impedance network resonance characteristics.
Application Example in 2-Level Converter
To analyze the network resonance characteristics, this section takes phase A and phase B ports of the busbar impedance network of a wind power back to back converter as an example to demonstrate the application process of the unit analysis method as shown in Figure 4A.
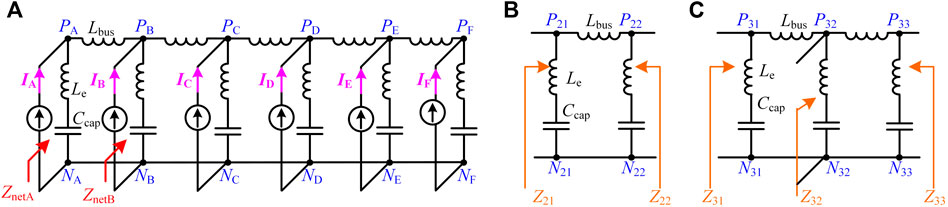
FIGURE 4. (A) Dc-link busbar impedance network of back to back converter (B) Lower order resonant type II unit (C) Lower order resonant type III unit.
Figure 4A is segmented into subunits through the unit selection strategy, i.e., a type II unit with 2 bus capacitor modules and a type III unit with 3 capacitor modules, as shown in Figures 4B,C, where the unit type number is expressed by the first digit in the subscript of the labels and the second digit represents the port number. For instance, 2 and 1 in the label N21 stand for type II unit and port 1, respectively.
The two ports P21N21 and P22N22 of type II unit are mirror-symmetrical; therefore, Z21 is equal to Z22. Expression for the resonant frequency of the type II unit is shown in Eq. 8. At this resonant frequency, the impedance of the cascade port as well as the input impedances Z21 and Z22, tend to infinity.
The type III unit is shown in Figure 4C. It encompasses 3 ports where port P31N31 is mirror-symmetrical to port P33N33 and Z31 is equal to Z33. Expressions for the resonant frequency for the type III units are obtained as:
If the resonance frequency is f2, i.e., branch P32N31 and branch P32N33 have series resonance, branch P32N32 is short-circuited. For Z31, the short circuit instigates a new parallel resonance between branch P31P32 and branch P31N31, Z31 tends to infinity, and the case of Z33 can be obtained by using symmetry. It can be seen that in the type III unit, the input impedance of left and right cascade ports is infinite at f2, and Z32 is equal to zero since the branch P32N32 is short-circuited at the middle port. After two type III units are cascaded, phase A at the left and right cascade ports has a resonant peak at f2, while phase B at the middle port has no corresponding resonant peak.
The type III unit also has another resonant mode and the corresponding resonant frequency is shown in Eq. 10. At this time, the parallel resonance formed by branch P31N31 and other element circuits on the right side of the unit causes Z31 to tend to infinity. Similar conditions also apply to Z33 and Z32. Thus, type III unit self-resonant modes and their corresponding resonant frequencies of the bus impedance network can be obtained.
The bus impedance network of a back to back converter is a 10th order system. In addition to the above three resonant modes, there are other associated resonant modes. After obtaining the self-resonance mode of the unit in the previous section, the input impedance expression of the overall network can be further reduced and simplified to obtain an expression of the remaining associated resonant modes:
In Eq. 11, Deno (ZnetA) represents the denominator term of the input impedance of the phase A port derived from Eq. 7. After extracting the common factor corresponding to the self-resonance mode of the unit, it is reduced from the 10th order to the 4th order, and analytical expressions of the network associated resonance frequencies are obtained as:
Application Example in 3-Level Converter
This section is dedicated to demonstrating the impedance network characteristic of a 3-level power converter, considering the wide range of applications of 3-level converters. A 3-D dc-link structure of a 3-level back to back converter is shown in Figure 5A, where a copper busbar interfaces the phase modules and connects four supporting capacitors in a phase module. Based on this structure, two approximations can be made; first, the mutual inductance among the positive, negative and middle busbar can be ignored compared with the self-inductance since the copper busbar no longer overlap. Second, the stray inductance of the middle busbar is half compared with that of the positive/negative busbar. Thus, the impedance network model is established, as shown in Figure 5B. In the figure, Lbus is the stray inductance of the busbar employed between capacitors, Lbus1 is the stray inductance of the busbar from the capacitor module to the phase module, and Lbus2 is the stray inductance of the busbar between the phase modules. The phase module circuit for the A/U phase, B/V phase and C/W phase is precisely the same, as shown in Figure 5B, and can be used as a low-order unit, as shown in Figure 5C. Based on the inheritance relationship between the resonance characteristics of low-order unit and cascade network as explained before for a 2-level converter, a simplified phase module unit and its resonance mode analysis is shown in Figure 6A. Since it is a 3-level converter, the unit has two current injection ports: PN and PL. With the help of star-delta transformation and port impedance equivalent, the port impedance between ports PN and PL can be solved step by step, as illustrated in Figures 6A–E.
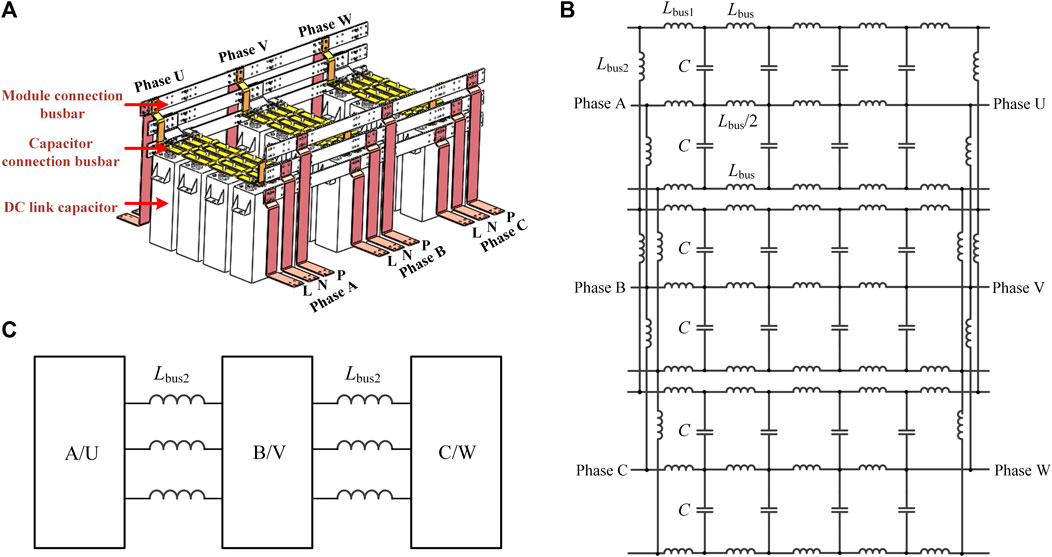
FIGURE 5. (A) DC-link structure of three-level back-to-back converter (B) DC-link impedance network of three-level converter (C) First unit partition.
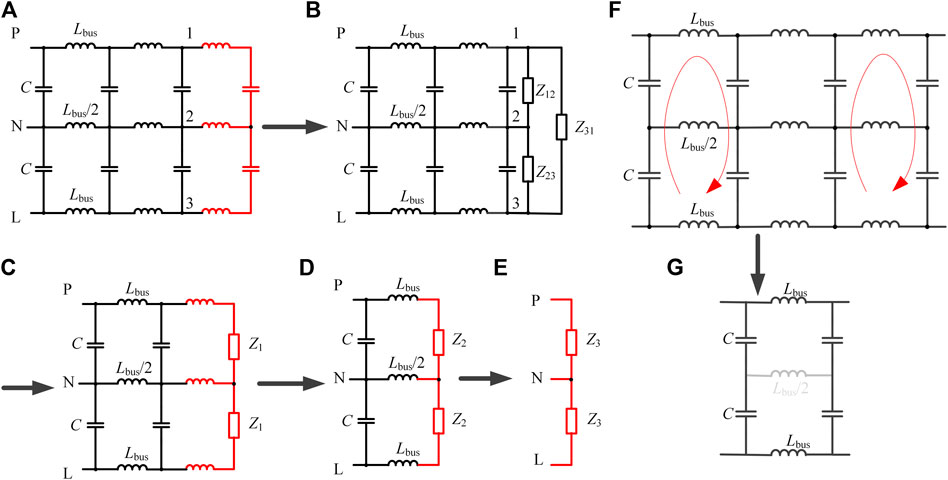
FIGURE 6. (A–E) The equivalent solution process of port impedance circuit (F,G) Partition unit of the capacitor module.
Using star-delta transformation, Figure 6A can be simplified to Figure 6B, where impedance Z12 = Z23. The ports 1-2-3 can be equivalent to the impedance Z1 using circuit symmetry, as shown in Figure 6B. The equivalent circuits Figures 6D,E are obtained by exploiting the circuit symmetry and repeating star transformation. It can be seen from the final equivalent circuit Figure 6E, the impedance ZPL between port PL is twice the impedance ZPN between the ports PN. Since the impedance expressions of the PN and PL ports only differ by constant coefficients; hence, there is no difference in electrical parameters. Therefore, two ports have the same parallel resonance characteristics, and the PL port is taken as an example to analyze the resonance characteristics of the port.
The unit partition of the capacitor module is also conducted for the single-phase modular unit, and the sub-units are selected, as shown in Figures 6F,G. Based on unit symmetry, the voltage at both ends of Lbus/2 is equal, and the branch current is zero; hence, it can be regarded as an open circuit. The resulting resonant unit is formed similar to the type II unit discussed above for a 2-level converter. Subsequently, considering equivalent series inductance Le of the capacitor, the self-resonant frequency expression can be obtained as shown in Eq. 14.
Using the unit partition method, the two network-associated resonance frequency expressions of the single-phase module unit in Figure 6A are further obtained, as shown in Eqs 15, 16.
Hence, the whole network in Figure 5B includes the above three resonant frequencies f6-f8 based on the unit partition resonant frequency inheritance concept. Therefore, the resonant mode of the dc-link impedance network of a 3-level back to back converter can be obtained by leveraging the proposed unit partition strategy.
Resonance Trend Prediction for Screening Out Severe Modes
For a busbar network with multiple resonant modes, obtaining the frequency of the resonant mode and further estimating the peak value relationship of each mode is the key to evaluate the dominant resonant mode for optimizing the design of busbar. This section presents a method that indirectly predicts the relative relationship between the corresponding peaks of each resonant mode through the damping coefficient. Since each resonant mode is orthogonal and independent, each resonant mode is the main mode in the frequency band near the resonant frequency. Its resonant peak Mr can be used as the damping coefficient ζ of the low-order system and expressed as:
According to Eq. 17, when the damping coefficient is less than
Substituting f1 to f5 into Eq. 18, and combining Eq. 11 to obtain the real part of each modal pole, the system damping coefficient can be attained as shown in Eqs 19–23, where Rbus and Re represent the stray resistance of the busbar and the equivalent series internal resistance of the capacitor, respectively. Afterward, the damping coefficient can estimate the relative relationship between the corresponding trend of each resonance mode using Eq. 17.
Where, a = LbusRbus+2LeRbus+2LbusRe + LeR and b = |LeRbus-LbusRe|
The multi-peak resonance set of each phase is different. For instant, phase A current transfer function contains five resonant frequencies, as expressed in Eqs 8–10, 12, 13. While for Phase B at f2, ZnetB = 0; thus, there are only four resonant frequency points of the current transfer function. Phase C and phase A are mirror-symmetrical; likewise, the phases D, E, F and A, B, C are mirror-symmetrical. Therefore, port resonance characteristics of the C, D, and F phases are similar to those of the A phase. Likewise, the port resonance characteristics of the E phase are similar to the B phase.
To conclude, the damping coefficient can be exploited to estimate the relative magnitude of the peaks of each resonance mode, as shown in Eqs 19–23, to screen out the severe resonance modes, eventually providing the critical insights for busbar design optimization.
Simulation and Experimental Validation of Proposed Analysis
Validation of Resonant Frequency Set Extraction Method
The 2 MW real power converter setup encompasses six modular units, as depicted in Figure 8B. The left three modular units serve as a machine-side rectifier, and the right three modular units function as a grid-side inverter. In the 2 MW converter, there are two types of bus bars that are separately illustrated in Figure 8A. Inside each modular unit, laminated busbar is used, which interfaces the power semiconductor devices and the capacitors, while a non-laminated DC-link busbar is employed at the top of modular units that interfaces modular units of different phases, as highlighted in the top section of Figure 8B. The switching frequency of the 2 MW converter is 2.5 kHz, while the bus voltage and grid side voltage are 1100 and 690 V, respectively. The prototype busbar impedance network platform used to analyze the actual dc-link busbar of a 2 MW converter is depicted in Figure 8C, where the stray inductance Lbus between each module port is 100 nH, and the stray resistance Rbus is 1 mΩ. The value of film capacitor Ccap is 15 uF, and the parasitic inductance is 15 nH. The value of parasitic resistance Re is 6 mΩ. These parameters are measured by ANSYS Q3D software and impedance analyzer (Keysight E4990A). Other practical and innovative solutions discussed in (Wang et al., 2020; Hu et al., 2021; Niu et al., 2021) can also be used for busbar and capacitor parameter extraction. By substituting parameters into Eqs 8–10, 12, 13, frequencies are calculated that are very close to measured values, as shown in Table 1.
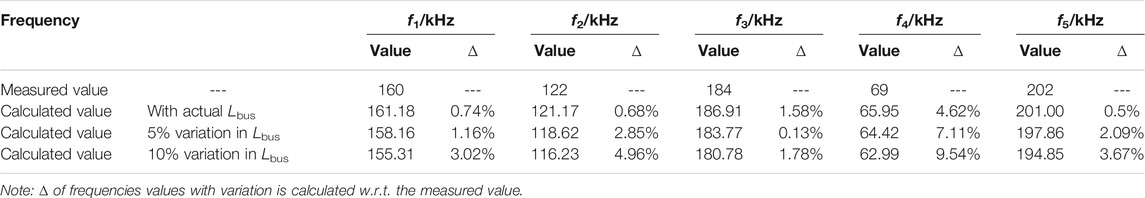
TABLE 1. Comparison between the theoretical and measured values of network resonance and impact of Lbus variation.
The model’s accuracy is also calculated considering some errors in the parameters obtained from simulation during the design stage. The impact of parameter variation on resonant frequencies is presented in Figure 7, showing a minor variation. Summary of analysis in Table 1 illustrates that the parameter variation affects the accuracy of different frequencies differently. The model ensures good accuracy for all the resonant frequencies with peak accuracy up to 99% for f3 when the parameter variation is limited to 5%. Even for higher variation, the model offers a reasonable level of accuracy, as shown in Table 1, endorsing that the proposed method can be applied with experimental and simulation results.
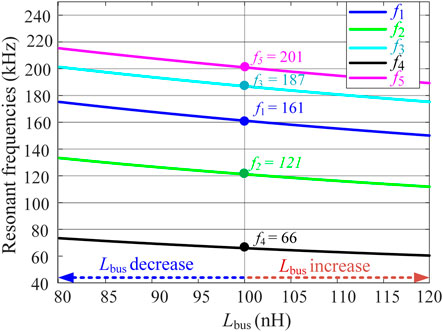
FIGURE 7. Impact of parameter variation on resonant frequencies.
Furthermore, using the impedance analyzer, frequency values are measured and the impedance spectrum of phase A and phase B ports is presented in Figure 8D, showing that there are three resonance peaks corresponding to the unit’s self-resonance frequency points f1, f2, and f3 at the A-phase port. Nonetheless, the phase B port has no prominent resonance peak at f2, which is consistent with the respective impedance characteristics of phase A and B ports in Resonance Trend Prediction for Screening Out Severe Modes Section. Meanwhile, at the A and B phase ports, there are two network-associated resonance frequencies f4 and f5. The resonant peak of the port impedance at frequency f5 is relatively weak owing to the large damping coefficient.
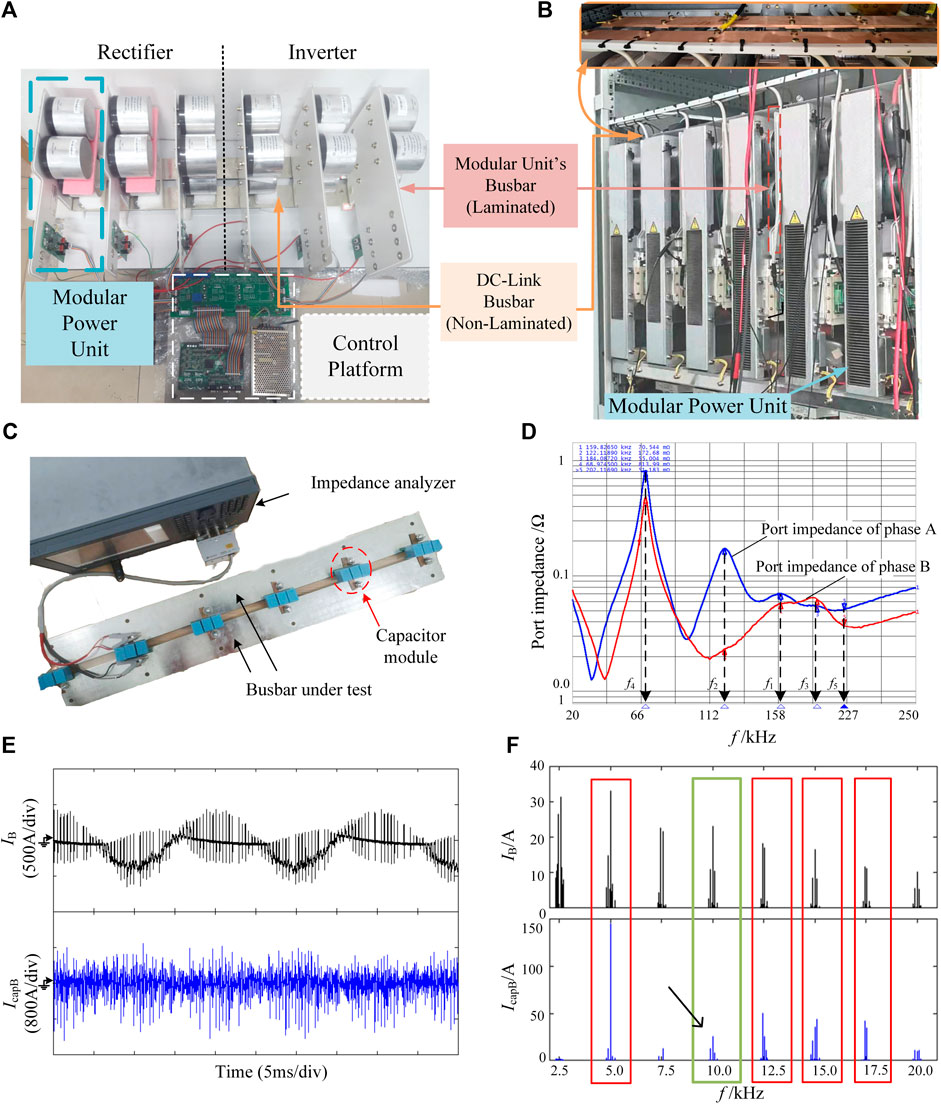
FIGURE 8. (A) Busbars of the 2 MW converter (B) Complete setup of 2 MW real power converter (C) Busbar impedance network platform under test (D) Experimental result of impedance network of prototype (E) Bridge and capacitor current experimental waveforms of the 2 MW converter in phase B (F) Corresponding FFT analysis.
To validate the analysis on a 2 MW real power converter, FFT analysis for the phase B current waveforms is carried out. The black waveform in Figure 8E represents the bridge current of phase B, where the IGBT’s peak current and RMS current values are 400 and 180A, respectively. Likewise, the blue waveform represents the capacitor current of phase B in Figure 8E, where the peak value and the RMS value of the capacitor current are 1200 and 228A, respectively. Overlapping of resonant and harmonic frequencies is one of the prominent causes of the high capacitor current value. To comprehend the overlap and validate the proposed analysis, FFT analysis of bridge and capacitor current of phase B is conducted, as shown in Figure 8F. Due to the difference in capacitor value of the 2 MW converter compared with the prototype busbar impedance platform in Figure 8C, the obtained frequencies are different compared with Table 1. The resonant frequencies f1-f5 are 12.1, 9.9, 14.5, 5.9 and 17 kHz, respectively, while the switching frequency fs is 2.5 kHz. It can be seen in Figure 8F that the capacitor current harmonics get increased around 2fs, 5fs, 6fs, and 7fs, as the corresponding frequencies are close to the resonant frequencies. Even though 4fs (10 kHz) is close to the resonant frequency f2 (9.9 kHz), no significant increase in the capacitor current harmonics is observed as there is no resonant peak at f2 in phase B, which matches the analysis in Application Example in 2-Level Converter Section and validates impedance network characteristics in Figure 8D.
Comparison of Multiple Resonance Peaks
In this section, the frequency resonance mode and peak value relationship investigated in this paper is verified by injecting harmonic current with frequencies f1 to f5 into the busbar impedance. Since the amplitude of injected current does not affect the resonant mode (Carlson et al., 1986), the amplitude is set to 2 A and injected through the port of phase A.
Figure 9 depicts the response of capacitor current Icap corresponding to the injected current IA of the same amplitude at different frequencies. Compared to injected current IA, capacitor current Icap shows a different amplification phenomenon, as shown in Figure 9. Figure 10 illustrates the variation trend of capacitor current gain and damping coefficient against frequency for phase A, determined by Eqs 19–23. The variation trend of the damping coefficient and current gain with increasing resonance frequency is consistent with the analysis in Resonance Trend Prediction for Screening Out Severe Modes Section, indicating that the damping coefficient can be leveraged to anticipate the relative relationship between the peak values of each resonant mode.
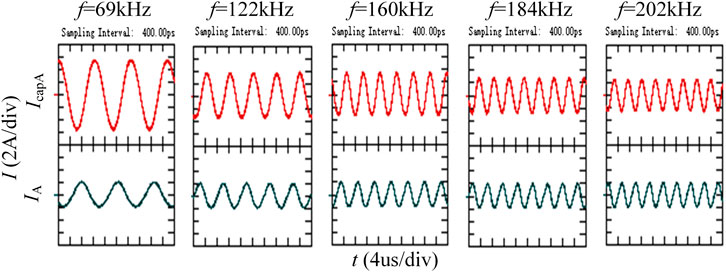
FIGURE 9. Capacitor current response to the injected bridge current at different frequencies.
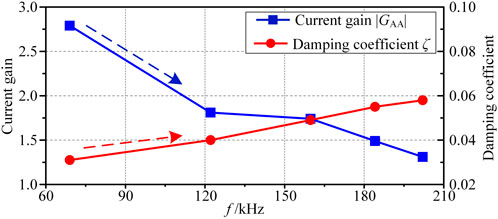
FIGURE 10. Variation trends of current gain |GAA| and damping coefficient ζ.
Figure 11 shows the experimental results of capacitor current Icap for phases A, B and C after injecting current IA with f2 (122 kHz) and f1 (160 kHz) from the phase A port. It can be seen in Figure 11A the capacitive current gain of phase B is substantially lower than that of other phases at frequency f2. In contrast, this phenomenon does not exist for frequency f1 in Figure 11B, which is in line with the conclusion in Resonance Trend Prediction for Screening Out Severe Modes Section that Phase B lacks resonant frequency f2.
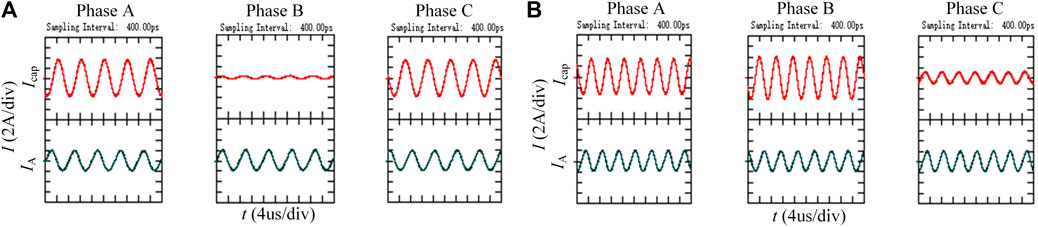
FIGURE 11. Capacitor current waveform in different phases (A) When harmonic source frequency is f2 (122 kHz) (B) When harmonic source frequency is f1 (160 kHz).
Validation of Current Harmonic Suppression Effect
This section presents the validation for current harmonic suppression. Capacitor current harmonics get deteriorated when harmonic frequencies of bridge current coincide with the peaks of resonant frequencies of busbar impedance network, which can be suppressed by changing the busbar stray inductance to avoid the overlap.
A simulation model of a 2-level back to back converter is built in the Simulink to illustrate the harmonics suppression and reduction of capacitor RMS current by leveraging the frequency expressions derived in this study. Simulation parameters are outlined in Table 2. The switching frequency fs is 2.5 KHz, while the busbar stray inductance Lbus before and after optimization are 94 and 123.6 nH, respectively. The network resonance frequencies before and after optimization are calculated from Eqs 8–10, 12, 13, and comparison is presented in Figure 12A, which depicts the network resonance frequency f4 is near 3fs, and f2 is close to 5fs before the optimization. There will be a large capacitor current gain around harmonic frequencies 3fs and 5fs due to their overlap with resonant frequencies f4 and f2. Exploiting the theoretical analysis of this study, optimal busbar stray inductance is selected based on the resonant frequencies peaks that do not overlap with harmonic frequencies. After optimization, the network resonant frequency f4 gets shifted from 3fs to 2.5 fs and f2 moved from 5fs to 4.5fs. Consequently, current harmonics near 3fs and 5fs get reduced significantly as these no longer coincide with the network resonant frequencies.
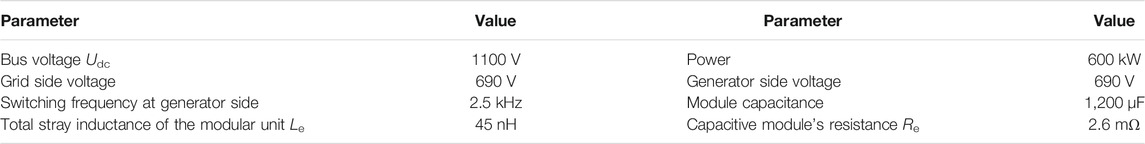
TABLE 2. Simulation circuit parameters.
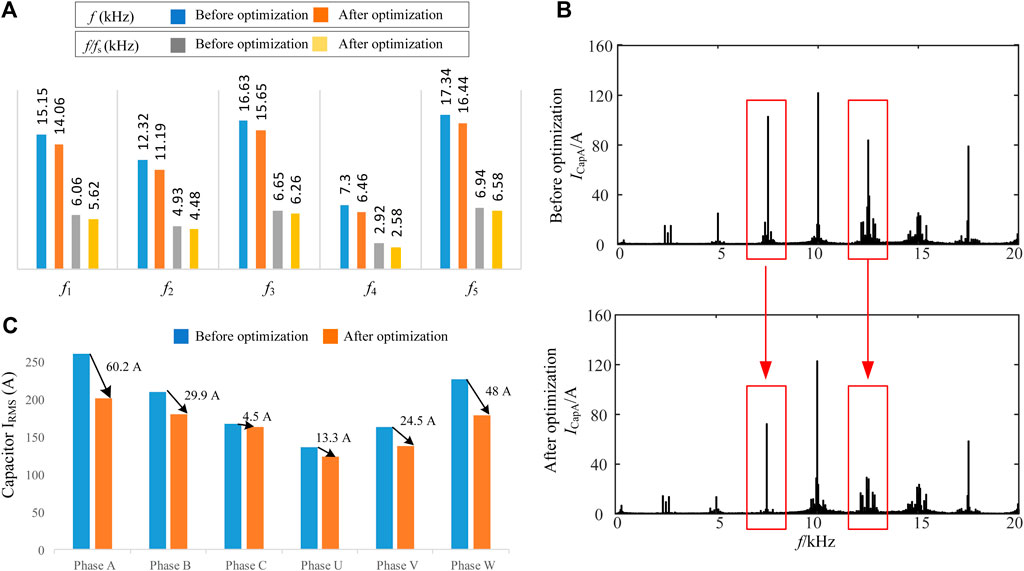
FIGURE 12. (A) Resonance frequencies of the impedance network before and after optimization (B) Comparison of phase A capacitor current spectrum of busbar (C) Comparison of capacitor current RMS value of each phase.
Figure 12B shows the capacitor current spectrum of phase A for optimized and unoptimized busbar structures. It can be noticed that around 3fs and 5fs, capacitor harmonic current amplitude reduced from 105 to 73.2 A and from 83.2 to 25.3 A, respectively. Comparison of capacitor RMS current is also presented in Figure 12C, illustrating that capacitor RMS current has decreased in all phases due to optimal busbar stray inductance selection and maximum reduction of almost 23% has been achieved in phase A.
Conclusion
Busbar plays a critical role in high-power modular converters and an optimized busbar design can suppress current harmonics, resulting in improved performance and reliability. However, it is challenging to analyze resonance characteristics of high order networks using existing solutions. To guide busbar design, this paper proposes a unit partition strategy that enables the extraction of multi-mode resonance characteristics of a high-order impedance network. Using the proposed method, the analysis process for 2-level and 3-level back to back converters is demonstrated and mathematical expressions of network resonance frequencies are derived. A busbar of a 2 MW back to back wind power converter is used to analyze and verify the proposed method. Through theoretical analysis and experimental verification, the conclusions of this paper are as follows:
1) By leveraging the inheritance relationship between the resonance characteristics of the low-order unit and the combined network, the self-resonance mode of a unit for the high-order impedance network and the network-associated resonance mode can be located. As a result, the resonance formation principle can be explained.
2) The damping coefficient can be exploited to estimate the relative peak magnitude of each resonance mode and severe resonance modes can be screened out. Then, corresponding parameters can be adjusted based on the screening to suppress current harmonics during busbar design optimization.
3) Exploiting the proposed analysis method, the optimized busbar achieved a significant reduction in capacitor RMS current of all phases, with a peak reduction of 23% in phase A.
The comprehensive theoretical study carried out in this paper can dictate not only the busbar design optimization but also a key to improve capacitor lifetime and reliability of the system. In addition, it can serve as a reference to analyze resonance characteristics of high order complex networks. Besides, the presented analysis for 2-level and 3-level wind power converters can be leveraged to guide the busbar design for other applications. Moreover, this study of non-laminated busbar can also be extended to laminated busbar to unleash its potential.
Data Availability Statement
The raw data supporting the conclusions of this article will be made available by the authors, without undue reservation.
Author Contributions
MT and SH conceptualized and performed the research process. MT contributed to the study methodology, designing, data curation, investigation, experiments and wrote the original draft. SH performed theoretical analysis, writing, review, editing and supervised. ZL participated in review, analysis and high power experiments. YM participated in analysis, visualization and designing. All authors contributed to the article and approved the submitted version.
Funding
This work was supported by the National Natural Science Foundation of China (under Grant 52177199) and the Zhejiang Provincial Natural Science Foundation of China (under Grant LGG22E070013).
Conflict of Interest
The authors declare that the research was conducted in the absence of any commercial or financial relationships that could be construed as a potential conflict of interest.
Publisher’s Note
All claims expressed in this article are solely those of the authors and do not necessarily represent those of their affiliated organizations, or those of the publisher, the editors and the reviewers. Any product that may be evaluated in this article, orclaim that may be made by its manufacturer, is not guaranteed or endorsed by the publisher.
References
Alizadeh, R., and Alan Mantooth, H. (2021). A Review of Architectural Design and System Compatibility of Power Modules and Their Impacts on Power Electronics Systems. IEEE Trans. Power Electron. 36, 11631–11646. doi:10.1109/TPEL.2021.3068760
Alizadeh, R., Schupbach, M., Adamson, T., Balda, J. C., Zhao, Y., Long, S., et al. (2018). “Busbar Design for Distributed DC-Link Capacitor Banks for Traction Applications,” in Proceeding of the 2018 IEEE Energy Conversion Congress and Exposition (ECCE), Portland, OR, USA, Sept. 2018 (IEEE), 4810–4815. doi:10.1109/ECCE.2018.8558380
Badrzadeh, B., Gupta, M., Singh, N., Petersson, A., Max, L., and Hogdahl, M. (2012). “Power System Harmonic Analysis in Wind Power Plants — Part I: Study Methodology and Techniques,” in Proceeding of the 2012 IEEE Industry Applications Society Annual Meeting, Las Vegas, NV, USA, Oct. 2012 (IEEE), 1–11. doi:10.1109/IAS.2012.6374102
Bollen, M. H. J., and Yang, K. (2013). Harmonic Aspects of Wind Power Integration. J. Mod. Power Syst. Clean. Energ. 1, 14–21. doi:10.1007/s40565-013-0001-7
Callegaro, A. D., Guo, J., Eull, M., Danen, B., Gibson, J., Preindl, M., et al. (2018). Bus Bar Design for High-Power Inverters. IEEE Trans. Power Electron. 33, 2354–2367. doi:10.1109/TPEL.2017.2691668
Caponet, M. C., Profumo, F., De Doncker, R. W., and Tenconi, A. (2002). Low Stray Inductance Bus Bar Design and Construction for Good EMC Performance in Power Electronic Circuits. IEEE Trans. Power Electron. 17, 225–231. doi:10.1109/63.988833
Carlson, D., Crane, L., Fedora, C., Lucero, A., Parenteau, R., Peterson, J., et al. (1986). The Analysis and Measurement of Harmonics in the Vicinity of an HVDC Inverter. Electric Machines Power Syst. 11, 499–510. doi:10.1080/07313568608909206
Chen, C., Pei, X., Chen, Y., and Kang, Y. (2014). Investigation, Evaluation, and Optimization of Stray Inductance in Laminated Busbar. IEEE Trans. Power Electron. 29, 3679–3693. doi:10.1109/TPEL.2013.2282621
Coneybeer, R. T., Black, W. Z., and Bush, R. A. (1994). Steady-state and Transient Ampacity of Bus Bar. IEEE Trans. Power Deliv. 9, 1822–1829. doi:10.1109/61.329515
Cui, Y., and Xu, W. (2007). Harmonic Resonance Mode Analysis Using Real Symmetrical Nodal Matrices. IEEE Trans. Power Deliv. 22, 1989–1990. doi:10.1109/TPWRD.2007.899481
Gui, H., Chen, R., Niu, J., Zhang, Z., Wang, F., Tolbert, L. M., et al. (2019). “Design of Low Inductance Busbar for 500 kVA Three-Level ANPC Converter,” in Proceeding of the 2019 IEEE Energy Conversion Congress and Exposition (ECCE), Baltimore, MD, USA, Oct. 2019 (IEEE), 7130–7137. doi:10.1109/ECCE.2019.8912605
Gui, H., Chen, R., Zhang, Z., Niu, J., Tolbert, L. M., Wang, F., et al. (2021). Methodology of Low Inductance Busbar Design for Three-Level Converters. IEEE J. Emerg. Sel. Top. Power Electron. 9, 3468–3478. doi:10.1109/JESTPE.2020.2999403
Hasan, K. N. B. M., Rauma, K., Luna, A., Candela, J. I., and Rodriguez, P. (2014). Harmonic Compensation Analysis in Offshore Wind Power Plants Using Hybrid Filters. IEEE Trans. Ind. Applicat. 50, 2050–2060. doi:10.1109/TIA.2013.2286216
Hayt, W., Kemmerly, J., and Durbin, S. (2011). Engineering Circuit Analysis. 8th ed. McGraw-Hill Education.
Horibe, M. (2017). “Performance Comparisons between Impedance Analyzers and Vector Network Analyzers for Impedance Measurement below 100 MHz Frequency,” in Proceeding of the 2017 89th ARFTG Microwave Measurement Conference (ARFTG), Honololu, HI, USA, June 2017 (IEEE), 1–4. doi:10.1109/ARFTG.2017.8000837
Hu, S., Wang, M., Liang, Z., and He, X. (2021). A Frequency-Based Stray Parameter Extraction Method Based on Oscillation in SiC MOSFET Dynamics. IEEE Trans. Power Electron. 36, 6153–6157. doi:10.1109/TPEL.2020.3033801
Jedtberg, H., Langwasser, M., Zhu, R., Buticchi, G., Ebel, T., and Liserre, M. (2017). “Impacts of Unbalanced Grid Voltages on Lifetime of DC-link Capacitors of Back-To-Back Converters in Wind Turbines with Doubly-Fed Induction Generators,” in Proceeding of the 2017 IEEE Applied Power Electronics Conference and Exposition (APEC), March 2017Tampa, FL, USA (IEEE), 816–823. doi:10.1109/APEC.2017.7930790
Kocewiak, L. H. (2012). Harmonics in Large Offshore Wind Farms. Aalborg, Denmark: Aalborg University.
Li, G., Ruan, J., Deng, Y., and He, X. (2018). “Advantages for Embedding DC-link Decoupling Capacitance in High Capacity Power Electronic Converters,” in Proceeding of the 2018 IEEE 19th Workshop on Control and Modeling for Power Electronics (COMPEL), Padua, Italy, June 2018 (IEEE), 1–6. doi:10.1109/COMPEL.2018.8459925
Liang, Z., Hu, S., Wang, M., and He, X. (2021). DC-link Busbar Network Design and Evaluation Method for the Large-Capacity Power Electronic Converter. IEEE J. Emerg. Sel. Top. Power Electron. 9, 4137–4145. doi:10.1109/JESTPE.2021.3073513
Meng, Y., Liang, Z., Hu, S., Ma, Z., and He, X. (2020). “Unit Partition Method for the Resonance Research in the Dc-Link Busbar of Back-To-Back Converter,” in Proceeding of the 2020, IEEE Energy Conversion Congress and Exposition (ECCE), Detroit, MI, USA, Oct. 2020 (IEEE), 4178–4181. doi:10.1109/ECCE44975.2020.9236238
Niu, J., He, Z., Lei, Y., Wang, M., Zhou, J., and Hu, S. (2021). “Film Capacitors ESL Extraction Based on SiC MOSFET Switching Transient Process,” in Proceeding of the 2021 IEEE Energy Conversion Congress and Exposition (ECCE), Vancouver, BC, Canada, Oct. 2021 (IEEE), 5889–5893. doi:10.1109/ECCE47101.2021.9595707
Portillo, R. C., Prats, M. M., Leon, J. I., Sanchez, J. A., Carrasco, J. M., Galvan, E., et al. (2006). Modeling Strategy for Back-To-Back Three-Level Converters Applied to High-Power Wind Turbines. IEEE Trans. Ind. Electron. 53, 1483–1491. doi:10.1109/TIE.2006.882025
Smirnova, L., Juntunen, R., Murashko, K., Musikka, T., and Pyrhonen, J. (2016). Thermal Analysis of the Laminated Busbar System of a Multilevel Converter. IEEE Trans. Power Electron. 31, 1479–1488. doi:10.1109/TPEL.2015.2420593
Sudhakar, A., and Palli, S. S. (2015). Circuits and Networks Analysis and Synthesis. 5th ed. Noida, India: McGraw Hill Education.
Tahir, M., Hu, S., and He, X. (2021). Performance Improvement Strategies for Discrete Wide Bandgap Devices: A Systematic Review. Front. Energ. Res. 9, 4691–4699. doi:10.3389/fenrg.2021.788689
Tan, M., Peng, X., and Wang, T. (2018). Study on the Harmonic Resonance of Grid-Connected of Wind Farms and Half-Wavelength AC Transmission System Based on Modal Analysis Method. High Volt. Eng. 44, 90–98. doi:10.13336/j.1003-6520.hve.20171227012
Varricchio, S. L., Gomes, S., and Martins, N. (2004). Modal Analysis of Industrial System Harmonics Using the S-Domain Approach. IEEE Trans. Power Deliv. 19, 1232–1237. doi:10.1109/TPWRD.2004.829943
Wang, M., Wu, G., Hu, S., and He, X. (2020). “A Frequency-Domain Method for Stray Parameters Extraction in Arbitrary Section of Laminated Busbars,” in Proceeding of the 2020 IEEE Energy Conversion Congress and Exposition (ECCE), Detroit, MI, USA, Oct. 2020 (IEEE), 5081–5084. doi:10.1109/ECCE44975.2020.9236175
Wang, Z., Wu, Y., Mahmud, M. H., Yuan, Z., Zhao, Y., and Mantooth, H. A. (2021). Busbar Design and Optimization for Voltage Overshoot Mitigation of a Silicon Carbide High-Power Three-phase T-type Inverter. IEEE Trans. Power Electron. 36, 204–214. doi:10.1109/TPEL.2020.2998465
Xu, W., Huang, Z., Cui, Y., and Wang, H. (20052005). Harmonic Resonance Mode Analysis. IEEE Power Eng. Soc. Gen. Meet. 2236, 3. doi:10.1109/PES.2005.1489238
Xu, Y., Feng, X., Wang, J., Gao, C., Burgos, R., Boroyevich, D., et al. (2019). Medium-Voltage SiC-Based Converter Laminated Bus Insulation Design and Assessment. IEEE J. Emerg. Sel. Top. Power Electron. 7, 1715–1726. doi:10.1109/JESTPE.2019.2922332
Zhang, N., Wang, S., and Zhao, H. (2015). Develop Parasitic Inductance Model for the Planar Busbar of an IGBT H Bridge in a Power Inverter. IEEE Trans. Power Electron. 30, 6924–6933. doi:10.1109/TPEL.2015.2396529
Keywords: resonance analysis, unit partition strategy, harmonics suppression, modular converters, back to back converter, wind power, busbar optimization
Citation: Tahir M, Hu S, Liang Z and Meng Y (2022) Unit Partition Resonance Analysis Strategy for Impedance Network in Modular Power Converters. Front. Energy Res. 10:823938. doi: 10.3389/fenrg.2022.823938
Received: 28 November 2021; Accepted: 12 January 2022;
Published: 15 February 2022.
Edited by:
Peng Li, Tianjin University, ChinaReviewed by:
Bochen Shi, Tsinghua University, ChinaRuirui Chen, The University of Tennessee, United States
Copyright © 2022 Tahir, Hu, Liang and Meng. This is an open-access article distributed under the terms of the Creative Commons Attribution License (CC BY). The use, distribution or reproduction in other forums is permitted, provided the original author(s) and the copyright owner(s) are credited and that the original publication in this journal is cited, in accordance with accepted academic practice. No use, distribution or reproduction is permitted which does not comply with these terms.
*Correspondence: Sideng Hu, aHVzaWRlbmdAemp1LmVkdS5jbg==