 Shuqi Meng
 Yalun Yan
- China Nuclear Power Technology Research Institute Co., Ltd., Shenzhen, China
In order to reveal the effect of thermal hydraulic conditions on the PWR CIPS risk, the evaluation of a PWR CIPS risk in the first cycle under different core flow rates, average primary temperatures, power levels, and primary pressures was conducted by combining thermal hydraulic codes LINDEN and CRUD (Chalk River unidentified deposit) analysis software CAMPSIS. The research result illustrating the essential effect of thermal hydraulic conditions on CIPS is changing the SNB (subcooled nucleate boiling) level of the fuel assembly’s surface; thus, boron precipitation and local power distribution will be affected. Theoretical evidence and statistical support of the effect of thermal hydraulic conditions on the PWR CIPS risk could be obtained via this research.
Introduction
During power operation, the corrosion products in the primary circuit of the PWR (pressurized water reactor) will deposit on the fuel surface and form a CRUD (Yoo et al., 2020) (Chalk River unidentified deposit). As an additive to control reactivity, the precipitation of boric acid inside the CRUD might induce local power abnormality, which will cause a CIPS (crud-induced power shift) risk in severe circumstances (Frattini et al., 2001; Yang and Tang, 2012; Yang et al., 2020). Jiao et al. (2021) developed a deposition model which could calculate the axial CRUD thickness and solid phase distribution of fuel; Li and Lyu developed an analysis code for calculating the CRUD deposition and radioactivity level in the PWR primary loop based on the concentration difference driving principle (Li, 2017; Li et al., 2018; Lyu et al., 2020); Zou et al. (2013) developed a thermal-physical-chemical coupling CIPS analysis model; Yang and other researchers used American commercial software to evaluate CIPS risks of AP1000 and CAP1400 units during power operation (Yang and Tang, 2012; Yang et al., 2020). Zhou and Jones (2002) developed a model to simulate boron precipitation inside the CRUD and verified the model based on Callaway plant measurement data. Doncel et al. (2007) carried out a series of experiments to simulate boron precipitation inside the CRUD and revealed the influence of the effect of thermal-hydraulic and hydrochemical conditions on boron precipitation. The Global PWR operation experience shows that SNB (subcooled nucleate boiling) on the fuel surface is an important factor affecting the CIPS (Sabol et al., 1997; Deshon, 2004; Lange, 2017). Differences in PWR design parameters and operating conditions will cause different thermal hydraulic conditions, changing the overall and local SNB level of fuel assemblies, and finally impact the risk of the CIPS. Using the thermal-hydraulic analysis program LINDEN (Bai et al., 2013) and CRUD analysis software CAMPSIS (China Nuclear Power Technology Research Institute Co. and Ltd., 2021), which have been validated based on 12 operating reactors’ measurement data, the first cycle’s CIPS risk of a PWR unit is analyzed under different core flow rates, average temperature of the primary loop, power levels, and primary loop pressure, which provides theoretical basis and data support for systematic evaluation of the influence of thermal hydraulic conditions on the CIPS risk of PWR units.
Chemical Kinetic Model
Deposition of Corrosion Products
PWR measurement data show that the main components of fuel CRUD are nickel (Ni), iron (Fe), and chromium (Cr) mixing spinel (Deshon, 2004; Riess, 2017). Along the axial direction of the fuel assembly, nickel oxide (NiO) usually precipitates in the SNB region, while nickel ferrite (NiFe2O4) and magnetite (Fe3O4) are more likely to deposit in the region where SNB does not occur (Deshon, 2005; Riess, 2017). In addition, 58Co, 60Co, 54Mn, and other radioisotopes can be detected in the primary coolant during PWR power operation, which indicates that Co and Mn also exist in the CRUD, but their contents are relatively small compared with Ni, Fe, and Cr, which can be ignored in CIPS analysis. For Ni, Fe, and Cr, combined with the corrosion potential–pH diagrams at high temperature-high pressure and the experimental results (Tremaine and Leblanc, 1980; Frattini and Fruzzetti, 2002; Liu et al., 2011; Riess, 2017), the following chemical reactions were established to simulate the CRUD formation process on the fuel surface:
Diffusion caused by turbulent mixing and intense precipitations caused by SNB are the main reasons for the formation of the CRUD (Kang and Sejvar, 1985). Assuming that there is a diffusion layer between the bulk coolant and fuel surface, the formation process of the CRUD could be divided into the mass transfer from the bulk coolant to diffusion layer and the diffusion layer to fuel surface (Kang and Sejvar, 1985; Lee, 1990). For fuel per unit area, assuming the mass transfer process reaches a steady state in the diffusion layer, based on the mass balance principle, following formulas could be derived:
where
Combining Eqs 16–19 and eliminating Cw,i, the deposition rate of corrosion products can be calculated by the following formula:
Boron Precipitation
A serious CIPS event occurred in the Callaway plant (Deshon, 2004), and the measurement data showed that boron precipitated in the SNB region in the form of bonaccordite (Ni2FeBO5) (Sawicki, 2007); Henshaw et al. (2008) developed a model for calculating the boron precipitation based on wick boiling, assuming that boron mainly precipitated in the form of lithium metaborate (LiBO2); in the boron precipitation model developed by Zhou and Jones (2002), it is assumed that all boron precipitates in the form of crystal boric acid (H3BO3) under the action of SNB; Doncel et al. (2007) not only detected LiBO2 and H3BO3 but also found lithium tetraborate (Li2B4O7) in artificial CRUD. Based on the aforementioned operation experience and experimental results, the boron precipitation model in this study has been hypothesized and simplified as follows:
1) At present, only the Callaway plant detected boron precipitation in the form of Ni2FeBO5, and the maximum thickness of the Callaway plant CRUD exceeds 100 microns, which belongs to the PWR with a very high scale level. In addition, Ni2FeBO5 has stable thermodynamic properties and can only be formed under extreme conditions, so the precipitation of boron in the form of Ni2FeBO5 is not considered;
2) Referring to the experiment on the influence of the artificial CRUD on boric acid adsorption behavior carried out by the Electric Power Research Institute (Deshon and Frattini, 2002), it is assumed that boron precipitated in the form of H3BO3 depends on the physical adsorption of boric acid by the CRUD, and SNB of the coolant will significantly accelerate the physical adsorption rate. Physical adsorption is mainly driven by the concentration difference and does not involve borate-related chemical reactions;
3) The bottom temperature of the CRUD increases due to wick boiling, while the solubility of LiBO2 decreases with the increase in temperature (Sabol et al., 1997) and precipitates after reaching the threshold. The precipitation process of Li2B4O7 is the same as that of LiBO2. According to the molar ratio of boron to lithium of these two borates, the amount of boron precipitated in LiBO2 is multiplied by two, which can be used as the estimated value of boron precipitated in Li2B4O7.
To sum up, the boron precipitation model involves two major effects: physical adsorption and borate precipitation. For the region where SNB occurs, physical adsorption always exists, while borate precipitation occurs only when the CRUD increases to a certain thickness. The calculation flow of boron precipitation is shown in Figure 1, and the formulas involved are as follows:

FIGURE 1. Calculation flow of the boron precipitation model.
where Cclad and Cbulk represent the boron concentration in the CRUD bottom and bulk coolant, respectively, in mol/kg;
Effect of Thermal Hydraulic Conditions on the CIPS
CIPS Risk Criteria
According to the PWR operation data of the CIPS and the software developed by American research institutions, the total amount of boron precipitation is selected as the CIPS risk judgment standard (Yang and Tang, 2012; Yang et al., 2020; Lange, 2017), as shown in Table 1. Some researchers believe that the CIPS is a phenomenon caused by the local increase of boron precipitation mass of fuel assemblies. It is necessary to simulate the local CRUD behavior of fuel assemblies in more detail (Haq et al., 2011; Hu et al., 2019) and calculate the power offset degree of fuel assemblies by coupling nuclear physics calculation codes to accurately predict the CIPS risk of the PWR. However, Table 1 is still the most widely accepted CIPS risk criteria.
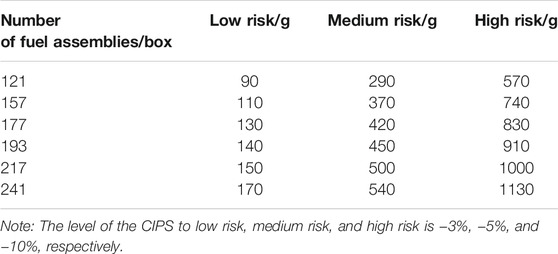
TABLE 1. Criteria for CIPS risk.
Thermal Hydraulic Sensitivity Analysis Results
The CRUD analysis software CAMPSIS realizes the function of the chemical kinetic model (China Nuclear Power Technology Research Institute Co. and Ltd., 2021). Based on the whole core flow field and temperature field distribution input by the thermal hydraulic analysis code LINDEN, the CIPS risk assessment is carried out for the first cycle of a PWR (the core assembly number is 157 boxes) under different core flow rates, average temperature of the primary circuit, power levels, and primary circuit pressure. The process is shown in Figure 2. The total amount of boron deposition in the first cycle of a PWR under different thermal and hydraulic conditions is obtained by reasonably disturbing the upper and lower intervals of the benchmark thermal hydraulic parameters, as shown in Figure 3. The variation trend of SNB corresponding to each condition is shown in Figures 4, 5, in which the maximum SNB rate indicates the SNB situation of the hottest fuel assembly, while the total mass evaporation rate reflects the intensity of SNB in the whole core. The analysis results show that
1) By reducing the reference core flow rate (Deshon, 2004) (82800 m3/h) by 5%, the maximum boron precipitation increases from 96 to 128 g, and the CIPS risk level elevates from a low risk to medium risk. Accordingly, the maximum SNB rate and total mass evaporation rate increase by 12.97 and 74.61%, respectively. On the contrary, with the increase of 5% reference core flow rate, the maximum boron precipitation decreases from 96 to 87 g, and the maximum SNB rate and total mass evaporation rate decrease by 3.32 and 43.79%, respectively;
2) By increasing the reference temperature (Deshon, 2004) (293.06°C) by 3°C, the maximum boron precipitation increases from 96 to 115 g, and the CIPS risk level elevates from a low risk to medium risk. Accordingly, the maximum SNB rate and total mass evaporation rate increase by 16.60 and 58.72%, respectively. On the contrary, with the decrease of 3°C reference temperature, the maximum boron precipitation decreases from 96 to 68 g, and the maximum SNB rate and total mass evaporation rate decrease by 9.27 and 23.24%, respectively;
3) By increasing the reference power (Deshon, 2004) (3411 MW) by 2%, the maximum boron precipitation increases from 96 to 145 g, and the CIPS risk level elevates from a low risk to medium risk. Accordingly, the maximum SNB rate and total mass evaporation rate increase by 12.97 and 33.39%, respectively. On the contrary, with the decrease of 2% reference power, the maximum boron precipitation decreases from 96 to 68 g, and the maximum SNB rate and total mass evaporation rate decrease by 3.32 and 33.39%, respectively;
4) By reducing the reference pressure (Deshon, 2004) (15.50 MPa) by 0.5 MPa, the maximum boron precipitation increases from 96 to 122 g, and the CIPS risk level elevates from a low risk to medium risk. Accordingly, the maximum SNB rate and total mass evaporation rate increase by 9.63 and 31.85%, respectively. On the contrary, with the increase of 0.5 MPa reference pressure, the maximum boron precipitation decreases from 96 to 80 g, and the maximum SNB rate and total mass evaporation rate decrease by 0.28 and 5.06%, respectively.
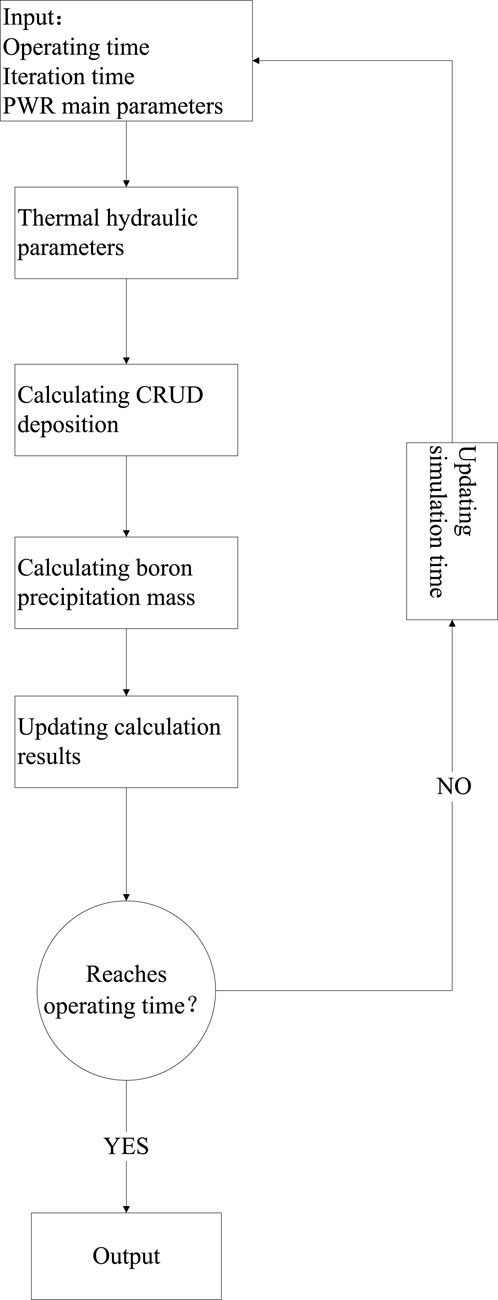
FIGURE 2. Analysis flow of the influence of thermal hydraulic conditions on the CIPS.
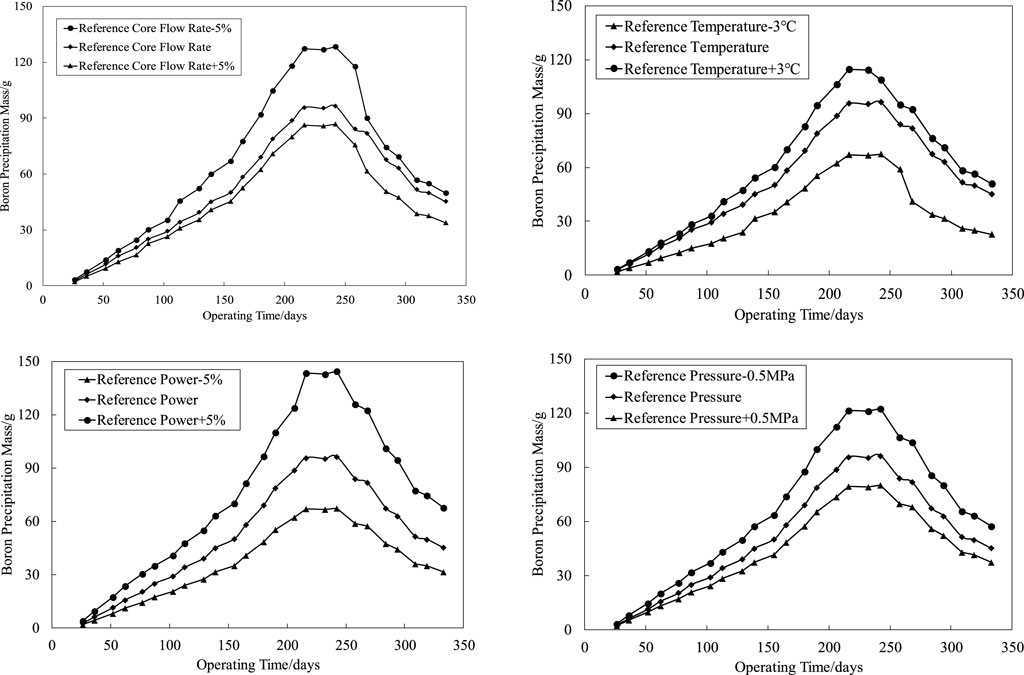
FIGURE 3. Boron precipitation under different thermal hydraulic conditions.
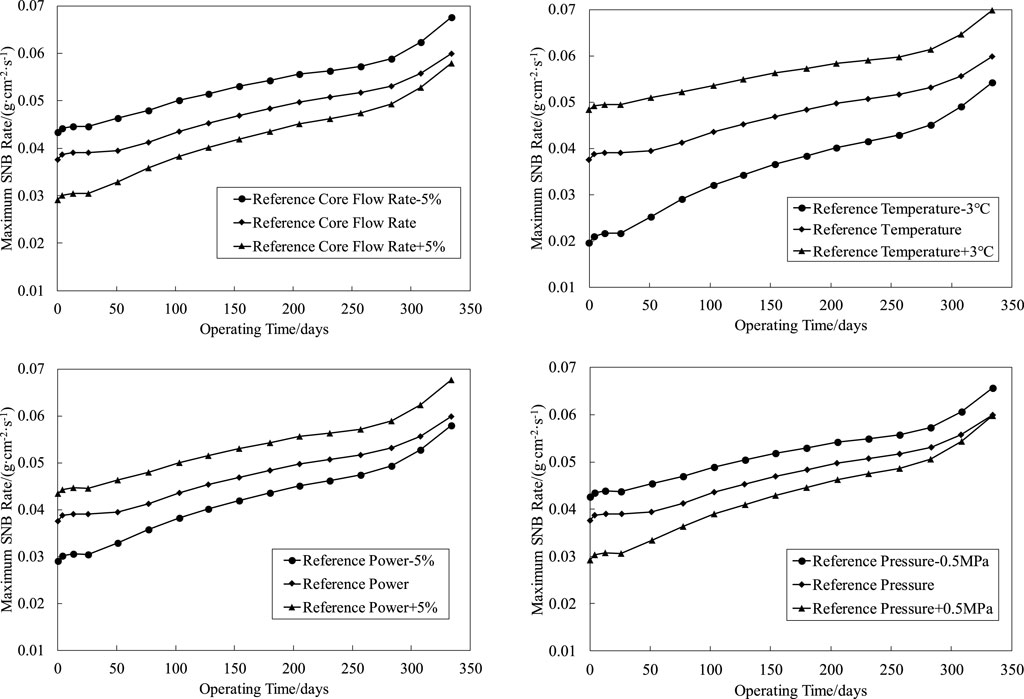
FIGURE 4. Maximum SNB rate under different thermal hydraulic conditions.
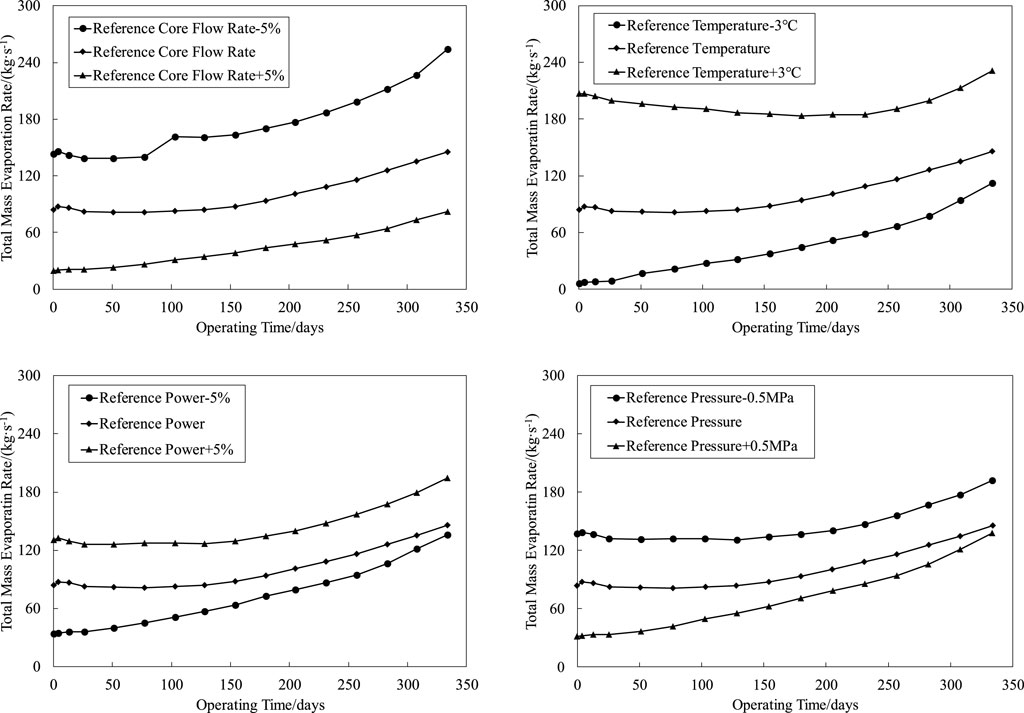
FIGURE 5. Total steam production rate of core under different thermal hydraulic conditions.
To sum up, the intensity of SNB changes with different thermal hydraulic conditions, which affects the axial CRUD distribution of fuel assemblies and finally leads to the difference of boron precipitation; thus, the risk of the CIPS changes accordingly. Thermal hydraulic conditions are developing in the direction of intensifying SNB, and the risk of the CIPS is increasing, which is consistent with the international PWR operation experience (Sabol et al., 1997; Deshon, 2004; Lange, 2017), further proving the importance of SNB’s influence on the CIPS.
Conclusion
The CIPS risk of a PWR first cycle under different thermal hydraulic conditions is analyzed by using LINDEN and CAMPSIS, based on the international common CIPS risk criteria. The conclusions are as follows:
1) CIPS is a special phenomenon which combines thermodynamic hydraulics and chemical kinetics;
2) The change in thermal hydraulic conditions finally reflects the influence on the intensity of SNB of fuel assemblies;
3) The degree of SNB is an important factor affecting the CIPS. The more severe SNB is, the more boron precipitates in the fuel assembly, and the risk of the CIPS increases accordingly.
4) The risk of the CIPS in the PWR can be reduced by controlling material corrosion (reducing the total amount of the CRUD), adjusting the chemical parameters of the primary circuit (changing the solubility of corrosion products), and updating fuel management strategies (inhibiting the severity of SNB).
The research methods and analysis results in this study can be used in many PWR reactor types, but the wider applicability, the difference between predicted values and actual PWR operating conditions, and how to accurately carry out the CIPS risk assessment of a continuous cycle still need further demonstration.
Data Availability Statement
The original contributions presented in the study are included in the article/Supplementary Material; further inquiries can be directed to the corresponding author.
Author Contributions
MS developed the thermal-hydraulic and chemistry model. YY developed the boron precipitation model. HYo tested the thermal-hydraulic model. HYi performed coding and testing models. RT performed coding and testing models.
Funding
The study was supported by National Natural Science Foundation of China(U20B2011). A part of this study was also supported by the China Nuclear Power Technology Research Institute Co.,Ltd.
Conflict of Interest
Authors MS, YY, HYo, HYi, and RT were employed by the company China Nuclear Power Technology Research Institute Co., Ltd.
Publisher’s Note
All claims expressed in this article are solely those of the authors and do not necessarily represent those of their affiliated organizations, or those of the publisher, the editors, and the reviewers. Any product that may be evaluated in this article, or claim that may be made by its manufacturer, is not guaranteed or endorsed by the publisher.
References
Bai, N., Zhu, Y., and Ren, Z. (2013). Development and Verification of Subchannel Analysis Code LINDEN[J]. At. Energ. Sci. Technology. 47 (ZL), 299–301. doi:10.7538/yzk.2013.47.S0.0299 (in Chinese).
Beverskog, B. (1997). Puigdomenech, Revised Pourbaix Diagrams for Iron at 25-300°C[J]. Corrosion Sci. 38 (12), 2121–2135. doi:10.1016/s0010-938x(9600067-4)
Beverskog, B., and Puigdomenech, I. (1997a). Revised Pourbaix Diagrams for Chromium at 25-300 °C. Corrosion Sci. 39 (1), 43–57. doi:10.1016/s0010-938x(97)89244-x
Beverskog, B., and Puigdomenech, I. (1997b). Revised Pourbaix Diagrams for Nickel at 25-300 °C. Corrosion Sci. 39 (5), 969–980. doi:10.1016/s0010-938x(97)00002-4
Chen, C. M., Aral, K., and Theus, G. J. (1983). Computer-calculated Potential pH Diagrams to 300°C[R]. EPRI Technical Report. California. EPRI-NP-3137-Vol.3.
China Nuclear Power Technology Research Institute Co., Ltd. (2021). China General Nuclear Power Group Co., Ltd., China General Nuclear Power Co. China: Ltd. CRUD behavior analysis software [CAMPSIS] V1.0 [CP]. 2021SR0623899(in Chinese).
Deshon, J., and Frattini, P. (2002). Adsorption of Boric Acid on Synthetic Fuel Crud oxides[R]. California: EPRI Technical Report. 1003384.
Deshon, J. (2004). PWR Axial Offset Anomaly (AOA) guidelines[R]. California: EPRI Technical Report. 1008102.
Deshon, J. (2005). Modeling PWR Fuel Corrosion Product Deposition and Growth process[R]. California: EPRI Technical Report. 1011743.
Doncel, N., Chen, J. X., and Deshon, J. (2007). Water Chemistry Influence on AOA, Phase 3 of the Spanish experiment at STUDSVIK[C]. in Proceedings of the 2007 International LWR Fuel Performance Meeting. San Francisco, USA
Frattini, P., and Fruzzetti, K. (2002). Impact of Nickel Oxide Solubility on Pressurized Water Reactor Fuel deposit chemistry[R]. California: EPRI Technical Report. 1003155.
Frattini, P. L., Blok, J., Chauffriat, S., Sawicki, J., and Riddle, J. (2001). Axial Offset Anomaly: Coupling PWR Primary Chemistry with Core Design. Nucl. Energ. 40 (2), 123–135. doi:10.1680/nuen.40.2.123.39952
Haq, I. u., Cinosi, N., Bluck, M., Hewitt, G., and Walker, S. (2011). Modelling Heat Transfer and Dissolved Species Concentrations within PWR Crud. Nucl. Eng. Des. 241, 155–162. doi:10.1016/j.nucengdes.2010.10.018
Henshaw, J., Gibson, C., and McGURK, J. C. (2016). Zinc Chemistry in PWR Fuel crud[C]. Brighton, United Kingdom: Nuclear Plant Chemistry Conference.
Henshaw, J., Mcgurk, J. C., and Sims, H. E. (2008). A Model of Chemistry and thermal Hydraulics in PWR Fuel Crud Deposits[J]. J. Nucl. Mater. 353 (1-2), 1–11. doi:10.1016/j.jnucmat.2005.01.028
Hu, H., Weibel, J. A., and Garimella, S. V. (2019). A Coupled Wicking and Evaporation Model for Prediction of Pool Boiling Critical Heat Flux on Structured Surfaces. Int. J. Heat Mass Transfer. 136, 373–382. doi:10.1016/j.ijheatmasstransfer.2019.03.005
Huang, J., Wu, X., and Han, E.-H. (2009). Influence of pH on Electrochemical Properties of Passive Films Formed on Alloy 690 in High Temperature Aqueous Environments. Corrosion Sci. 51 (12), 2976–2982. doi:10.1016/j.corsci.2009.08.002
Jiao, C., Han, X., and Hou, H. (2021). Model Development of the Deposition Process of Chalk Rivers Unidentified deposit on the Fuel Cladding Surface of PWR[J]. J. Harbin Eng. Univ. 42 (6), 915–920. doi:10.11990/jheu.202008053 (in Chinese).
Kang, S., and Sejvar, J. (1985). The CORA-II Model of PWR Corrosion-Product transport[R]. California: EPRI Technical Report. EPRI-NP-4246.
Lange, T. L. (2017). Methodology for an Advanced Risk Assessment of Crud Induced Power Shift Using Coupled Multi-Physics Simulations and a Monte Carlo Scenario Analysis of the Potential Financial benefits[D]. USA: The University of Tennessee.
Lee, C. B. (1990). Modeling of Corrosion Product Transport in PWR Primary coolant[D]. USA: Massachusetts Institute of Technology.
Liu, X., Wu, X., and Han, E.-H. (2011). Influence of Zn Injection on Characteristics of Oxide Film on 304 Stainless Steel in Borated and Lithiated High Temperature Water. Corrosion Sci. 53 (10), 3337–3345. doi:10.1016/j.corsci.2011.06.011
Li, L. (2017). Study on Activation and Migration Model of Corrosion Products in the Main Loop of Water-Cooled Reactor [D]. Beijing: North China Electric Power University. (in Chinese).
Li, L., Zhang, J., and Zhang, J. (2018). Analysis of the Activated Corrosion Products and Dose Rate in a Typical PWR under Operation Condition[J]. Nucl. Sci. Eng. 38 (4), 540–545. (in Chinese).
Lyu, W., Chen, M., and Huang, Q. (2020). Development of Calculation Code CPAP for Radioactive Activation Product of Pressurized Water Reactor Nuclear Power Plant[J]. Nucl. Tech. 43 (4), 25–32. doi:10.11889/j.0253-3219.2020.hjs.43.040005 (in Chinese).
Meng, S., Hu, Y., and Li, C. (2021). A CIPS Risk Evaluation Methodology Applicable for PWR[J]. Nucl. Tech. 44 (09), 86–91. doi:10.11889/j.0253-3219.2021.hjs.44.090601 (in Chinese).
Riess, R. (2017). Chemistry Experience in the Primary Heat Transport Circuits of Kraftwerk Union Pressurized Water Reactors. Nucl. Technology. 29 (2), 153–159. doi:10.13182/nt76-a31574
Rummery, T. E., and Macdonald, D. D. (1975). Prediction of Corrosion Product Stability in High-Temperature Aqueous Systems. J. Nucl. Mater. 55 (1), 23–32. doi:10.1016/0022-3115(75)90134-8
Sabol, G. P., Secker, J. R., and Kormuth, J. (1997). Root Cause Investigation of Axial Power Offset anomaly[R]. California: EPRI Technical Report. TR-108320.
Sawicki, J. A. (2007). Evidence of Ni2FeBO5 and M-ZrO2 Precipitation in Fuel Rod Deposits in AOA-Affected High Boiling Duty PWR Core[J]. J. Nucl. Mater. 374, 248–269. doi:10.1016/j.jnucmat.2007.08.04
Tremaine, P. R., and Leblanc, J. C. (1980). The Solubility of Magnetite and the Hydrolysis and Oxidation of Fe2+ in Water to 300°C. J. Solution Chem. 9 (6), 415–442. doi:10.1007/bf00645517
Yang, J., Qin, H., and Liu, C. (2020). Research on the CIPS Effection of Using Enriched 10 B boron Acid in PWR Primary Coolant System[J]. Nucl. Sci. Eng. 40 (6), 932–936. (in Chinese).
Yang, P., and Tang, C. (2012). CIPS Risk Analysis for AP1000 PWR First Cycle. Nucl. Sci. Eng. 32 (3), 284–288. doi:10.3969/j.issn.0258-0918.2012.03.017 (in Chinese).
Yoo, J., Lee, S. W., and Park, Y. J. (2020). Implementation of the Crud Layer Model into the Space code[C]. South Korea: Transactions of the Korean Nuclear Society Virtual Spring Meeting.
Zhou, D., and Jones, B. G. J. (2002). Boron Concentration Model and Effects of boron Holdup on Axial Offset Anomaly (AOA) in PWRs[C]. in Proceedings of ICONE10 10th International Conference on Nuclear Engineering. Arlington, USA
Keywords: PWR (pressurized water reactor), thermal hydraulic, CIPS (crud-induced power shift), boron precipitation, SNB (subcooled nucleate boiling)
Citation: Meng S, Yan Y, Hu Y, Hu Y and Ruan T (2022) Research of Thermal Hydraulic Conditions Effect on PWR CIPS Risk. Front. Energy Res. 10:823872. doi: 10.3389/fenrg.2022.823872
Received: 28 November 2021; Accepted: 17 January 2022;
Published: 02 March 2022.
Edited by:
Luteng Zhang, Chongqing University, ChinaReviewed by:
Shanshan Bu, Chongqing University of Technology, ChinaYan Xiang, Royal Institute of Technology, Sweden
Copyright © 2022 Meng, Yan, Hu, Hu and Ruan. This is an open-access article distributed under the terms of the Creative Commons Attribution License (CC BY). The use, distribution or reproduction in other forums is permitted, provided the original author(s) and the copyright owner(s) are credited and that the original publication in this journal is cited, in accordance with accepted academic practice. No use, distribution or reproduction is permitted which does not comply with these terms.
*Correspondence: Yousen Hu, aHV5b3VzZW5AY2ducGMuY29tLmNu