- 1School of Mechanical Engineering, Xijing University, Xi’an, China
- 2Innovation Institute of Shaanxi Aerospace Power High Tech Co., Ltd., Xi’an, China
- 3Department of Power and Electrical Engineering, Northwest A&F University, Shaanxi, China
As an important machine for energy conversion and fluid transmission, centrifugal pump has the advantages of high efficiency, reliable performance, and easy adjustment. In order to improve the stability of the pump, this article adopts the method of experimental and numerical simulation in the pump and studies the variation of the vibration characteristics in the operation process. Based on the numerical simulation results, the intake condition and the cavitation inside the centrifugal pump are analyzed and summarized, which reveals the flow attenuation mechanism of a pumping station. The main results of the work reported in this article are as follows: 1) Various experimental schemes to monitor the vibration of centrifugal pumps in real time have been designed. The vibration characteristics of the pumps have been significantly improved by adding special trash barriers. 2) The gas entering the pump was not enough to affect the normal operation of the pump, but cavitation did occur in the actual operation process. 3) The critical net positive suction head under the three conditions is calculated to be 8.9, 10.9, and 12.9 m, respectively.
Introduction
Centrifugal pumps are widely used in chemical, petroleum, aerospace, and other fields (Zhou et al., 2013) (Botros et al., 2016), and the requirements of its hydraulic performance and operational stability are becoming higher (Dong and Chu, 2018). With high efficiency, reliable performance, easy adjustment, and other advantages (Guo et al., 2018), centrifugal pump has become an indispensable part of the economic development (Nishida et al., 2016) (Adamkowski et al., 2016). Therefore, it is important to research the internal situation of centrifugal pumps for technological development.
Kreuz-Ihli et al. (1999) demonstrated the excitation effect of the tongue region in a vaneless radial inflow turbine, and their results showed that the phenomenon of partial load cyclone has a great influence on the generation of cavitation (Muggli et al., 1997), but no analysis has been made on the net positive suction head (NPSH). Kaupert and Staubli (1999) studied the full-load disturbance phenomenon in centrifugal pumps with guide vanes at different specific speeds, and the results showed that the frequency of full-load disturbance phenomenon increases with the increase in specific speed (Yang et al., 2015) (Zhang et al., 2019). However, no detailed analysis of the operating conditions in sandy rivers has been made. Guelich and Egger (1992) used experimental and numerical simulation methods to study the unstable flow field inside the centrifugal pump with a guide vane, and the results showed that the frequency gradually increased to the level of full-load disturbance in the impeller (Posa and Lippolis, 2019) (Yousefi et al., 2019). The main cause of this phenomenon is a rotational stall (de O. Turci et al., 2020). Centrifugal pump optimization methods based on computational fluid dynamics (ELM/CFD) and actual experiments have been widely applied (Wang et al., 2017) (Li et al., 2018), but there is insufficient research on pump cavitation (Schäfer et al., 2017). The combination of experimental and numerical simulation methods can effectively predict the centrifugal pump axial force (Mortazavi et al., 2017) (Liu et al., 2014), so this combined method has been used in this research.
This research took the selected pumping station with double-suction pumps and four water pumps as the experimental object. The drainage area of this station is the Yellow River, with a maximum sand content of 69 kg/m3 (Wang et al., 2016). The sand in the water flow caused serious abrasion to the pump and restricted the effective use. At present, the pumping station has experienced a significant flow decline from 5.1 m3/s to 3.7 m3/s. This research adopted numerical simulation (Lomakin et al., 2016) and experimental methods (Fu et al., 2020) to study the internal flow performance of the pumping channels and analyzed the reason of flow decay in the pumping station. This further revealed the mechanism of flow decay in the pump station and provided the theoretical basis for the stable operation of the pump station.
Methods and Experiments
Numerical Simulation Settings
The proper setting of the boundary conditions greatly affects the accuracy of the numerical simulation. In thisarticle, the specific boundary conditions are set as follows: the fluid is incompressible, and the turbulent flow model uses the SST k-ω model. The inlet boundary in the stationary, under non-cavitation, conditions uses the inlet pressure of 101325Pa. With a constant discharge (or head), the inlet pressure has to be decreased to allow the static pressure at some areas inside the pump (at the impeller blade inlet edge or suction side) to fall sufficiently below that of the saturated liquid vapor. According to the actual conditions, the boundary condition of the outlet is mass flow. The solid-wall surface uses the no-slip boundary condition, which means that the wall surface velocity is the same as the fluid velocity. The standard wall is applied to the surface near the wall. The saturation pressure is 3169Pa, and the default value of 2 × 10⁻⁶ m is selected for the mean diameter. The frozen rotor is used for steady-state simulations, and the stator–rotor interface is used for unsteady simulations. The convergence accuracy (RMS) is set to 10–5.
Computational Area and Grid
Calculation Area
According to the actual situation of the pumping units in the double-suction pumping station, Pro/E 2018 software is used to establish the 3D model of the full flow path of the centrifugal pump. The cross-sectional length of the inlet and the outlet of the centrifugal pump will reduce the influence of boundary conditions on the internal flow field during the modeling process.
Grid
Grid is the calculation carrier of numerical simulation, which imposes strict requirements on the resolution of the grid. The inlet flow channel is divided into three parts: inlet section, channel, and outlet section. The 3D model of the centrifugal pump is divided into five parts: inlet section, suction chamber, impeller, spiral casing, and outlet section, which are further divided into different numbers of grids. In this article, we choose the unstructured tetrahedral mesh. The grid of some parts is shown in Figure 1.
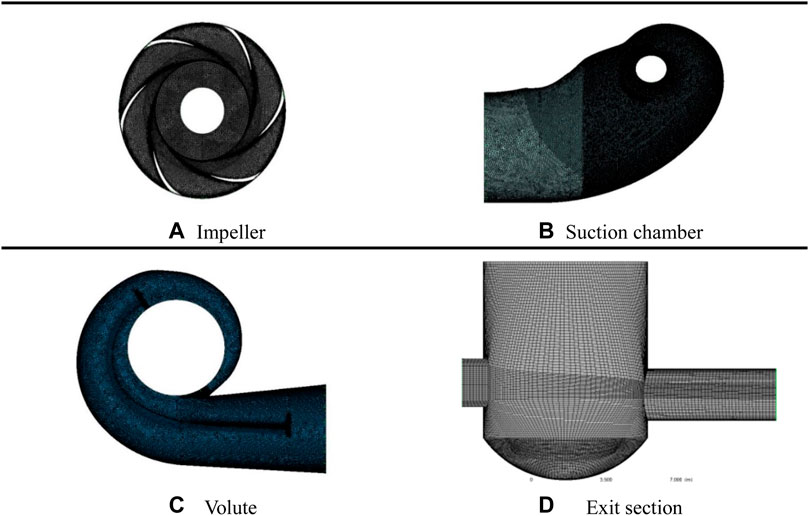
FIGURE 1. The grid of flow system components. (A) Impeller; (B) Suction chamber; (C) Volute; (D) Exit section.
Grid Independence Study
Table1 Grid recorded the results with different node numbers used in the simulation. It can be seen from the table that when the number of grids reaches 14 million, the efficiency and head remain unchanged with an increased number of grids. Considering the time and computer performance, the final number of cells is 14 million. There are 1.4 million grid cells in the inlet section, 5.9 million grid cells in the suction chamber, 2.6 million grid cells in the impeller, 3.14 million grid cells in the volute, and 0.9 million grid cells in the outlet section.
Centrifugal Pump Experiment
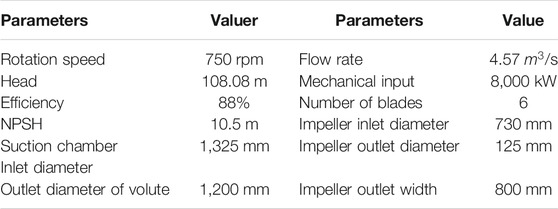
In thisarticle, the centrifugal pump experimental system includes double-suction centrifugal pumps, accelerometers, a wireless gateway data acquisition system, and a software data analysis system. The acceleration sensor (frequency range 2–10 KHz; noise <20 mV) can measure the velocity and acceleration in all directions at the same time. In this experiment, the main collection is the vibration velocity of the pump casing under each monitoring point. The acceleration sensor specification model is GY7600WS, which is produced by Zhongke Genyun in China. The data acquisition system is mainly a wireless gateway by ZigBee whose specification model is GY7800WS. The design flow rate QD of the double-suction centrifugal pump is 4.57 m3/s, the design head is 108.08 m, and the design speed is 750 r/min. Specific parameters are shown in Table 2.
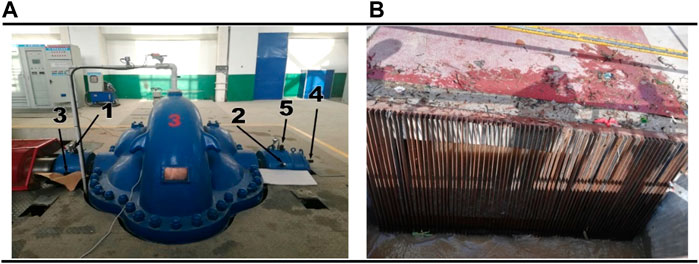
The real-time monitoring system used the velocity sensor, acceleration sensor, and temperature sensor to monitor the state of the pump at five different locations and the data is recorded during 72 h without drastic changes in the flow. The monitoring points are shown in Figure 2. Choose the flow channel after the front pond to put the trash rack and monitor the data after 4–5 h. Close the valve of the pump and remove the gas in the pump. After reaching the maximum flow, record the inlet and outlet pressure and flow data until the flow becomes stable again.
Verification of Numerical Simulation Results and Experimental Results
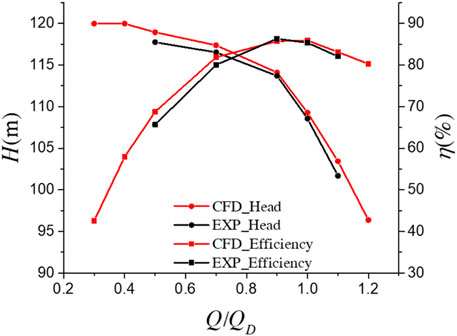
Figure 3 shows the comparison between the simulation results and the experimental results in the clear water state to verify the accuracy of the numerical simulation. The numerical simulation results are in good agreement with the experimental results. Some load and overload conditions show large errors, which may have come from unstable factors such as reflux and flow separation. However, the error is still within the acceptable range, and the efficiency error and head error are less than 5.0%. Near the effective area (0.7–1.1QD), the errors of head and efficiency are less than 3.0 and 3.5%, respectively. Therefore, the numerical model in this article can meet the requirements of the calculation accuracy.
Numerical Simulation Results and Discussion
Gas–Liquid Flow Characteristics of the Inlet
The gas (air)–liquid (water) distribution diagram of each part of the inlet flow channel of the pump under different flow conditions is shown in Figure 4. The volume of the gas increases with the increasing flow rate, but it can be found that the volume of the gas entering the pump from the outlet section is very small. Therefore, it can be considered that the gas entering the pump is not enough to affect the normal operation of the pump.
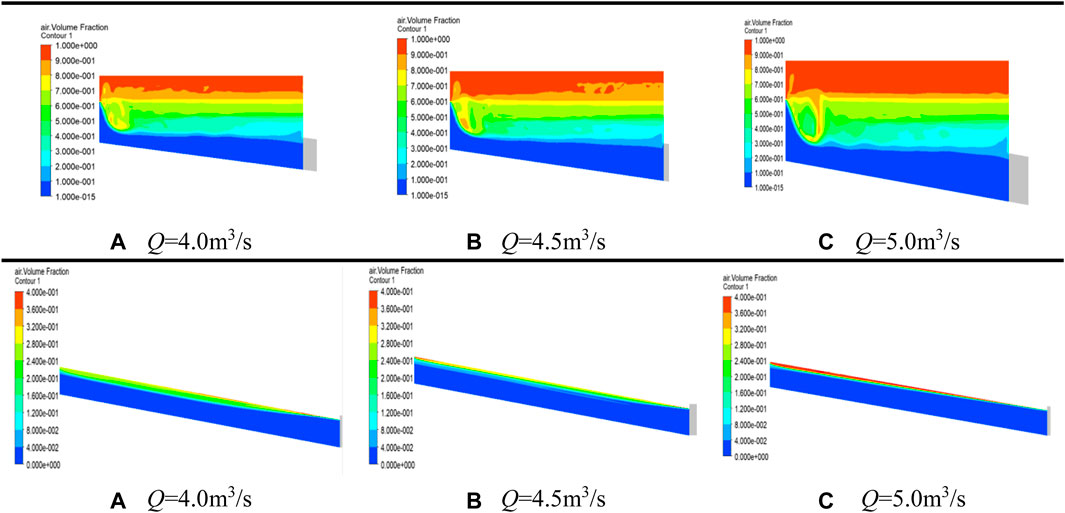
FIGURE 4. The gas–liquid distribution of the inlet flow channel under different water levels. Q in represents different flow rates.
Pressure Distribution of Overflow Components
Cross-Sectional Pressure Distribution in the Suction Chamber
Taking XY as the plane, we draw the pressure distribution diagram of the oil suction cavity section under different flow conditions in the Z-direction. Blue represents the lowest pressure and red represents the highest pressure. It can be seen from Figure 5 that with a rising Z value, the blue area at the interface between the suction chamber and the impeller is decreasing, which means that the pressure is increasing. While the whole area at the housing and other areas of the suction chamber is becoming lighter and the pressure is decreasing. Comparing the position of the blue area, the pressure in the suction chamber near the contact surface of the impeller decreases with the increase in the distance in the Z-direction. Figure 5 shows the pressure distribution of the suction chamber cross section at low flow rate (Q = 4.0 m3/s). Comparing the different flow conditions, in the small flow condition, the pressure on the section of the entire suction chamber is greater than the pressure on the section under the design flow condition, particularly at the curved part of the suction chamber inlet. Because the direction of the fluid changes at these positions, the pressure value is greater than other positions.

FIGURE 5. Cross-sectional pressure diagram of the suction chamber at Q = 4.0 m3/s. Z in represents different cross-sectional heights.
Impeller Cross-Sectional Pressure Distribution
Taking XY as the plane, we analyze the pressure distribution of the impeller cross section in the Z-direction under the design condition. The maximum cross-sectional pressure at Z = 0.1 m is 881.7 kPa, at Z = 0.15 m is 632.5 kPa, and at Z = 0.2 m is 8,437.9 kPa. The overall pressure decreases with the increase in the cross-sectional distance in the Z-direction. The pressure at the inlet of the blade is the lowest, and gradually increases in the direction of the outlet of the blade. Figure 6 shows the pressure distribution of each impeller section at Q = 4.0 m3/s. The maximum cross-sectional pressure at Z = 0.1 m is 897.5 kPa, at Z = 0.15 m is 647.0 kPa, and at Z = 0.2 m is 462.6 kPa. The relationship between the pressure and the distance in the Z-direction is the same as the design flow condition. Furthermore, the pressure at the inlet of the impeller is smaller than the pressure at the outlet of the impeller, and the pressure on each blade increases gradually in the clockwise direction.

FIGURE 6. Impeller cross-sectional pressure diagram at Q = 4.0 m3/s. Z in represents different cross-sectional heights.
Pressure Distribution of the Spiral Shell Cross Section
Plot the pressure distribution of the spiral shell cross section in the Z-direction in the design flow condition and low flow condition (Q = 4.0 m3/s), the results are showed in Figure 7. The position of Z = 0 m is also the position of the central section of the shell. According to its pressure distribution, the annular channel of the inlet of the shell owns the smallest pressure of the whole shell components. With the direction of water flow till the outlet part of the shell, the pressure from the inner wall surface to the outer wall surface is increasing. In the diagram with Z = 0 m for design flow and low flow, a circular orange area at the exit of the shell can be seen, surrounded by a red area at higher pressures, indicating the possible presence. In the cross section away from the central section, the pressure in the shell decreases slightly. But in the cross section away from the profile, there are more red areas, filling almost the entire exit section of the shell. But the cross section between Z = 0.05 m and Z = 0.1 m does not show any orange areas in the central section. It can be observed that as the flow rate increases, the pressure in the various sections of the shell decreases (Lomakin et al., 2016).

FIGURE 7. Q = 4.0 m3/s spiral shell cross-sectional pressure diagram. Z in represents different cross-sectional heights.
Pump Cavitation Characteristic
Based on the experimental results and external characteristics analysis, the cavitation may occur in the pump. Three flow conditions are designed in the numerical simulation of cavitation, the pump inlet pressure is reduced from 2 atm (101,325 Pa) to 1 atm, forcing the centrifugal pump cavitation.
Design Flow Conditions
It can be seen from Figure 8 that when the inlet pressure is reduced from 2 to 1 atm, the volume of the bubbles on the back of the blade changes during the whole process. From the beginning of the bubble, the volume of the bubble on the blade suction side will increase with every 0.1 atm decreasing until the inlet pressure drops to 1 atm. It can be found that the bubble volume at the inlet of the blade gradually increases until it reaches the maximum at 1 atm. On the contrast, the bubble volume in the direction of the outlet gradually decreases and reaches the lowest. And there is no cavitation on the outside of the blade because of the inlet pressure on the back of the blade reaching the lowest. As showed in Figure 8, the bubbles first appeared at the back of the blade. As the pressure increased, the bubbles moved toward the blade outlet and gradually spread to the inside through the flow channel. The pressure of the blade inlet penetrated again and gradually started to compress the bubble, made the volume of the bubble rapidly decrease until it busted. The surrounding high-pressure liquid quickly fills the volume left by the burst of the bubble. When the inlet pressure drops to 1atm, the volume of the bubbles on the back of the blade has almost reached 1/2 of the entire blade.

FIGURE 8. Volume distribution of cavitation on the blade suction side. P in represents different atmospheric pressures.
With the reduced inlet pressure, the vapor phase volume fraction in the impeller runner changes a lot - the results are shown in Figure 9. The inlet pressure from 2.0 atm down to 1.5 atm, the impeller runner volume of the bubbles did not change much. When the pressure falls, the impeller runner volume fraction of the bubbles begins to grow substantially. The inlet pressure at 1.3 atm of the bubble volume fraction has increased significantly. The vapor phase volume fraction increases significantly with every 0.1 atm decreasing of the inlet pressure.
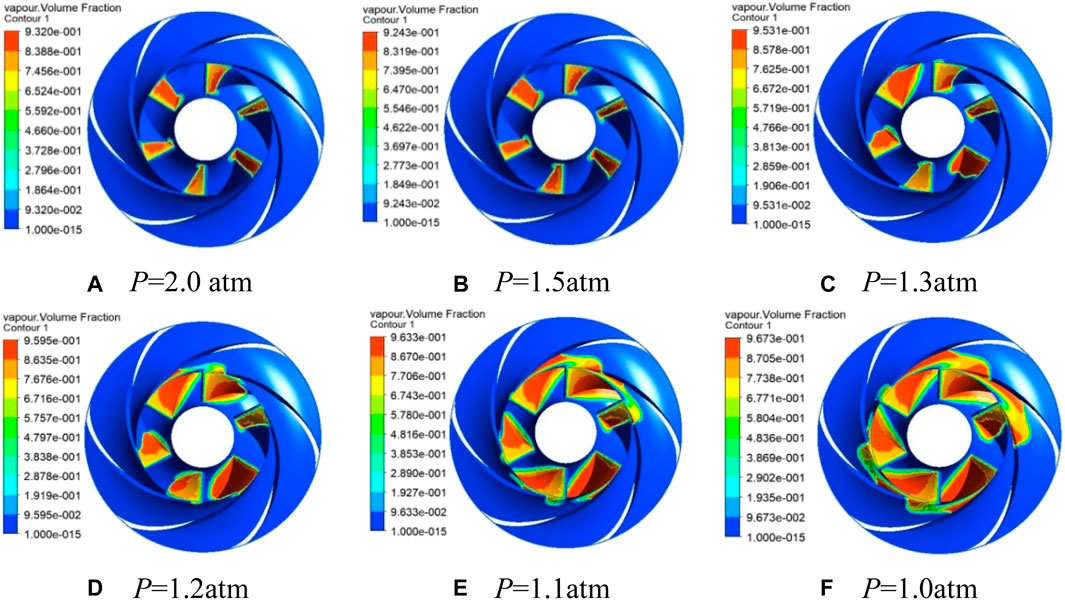
FIGURE 9. Volume distribution of cavitation with the trash rack. P in represents different atmospheric pressures.
Off-Design Conditions
The head and NPSH at the corresponding inlet pressure can be solved by the relevant formula. The cavitation characteristic curve of the centrifugal pump under different flow conditions have been plotted in Figures 10A–C. As the NPSH decreases, the pump head also decreases in all the figures. At Q = 4.0 m3/s, when the NPSH drops to 15 m, the head starts to drop. After that, when the pressure is reduced by 1atm, the head will be greatly reduced. It is generally believed that when the head of the pump drops by 3%, it is considered that the cavitation has occurred inside the pump. The cavitation margin at this time is the critical cavitation margin, which can be calculated. The critical cavitation allowance under small flow conditions is 8.9 m. The critical cavitation can be calculated as 10.9 m, and the centrifugal pump in the design flow conditions is 10.5 m, which also confirms the accuracy of the numerical simulation.
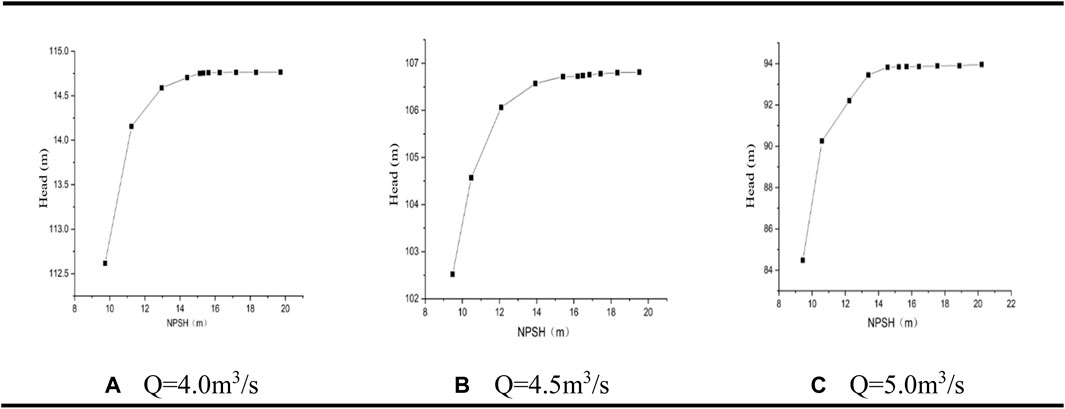
FIGURE 10. Cavitation curves for different operating conditions. Q in represents different flow rates.
Vibration Characteristics of the Centrifugal Pump With Trash Rack
Vibration of Bearing Housing at the P1 Monitoring Site
The design flow rate is 4.57 m3/s, the speed is 750 r/min, and the theoretical shaft frequency is 75 Hz. Figure 11A is the bearing vibration velocity of the unit under different flow conditions without the trash rack. It can be seen from Figure 11A the diagram of the vibration velocity amplitude of the pump casing in the low-frequency section. The vibration amplitude at the maximum flow rate can reach 4.65 mm/s, and the minimum vibration amplitude at the minimum flow rate is about 4.3 mm/s. The maximum velocity amplitude at the low-frequency band in Figure 11A will decrease as the flow rate decreases.
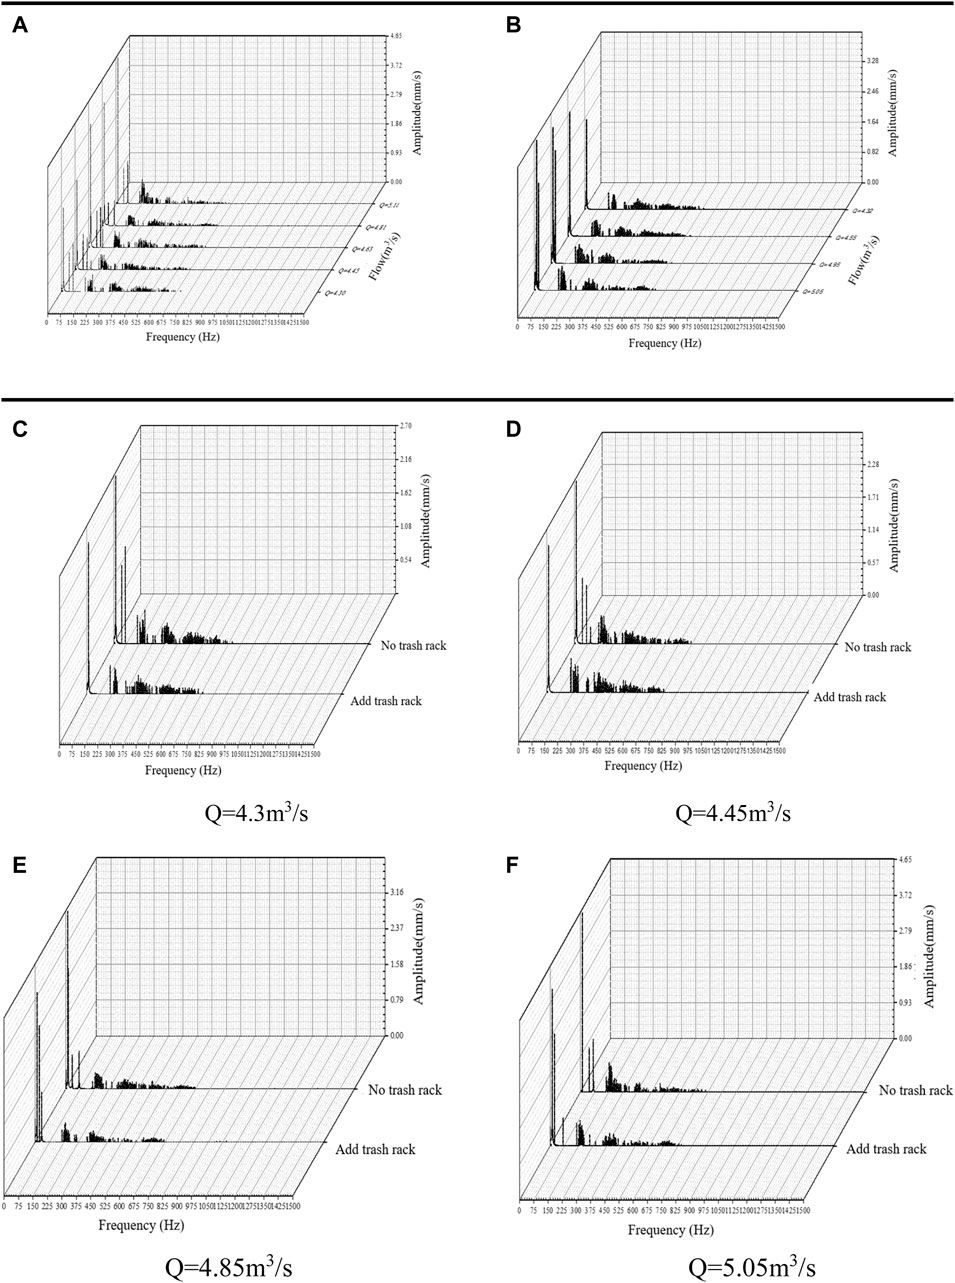
FIGURE 11. Vibration velocity distribution of P1 monitoring point. ((A) Vibration velocity distribution of P1 without the trash rack. (B) Velocity frequency domain distribution of P1 with the trash rack. (C)–(F) Distribution of velocity frequency domain for different flow conditions at P1 (C) Q = 4.3 m3/s, (D) Q = 4.45 m3/s, (E) Q = 4.85 m3/s, and (F) Q = 5.05 m3/s).
Figure 11B shows the vibration velocity amplitude distribution in the frequency spectrum with different flow conditions after adding the trash rack. The vibration velocity amplitude can reach 4.0 mm/s at the maximum flow and 2.45 mm/s at the minimum flow. Comparing Figure 11A with Figure 11B, the velocity amplitude in the low-frequency band is much larger after adding the trash rack. The amplitude of the velocity frequencies decreases as the flow rate decreases.
Figures 11C–F represent the frequency spectra of the bearing housing vibration velocity at each flow condition. No matter in which flow condition without the trash rack, there will always be many irregular vibration velocity spectral components in the low-frequency band. The figure shows that the large vibration velocity amplitude occurs again 2 times at the shaft frequency in both the high flow conditions, which is probably due to the higher flow and poor stability of the pump shortly after discharge.
Vibration of Bearing Housing at the P2 Monitoring Site
The vibration pattern at the P2 monitoring point of the pump in the low-frequency band is more complicated without the trash rack. In each flow condition, the largest value can reach upto 2.5 mm/s. Near the designed condition, the smallest amplitude is 1.8 mm/s which is smaller than the range of the velocity amplitude at P1. The vibration amplitude variation pattern at P2 is more complex due to the turbulence. The vibration pattern of the pump casing at P2 is more simplified after adding the trash rack, and the vibration amplitude in the low-frequency band is also much smaller. The maximum vibration amplitude can reach upto 4.7 mm/s and the minimum vibration amplitude is 1.8 mm/s, which is better optimized compared with the vibration amplitude without the trash rack.
By comparing the velocity frequency domain diagrams at the same flow condition, it can be found that under small flow condition, the largest values of velocity appear at the shaft frequency, but the largest values of velocity appear at the blade frequency in the large flow condition. Moreover, after excluding the influence of weeds and other debris, the pump vibration condition under the P2 monitoring point is well improved. The vibration amplitude in the wide frequency area will become relatively simple with the decrease of weeds and other debris with the trash rack.
Vibration of Bearing Housing at Different Flow Conditions
The change of P3 (different from the position monitored by P1) is very similar to the change of the P1 monitoring point. Without the trash rack, the vibration velocity amplitude is slightly higher, the velocity amplitude is larger, and the vibration velocity spectral components are also higher. The vibration velocity spectral components of P2, P3, P1, and P5 under low and high flow conditions are compared, as shown in Figures 12A–D. It can be found that the largest vibration velocity amplitude of P2 is greater than the largest vibration velocity amplitude of P3 in all the conditions. At the low frequency, the vibration times of P3 becomes longer than P2, and in the high frequency, the broadband region of P2 becomes wider than P3. For P1 and P5, it can be found that the vibration of P1 in the low-frequency band is slightly better than that of the P5 monitoring points. The vibration amplitude of P1 in low-frequency band is higher than P5. The vibration amplitude of P1 in the high-frequency area is smaller than the P5. But at the higher frequency, the P5 monitoring point does not have a significant vibration amplitude.
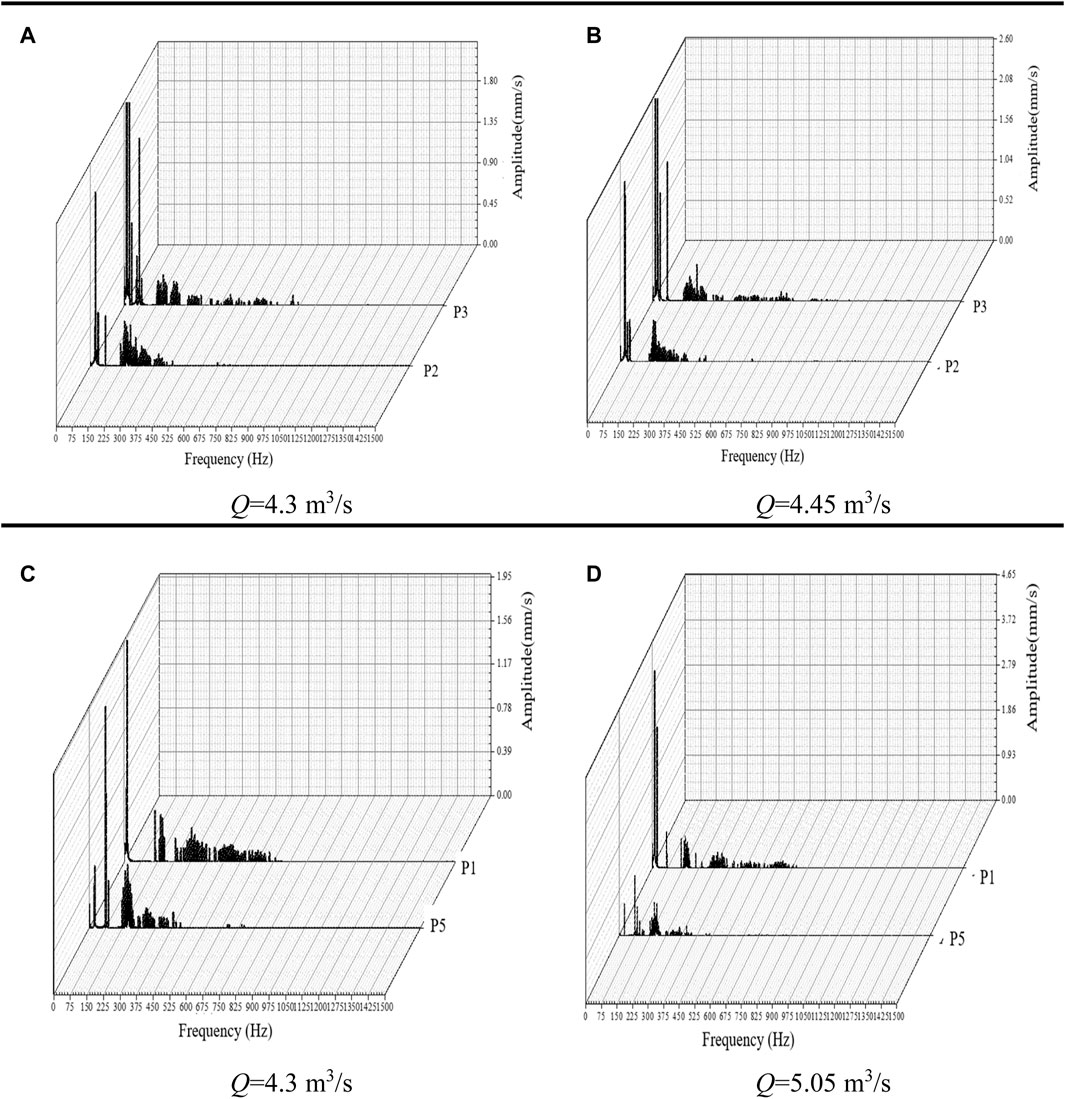
FIGURE 12. Velocity frequency spectra at P3 for each flow condition. Q in represents different flow rates.
The changes in the vibration frequency spectra taken at the monitoring sites show some similarity in the pump casing vibration when measured in the same direction. As the pump is a double-suction centrifugal pump, flow inlets, the influence of water flow velocity, inlet size, and other factors will lead to a certain difference in the flow field. According to the vibration velocity spectral components of all the monitoring points, it is obvious that: 1) after adding the trash rack, the vibration frequency domain of each monitoring point is better than the speed frequency domain. 2) Irregular vibration amplitude is found in the low-frequency region of each monitoring point, but is further reduced in the frequency domain after adding the trash rack. 3) The irregular vibration amplitude may be caused by the cavitation in the centrifugal pump.
Conclusion
In thisarticle, the change law of the vibration of the centrifugal pump during operation was studied by using experimental and numerical simulations. The results presented the flow decay mechanism of a double-suction pump station. The main works and findings can be summarized as follows:
1) We monitored the vibration of the pump bearings in real time. The results showed that the pump vibration curves were significantly improved after adding the trash rack.
2) We compared and analyzed the gas (air)–liquid (water) characteristics of each component under different conditions by the numerical simulations. The gas in the inlet flow channel could not affect the normal operation of the pump.
3) The head gradually decreases as the flow rate rises, and the efficiency reached the maximum when the flow rate was 4.5 m3/s.
4) Based on the numerical simulation of cavitation, the change law between the bubble volume on the blade suction side and the inlet pressure under the three flow conditions was analyzed. The critical NPSH was calculated to be 8.9, 10.9, and 12.9 m, respectively.
5) Serious cavitation has happened inside the pump. This is the main reason that causes the centrifugal pump performance and pump flow to drop. It is hoped that the cavitation of the pump can be more effectively solved with the joint cooperation of more scholars in the future.
Data Availability Statement
The raw data supporting the conclusion of this article will be made available by the authors, without undue reservation.
Author Contributions
DM contributed to the conception of the study; ZL performed the data analyses and wrote the manuscript; TJ performed the experiment; MZ contributed significantly to analysis and manuscript preparation; WJ helped perform the analysis with constructive discussions; and GH performed the analysis with constructive discussions.
Funding
The present study was financially supported by the Xijing University Research Foundation (Grant No. XJ170201).
Conflict of Interest
Author TJ was employed by the company Innovation Institute of Shaanxi Aerospace Power High Tech Co., Ltd.
The remaining authors declare that the research was conducted in the absence of any commercial or financial relationships that could be construed as a potential conflict of interest.
Publisher’s Note
All claims expressed in this article are solely those of the authors and do not necessarily represent those of their affiliated organizations, or those of the publisher, the editors, and the reviewers. Any product that may be evaluated in this article, or claim that may be made by its manufacturer, is not guaranteed or endorsed by the publisher.
References
Adamkowski, A., Henke, A., and Lewandowski, M. (2016). Resonance of Torsional Vibrations of Centrifugal Pump Shafts Due to Cavitation Erosion of Pump Impellers. Eng. Fail. Anal. 70, 56–72. doi:10.1016/j.engfailanal.2016.07.011
Botros, K. K., Clavelle, E. J., and Vogt, G. M. (2016). Interfacial Contamination between Batches of Crude Oil Due to Dead-Legs in Pump Station Piping. J. Energ. Resour. Techn. 138 (5). doi:10.1115/1.4033401
de O Turci, L., Wang, J., and Brahmia, I. (2020). Adaptive and Improved Multi-Population Based Nature-Inspired Optimization Algorithms for Water Pump Station Scheduling. Water Resour. Manage. 34 (9), 2869–2885. doi:10.1007/s11269-020-02588-3
Dong, W., and Chu, W.-L. (2018). Numerical Investigation of the Fluid Flow Characteristics in the Hub Plate Crown of a Centrifugal Pump. Chin. J. Mech. Eng. 31 (1), 64. doi:10.1186/s10033-018-0264-z
Fu, S., Zheng, Y., Kan, K., Chen, H., Han, X., Liang, X., et al. (2020). Numerical Simulation and Experimental Study of Transient Characteristics in an Axial Flow Pump during Start-Up. Renew. Energ. 146, 1879–1887. doi:10.1016/j.renene.2019.07.123
Guelich, J. F., and Egger, R. (1992). Part-load Flow and Hydraulic Stability of Centrifugal Pumps. United States. Final Report. Available at: https://www.osti.gov/biblio/10131487.
Guo, S., Qian, Y., Zhu, D. Z., Zhang, W., and Edwini-Bonsu, S. (2018). Effects of Drop Structures and Pump Station on Sewer Air Pressure and Hydrogen Sulfide: Field Investigation. J. Environ. Eng. 144 (3), 04018011. doi:10.1061/(asce)ee.1943-7870.0001336
Kaupert, K. A., and Staubli, T. (1999). The Unsteady Pressure Field in a High Specific Speed Centrifugal Pump Impeller-Part I: Influence of the Volute. J. Fluids Eng. 121 (3), 621–626. doi:10.1115/1.2823514
Kreuz-Ihli, T., Filsinger, D., Schulz, A., and Wittig, S. (1999). Numerical and Experimental Study of Unsteady Flow Field and Vibration in Radial Inflow Turbines. J. Turbomach. 122 (2), 247–254. doi:10.1115/1.555441
Li, X., Gao, P., Zhu, Z., and Li, Y. (2018). Effect of the Blade Loading Distribution on Hydrodynamic Performance of a Centrifugal Pump with Cylindrical Blades. J. Mech. Sci. Technol. 32 (3), 1161–1170. doi:10.1007/s12206-018-0219-4
Liu, H., Ding, J., Dai, H., and Tan, M. (2014). Investigation into Transient Flow in a Centrifugal Pump with Wear Ring Clearance Variation. Adv. Mech. Eng. 6, 693097. doi:10.1155/2014/693097
Lomakin, V. O., Kuleshovav, M. S., and Bozh’eva, S. M. (2016). Numerical Modeling of Liquid Flow in a Pump Station. Power Technol. Eng. 49 (5), 324–327. doi:10.1007/s10749-016-0623-9
Mortazavi, F., Riasi, A., and Nourbakhsh, A. (2017). Numerical Investigation of Back Vane Design and its Impact on Pump Performance. J. Fluids Eng. 139 (12). doi:10.1115/1.4037281
Muggli, F. A., Eisele, K., Casey, M. V., Gu¨lich, J., and Schachenmann, A. (1997). Flow Analysis in a Pump Diffuser-Part 2: Validation and Limitations of CFD for Diffuser Flows. J. Fluids Eng. 119 (4), 978–984. doi:10.1115/1.2819526
Nishida, M., Nakayama, K., Sakota, D., Kosaka, R., Maruyama, O., Kawaguchi, Y., et al. (2016). Effect of Impeller Geometry on Lift-Off Characteristics and Rotational Attitude in a Monopivot Centrifugal Blood Pump. Artif. Organs 40 (6), E89–E101. doi:10.1111/aor.12697
Posa, A., and Lippolis, A. (2019). Effect of Working Conditions and Diffuser Setting Angle on Pressure Fluctuations within a Centrifugal Pump. Int. J. Heat Fluid Flow 75, 44–60. doi:10.1016/j.ijheatfluidflow.2018.11.011
Schäfer, T., Neumann, M., Bieberle, A., and Hampel, U. (2017). Experimental Investigations on a Common Centrifugal Pump Operating under Gas Entrainment Conditions. Nucl. Eng. Des. 316, 1–8. doi:10.1016/j.nucengdes.2017.02.035
Wang, C., Shi, W., Wang, X., Jiang, X., Yang, Y., Li, W., et al. (2017). Optimal Design of Multistage Centrifugal Pump Based on the Combined Energy Loss Model and Computational Fluid Dynamics. Appl. Energ. 187, 10–26. doi:10.1016/j.apenergy.2016.11.046
Wang, S., Fu, B., Piao, S., Lü, Y., Ciais, P., Feng, X., et al. (2016). Reduced Sediment Transport in the Yellow River Due to Anthropogenic Changes. Nat. Geosci 9 (1), 38–41. doi:10.1038/ngeo2602
Yang, J., Pavesi, G., Yuan, S., Cavazzini, G., and Ardizzon, G. (2015). Experimental Characterization of a Pump–Turbine in Pump Mode at Hump Instability Region. J. Fluids Eng. 137 (5). doi:10.1115/1.4029572
Yousefi, H., Noorollahi, Y., Tahani, M., Fahimi, R., and Saremian, S. (2019). Numerical Simulation for Obtaining Optimal Impeller's Blade Parameters of a Centrifugal Pump for High-Viscosity Fluid Pumping. Sustainable Energ. Tech. Assessments 34, 16–26. doi:10.1016/j.seta.2019.04.011
Zhang, N., Liu, X., Gao, B., and Xia, B. (2019). DDES Analysis of the Unsteady Wake Flow and its Evolution of a Centrifugal Pump. Renew. Energ. 141, 570–582. doi:10.1016/j.renene.2019.04.023
Keywords: centrifugal pump, vibration, external characteristics, cavitation, numerical simulation
Citation: Meng D, Jiang T, Liu Z, Zhao M, Jiang W and Hou G (2022) Research of the Flow Attenuation Mechanism of a Double-Suction Pump. Front. Energy Res. 10:819230. doi: 10.3389/fenrg.2022.819230
Received: 21 November 2021; Accepted: 03 March 2022;
Published: 29 March 2022.
Edited by:
Ling Zhou, Jiangsu University, ChinaReviewed by:
Jiang Lai, Nuclear Power Institute of China (NPIC), ChinaScappaticci Lorenzo, Università degli Studi Guglielmo Marconi, Italy
Copyright © 2022 Meng, Jiang, Liu, Zhao, Jiang and Hou. This is an open-access article distributed under the terms of the Creative Commons Attribution License (CC BY). The use, distribution or reproduction in other forums is permitted, provided the original author(s) and the copyright owner(s) are credited and that the original publication in this journal is cited, in accordance with accepted academic practice. No use, distribution or reproduction is permitted which does not comply with these terms.
*Correspondence: Gaoyang Hou, Z3lob3U0MTVAbndhZnUuZWR1LmNu
 Dongrong Meng
 Ting Jiang2
 Zhengguang Liu
 Gaoyang Hou
