 Shuquan Zhang
 Ye Wang
94% of researchers rate our articles as excellent or good
Learn more about the work of our research integrity team to safeguard the quality of each article we publish.
Find out more
ORIGINAL RESEARCH article
Front. Energy Res. , 28 February 2022
Sec. Sustainable Energy Systems
Volume 10 - 2022 | https://doi.org/10.3389/fenrg.2022.817767
This article is part of the Research Topic Economics and Policies in Formulating Renewable Power Development Plans View all 11 articles
To meet the carbon neutralization goal and renewable energy development, it is of great significance to promote the construction of gas-fired power generation for power peak shaving. From the perspective of regional coordination (corresponding to three scenarios), this paper systematically calculates the power peak shaving demand and the demand for gas-fired power generation capacity in regions of China, by using Mathematical Programming and Shapley value. Compared with the existing research, this paper may make theoretical contributions to the following aspects: studying more spatial scopes and time scales of peak shaving, analyzing the complete system of “coal power—renewable energy—gas power”, and applying cooperative game model to peak shaving issue. We find that, firstly, compared with the scenario of independent peak shaving in a single province (Scenario 1), the peak shaving demands of load and renewable energy are greatly reduced in the scenarios of areal coordination (Scenario 2) and national coordination (Scenario 3), especially renewable energy; secondly, abandonment of 110,766 MWh of renewable energy power occurring in Scenario 2 is avoided in Scenario 3. Compared with Scenario 2, the final peak shaving demands of seven areas in China are simultaneously reduced in Scenario 3. The largest reduction rate is 14% from East China. Thirdly, with deep peak shaving restricted by certain constraints, gas power generation for start-stop peak shaving is inevitable. Compared with Scenario 2, national coordination (Scenario 3) can eliminate 120,714 MW of start-stop peak shaving demand (SS-PSD); finally, flexibility retrofit of existing facilities can further significantly curtail SS-PSD. Based on the above research results, some recommendations are put forward, including developing areal coordination and national coordination mechanisms for peak shaving, clarifying allocation plan of SS-PSD based on the fairness principle (i.e., Shapley value) as soon as possible, encouraging East China, Central China, and North China to take the lead in establishing trading markets of SS-PSD, giving priority to meeting the most urgent and economic peak shaving demand, and establishing a coordination mechanism between new and old units for flexibility retrofit.
To meet the carbon neutralization goal, vigorously developing renewable energy has been an important challenge worldwide, and China is no exception. Table 1 shows the data of China’s renewable energy power generation in 2020. According to Table 1, in 2020, there is a certain proportion of renewable power generation abandoned in China due to limited power peak shaving capacity. As rapid development of renewable energy power continues, China calls for more power peak shaving capacity. According to The Letter on Soliciting the Weight of Responsibility for Renewable Energy Power Consumption in 2021 and the Expected Target Suggestions for 2022–2030, which was issued by the National Energy Administration of China in 2021, the total installed capacity of wind and solar power is required to reach more than 12 × 108 kWh in 2030. According to the plan of National Energy Administration of China, each province ought to raise the proportion of renewable energy power consumption to 40% by 2030.
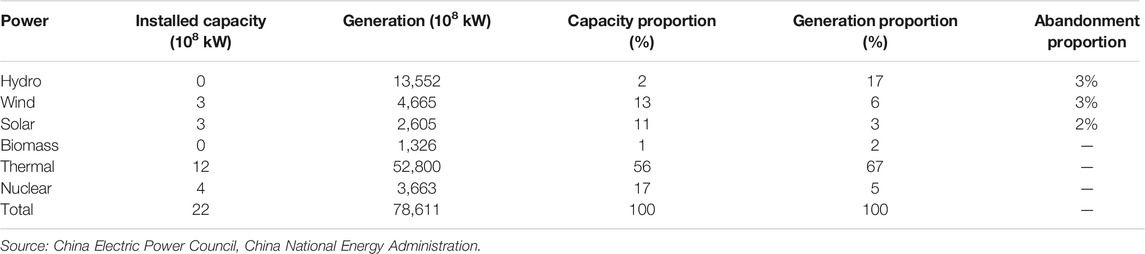
TABLE 1. China’s power generation in 2020.
Renewable energy power generation is characterized by intermittency, randomness, and volatility, while the power system needs to keep balance at any time. If the supply sector lacks peak shaving capacity, end users have to cut down their power consumption under pressure of balancing the power system. The power rationing in California, United States and Northeast China in 2021 are two examples.
In addition to wind and photovoltaic power, there are many other ways to generate electricity including nuclear, hydro, coal, and gas power. However, not all of them are competent in power peak shaving. The nuclear power units need to operate stably for safety. Water resources’ distribution is limited (Oil Observer, 2020). Coal power has many drawbacks such as high pollution and limited peak shaving ability (Zhang et al., 2011). Therefore, these power sources hardly function as start-stop peak shaving energy.
Compared with other types of traditional power, natural gas power has significant advantages of low carbon and pollution, outstanding flexibility, and greater depth of peak shaving. Consequently, it is the relatively ideal peak shaving resource. In terms of low carbon and pollution, gas power emits 50% less CO2 and 80% less NOx than coal power does. Moreover, there is almost no SOx, particulate matter, solid waste, and heavy metals (such as Mercury) emission of gas power (Li and Bai, 2010; Staple and Bean, 2013; Chang et al., 2015). Meanwhile, gas power entails less water and land resources (Staple and Bean, 2013). With the promotion of coal to gas and the more natural gas utilization, China’s particulate matter level has decreased significantly from 2015 to 2018 (IEA, 2019). In terms of outstanding flexibility, the ramping rate of gas power plants (especially OCGT) is higher than that of coal-fired power plants. Thus, the start-up time of gas power plants is shorter. Start-up time refers to the time required from start-up to achieve minimum stable load. Among the most commonly used techniques, the average hot-start (idle for less than 5 h) times (Agora, 2017; Glensk and Madlener, 2019) for OCGT, CCGT, hard coal, and lignite power plants are 8, 75, 165, and 300 min, respectively. The cold-start (idle for more than 40 h) time for all types of power plant is two to three times longer than hot-start time, except for OCGT. For OCGT, cold-start time are similar to hot-start time. Power plants’ start-up time with the latest technology is 20–40% less compared to that in the current most commonly used technology, except for OCGT, whose start-up time remained unchanged. In addition to affecting start-up time, idle time of power plants also affects start-up costs. Gas power plant’s start-up costs of hot-start, warm-start (idle time is between 5 and 40 h), and cold-start (Glensk and Madlener, 2019) are 57 €/MW, 83 €/MW, and 117 €/MW, respectively. Considering start-up cost, regional coordinated peak shaving is necessary for the smooth operation of power plants. In terms of greater depth of peak shaving, the minimum load of OCGT, CCGT, hard coal, and lignite is 20, 30, 25, and 35%, respectively in the latest technology. What’s more, gas power can even reach an 100% peak shaving depth through start-stop operation, which is a huge advantage over coal power.
Natural gas power generation began in the first half of the 20th century and developed rapidly in the second half (Breeze, 2016). As of today, gas-fired power generation keeps growing, but mainly in developed regions and major gas-producing regions, such as the US, Europe, and Russia. In case of confusion, “region” in the paper refers to any geographic scope, including a province, area, country and even country union like the European Union. Among them, “area” specifically refers to a certain geographical scope larger than a province but smaller than a country, such as the area of North China. Currently, natural gas is the second largest power source after coal worldwide. In 2019, gas-fired power generation in the US, United Kingdom, and Japan accounted for 38.63, 40.10, and 35% respectively of their total power generation (Li, 2021).
Fighting against atmospheric pollution is a universal driver of gas-fired power worldwide. For Europe and the US, increased resource availability and higher consumption ability are also important contributing factors. Unlike the US and Europe, air pollution control (e.g., haze) is the main driver of fuel switching in China (IEA, 2020a). In this context, coal-to-gas conversion in China has occurred mainly in the industrial and residential sectors (IEA, 2019), rather than in the power generation sector. Since it is not a priority field for natural gas utilization, gas-fired power in China has developed slowly (China Power Network, 2021) (Yang, 2021). (East China Energy Supervision Bureau, 2020). With large renewable energy power generation, China needs to change the status. The China Natural Gas Development Report (2021) published by the National Energy Administration of China states that gas power peak shaving has been positioned as an important part of future power systems dominated by renewable energy (Li, 2021).
For transformation to a zero-carbon society, natural gas, as a bridge energy, is a realistic option (Staple and Bean, 2013; Breeze, 2016; Cowell, 2020). This is reflected in the coal-to-gas trend in many countries. With the development of renewable energies, the trend of coal-to-gas conversion is replaced by transformation from fossil to renewable energies (IEA, 2018), especially in the power sector. As a result, gas power tends to provide flexible auxiliary services for renewable energy generation (Breeze, 2016). Detailed reasons are given as follows. Firstly, renewable energy power is cleaner than gas power. In this respect, renewable energy power is more suitable for base load power (IEA, 2019). Secondly, gas-fired power is already less economical than renewable energy generation (IEA, 2018, 2019, 2020), which drives gas-fired power plants to change their role voluntarily. Despite low investment (CAPEX), gas-fired power has higher operating costs (OPEX). Therefore, gas power should be used for start-stop peak shaving. Thirdly, compared to other types of conventional generation, the main advantages of gas power are the speed and cost of start-stop (especially OCGT). In this respect, gas power is the best alternative for start-stop peak shaving (at least for the near term).
In addition to gas-fired power, other potential flexible energies include hydrogen, batteries, and fuel cells. Given low-carbon development goals, using fossil energy in cleaner ways (e.g., combined with CCUS technology) is expected to reduce dependency on renewable energy. However, these technologies are not yet economically viable, especially in large-scale applications (Breeze, 2016; IEA, 2019; IEA, 2020b). Compared to the above technologies, gas-fired power has such advantages as being competent in all kinds of peak shaving like multi-time interval (short-term and long-term) and large capacity. All in all, gas-fired generation is undoubtedly the most desirable auxiliary energy source in the short to medium term.
As gas power is shifting to mainly provide ancillary services, it is necessary to measure peak shaving demand to help with planning and investing in peak shaving units. Unnecessary demand for peak shaving, a relatively expensive service, needs to be eliminated wherever possible. To this end, regional coordination is a good option. Here is an example: at a certain time, region A generates 10 MWh of power, although it only needs five MWh. Region B is in the opposite situation. When the two regions are not connected, both region A and B need five peak shaving power, adding up to 10. If the two regions are connected and trade power, the surplus power in region A will be transmitted to region B. As a result, the peak shaving power generation in both regions is 0. At the same time, both sides can also get additional benefits. Region A can increase revenue, and region B can also reduce power generation cost (the peak shaving power generation cost is generally higher than the price of foreign surplus power). Lacking electricity spot markets, China has established 14 electricity ancillary service markets, including four areal markets (North China, Northeast China, Northwest China, and East China) and 10 provincial markets (Xinjiang, Mengxi, Gansu, Guangdong, etc.,). From January to October 2020, the volume of inter-area and inter-province transactions amounted to 5,152 and 12,796 × 108 KWh respectively, accounting for 8.5 and 21% of national electricity generation (60,288 × 108 KWh) in that period. Therefore, regional coordination in power systems already has some practical basis. However, most of these transactions are long-term contractual ones. Moreover, China’s power peak shaving and regional coordination currently relies on coal-fired power. Based on this, the regional coordination mechanism needs to be improved.
Based on the above-mentioned era background and development status, it is of great practical significance to study the gas-fired power demand for peak shaving from the perspective of regional coordination. The following section is structured as follows. Section 2 reviews some literature on methods of calculating peak shaving capacity demand and its allocation among regions. Section 3 establishes the methods of electricity peak shaving demand and the demand for gas-fired peak shaving capacity. Section 4 presents the main calculation results and their analysis, followed by conclusions and recommendations in the last section.
Before calculating peak shaving demand, it is necessary to introduce the definition. For a load curve, the peak shaving demand is the peak-valley difference of the curve (within a certain time) (Zhang et al., 2011). As renewable energy power is connected to the power grid, peak shaving demand changes (usually becoming larger). For example, wind power has an inverse peak shaving nature. Wind power output curve is inverse to load curve, calling for other units to reduce more output (for peak shaving). In an extreme but possible scenario, where load curve and wind power output curve move in the exact opposite directions, peak shaving demand equates to the sum of the peak-valley difference in load curve and the wind power capacity (Zhang et al., 2011). With renewable energy generation considered, the framework for calculating peak shaving demand of a power system (for a certain time horizon) is set up as follows (Chen, 2020). Firstly, the net load curve is derived. The net load is equal to the initial load minus renewable power generation. Secondly, the total peak shaving demand is determined after considering reserve capacity of power plants. Thirdly, the peak shaving ability (e.g., peak shaving depth) of power plants is determined. Finally, the peak shaving capacity demand of the whole power system is estimated. In determining the capacity of each peak shaving energy, certain technical and economic constraints need to be considered. When it comes to constraints, the commonly used calculation model, Mathematical Programming, is applicable (Fan et al., 2020).
For different time intervals (peak shaving cycle), peak shaving demand varies. The shorter the discussed time is, the smaller the fluctuation of net power load and peak shaving demand is. Time intervals can be divided into minutes, hours, days, weeks, months, seasons, and even years. Peak shaving techniques differ for different time intervals. For example, energy storage is more suitable for short peak shaving cycles (e.g., minutes), while thermal units function better for long peak shaving cycles (e.g., days and longer cycles) (Zhao et al., 2015). In a study of peak shaving demand of thermal units in eastern Inner Mongolia (Li, 2020), the author aimed at the peak shaving cycle of hours. Pimm et al. (2018) considered the temporal differences in loads and renewable energy generation, such as workday-holiday difference and summer-winter difference, when studying the peak shaving effect of distributed battery energy storage in a certain United Kingdom residential area.
For different targets, peak shaving demand differs. For example, Zhao et al. (2015) studied the capacity allocation of hybrid energy storage technologies under different peak shaving targets. Peak shaving targets were divided into three types. The first type is smoothing wind power output. By storing energy, the wind power output (after incorporating battery storage) curve is a flat line (without considering the load). Under this strategy, the charging and discharging thresholds are the same value. The second type is smoothing the net load (wind + load). It aims to flatten the net load curve, but only for one charge-discharge cycle. In this case, the continuous charging and discharging times are long. Charging and discharging thresholds depend on the long-term load curve, long-term wind power output forecast, and the battery status. The last type is smoothing the net load, and for multiple charging and discharging cycles. Each charging-discharging cycle is short. This target is applicable when frequent fluctuations of wind power output happens. The charging and discharging thresholds depend on the short-term load profile, short-term generation output forecast, and the battery status. The required battery capacity decreases sequentially in the three targets. For peak shaving with battery storage, the load threshold corresponding to the battery discharge is equivalent to peak shaving threshold of the battery.
How to select charging and discharging thresholds of battery is important, since it determines peak shaving demand. Although it is about batteries, this issue sheds light on calculating capacity of gas-fired power plants. Leadbetter and Swan (2012) used the quantile method to select the discharge threshold for the power load duration curve. The curve generally shows a decreasing trend. The higher the load, the shorter the duration occurs. The quantile is a load value whose corresponding duration is no less than the aggregated duration corresponding to a certain percentage of the load level. For example, there are only three possible load values, namely 10, 20, and 30 MW, and the corresponding duration is 3, 2, and 1 h. For this duration curve (frequency profile), 20 MW is the (2 + 3)/(1 + 2+3) = 5/6 quantile of the curve. Similarly, 10 and 30 MW are respectively 3/6 and 6/6 quantile. The quantile method of selecting the discharge threshold means that a certain quantile (load value) is selected as the threshold value, e.g., 98%. This method determines the discharge threshold based on discharge time. For example, with 98% quantile as the threshold value, the time required to discharge the battery to meet the peak load is 2% (the battery is required to discharge only when the real-time load exceeds the quantile point). With the discharge threshold value is determined, the total amount of power required to be released from the battery will be projected, as will the capacity of the battery.
For large scale peak shaving, it is necessary to consider the scale effect. The scale effect of peak shaving means that the cost or benefit to each member is different when they cooperate compared to acting individually. Generally, cooperation leads to cost saving or benefit increase for each member (economy of scale). When they investigated the peak shaving effect of distributed battery storage in the United Kingdom, Pimm et al. (2018) found that the larger the size of the residential cooperative group, the smaller the average load peak for the users. Mair et al. (2021) had similar findings. Some problems are significant at small scales but are mitigated or even eliminated at large scales. Jankowiak et al. (2020) studied the role and benefits of battery storage for a single residential day’s load in Northern Ireland. The authors noticed short time but very high spike loads (generated when appliances are switched on), and real-time consumption fluctuation. In the large-scale case, these issues are no longer apparent for the following reasons. Firstly, the spike problem is attenuated due to the time differences and variability of each individual action. Secondly, the load profile for a large user group is relatively fixed and predictable.
Given economy of scale, different regions should coordinate in peak shaving. Regionally coordinated peak shaving means that the overall peak shaving demand and capacity demand are calculated with the aggregate net load curve, and then the management center deploys them to each region. Therefore, the direct calculating result under regional coordination is the overall peak shaving demand and capacity demand of multiple regions, and how to allocate them to each region is an important issue. Shapley value is one of the core concepts in cooperative game theory, which is the allocation of the alliance value (benefit or cost) to each member. The core idea of this method is to allocate according to the marginal contribution of each member, which is relatively fair.
To the best of our knowledge, there are few studies on allocation of peak shaving demand, let alone applying Shapley value for the issue. In other issues, there are examples of using Shapley value to allocate cost or revenue. Examples of using Shapley value for cost allocation can be seen in the following issues: allocating cost to two facilities of a combined operating system, which consists of a cogeneration plant (CCHP) and power-to-gas (P2G) (Yang et al., 2020); allocating heating costs to three chemical plants (Jin et al., 2018); and allocating peak shaving costs to cogeneration units (Hu and Hu, 2015). Examples on revenue allocation are as follows: allocating operating profit to multiple cooperating power sales companies (Acua et al., 2018); allocating the revenue to six hydro power plants in Lancang River (Shen et al., 2018); and allocating revenue to thermal power plants (CHP) and virtual power plants (VPP) (Fang et al., 2020).
In addition to cost and revenue, there are articles using Shapley value to allocate air pollutants or CO2 emissions. These articles cover the following issues: allocating carbon emissions to four key influencing factors of carbon emissions (e.g., population and economic output) to obtain the influence degree of each factor on carbon emissions (Yu et al., 2012); allocating carbon emission allowances in eight regions of China (Zhang et al., 2014; Chang et al., 2016); allocating CO2 emissions from refineries across all products (Pierru, 2007); and analyzing the inter-region cooperation in carbon emission reduction problem in China (Zeng et al., 2021).
In the process of applying Shapley value, it is necessary to consider the computation time. For the game of
Based on the above literature, this article may make theoretical contributions in the following aspects. Firstly, unlike the existing research focusing on peak shaving demand with a single small scope (such as a certain wind farm) (Zhang et al., 2011; Fan et al., 2020), this paper studies the demand in every province and area of China for the first time. Considering the differences in time and space, the paper analyzes the peak shaving demand in three scenarios of coordination. The research scope selected in this paper may provide a theoretical reference value for future research on peak shaving problems in other countries. Secondly, existing studies hardly systematically analyze the relationship among load, renewable energy, and various peak shaving power sources, but focus on one of them instead (Chen, 2020; Fan et al., 2020; Liu et al., 2020). This paper would fill the gap to an extent by comprehensively analyzing the constraint system of deep peak shaving and measuring the demand for start-stop peak shaving capacity as well as its sensitivity to deep peak shaving. This part of the research may provide a useful reference for the future discussion on more complex power peak shaving systems; Thirdly, most existing research focuses on the peak shaving demand of a single time interval. Although Pimm et al. (2018) mentioned load curves of different time intervals, they did not measure the peak shaving demand of different time intervals, but the peak shaving demand for a complete week and the capacity of the energy storage battery. This paper studies peak shaving demands of multiple time intervals, based on the following data sets: 24-h data of renewable energy power generation and 24-h data of typical load on workdays and holidays. Finally, learning from the research of other issues such as carbon emission allocation, the paper uses Shapley value in the peak shaving problem. With existing research, the paper establishes the simplified model of Shapley value, which may provide some extra references for the application of the method.
Before calculating capacity demand of gas-fired peak shaving power generation (demand for power capacity. The power, generated in gas-fired plants, is used for peak shaving) in China, it is necessary to study the total peak shaving demand of China’s power system. Focusing on these two demands, the main framework of the following research is shown in Figure 1.
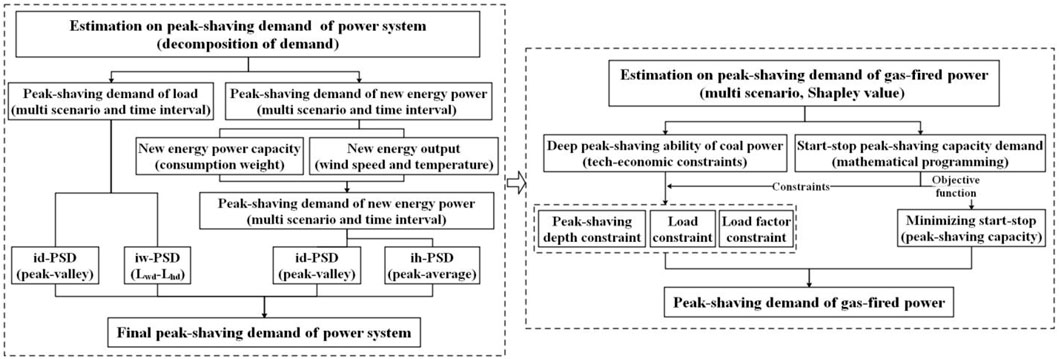
FIGURE 1. The main frame of the research in this paper. Texts in parentheses show the research methods corresponding to the content above; “consumption weight” represents required proportion of renewable energy power consumption to total power consumption in each region; “id-PSD”, “iw-PSD”, “ih-PSD” respectively refers to intra-day peak shaving demand, intra-week peak shaving demand, intra-hour peak shaving demand; “Lwd-Lhd” means max load on weekdays minus that on holidays; More details are described below.
Power peak shaving refers to the power dispatching behavior of peak shaving power that reduces output at low-load time, and increases power supply when a load peaks. Since the total design capacity of the peak shaving system is determined by the maximum load, the maximum output of the system is relatively fixed. The demand for peak shaving is mainly expressed as the demand for the peak shaving units to reduce the power output level. With renewable energy connected to a grid, peak shaving power units have to cope with both the load fluctuation and renewable energy generation randomness. Therefore, the final peak shaving demand (F-PSD) can be simplified as follows.
Due to the difference between load fluctuations and renewable energy fluctuations, the “+” in Eq. 1 is not a simple addition, but mainly means the decomposition of peak shaving demand. The following section will first analyze the peak shaving demand of load (L-PSD) and renewable energy power generation (REP-PSD) separately, and then study the final peak shaving demand (F-PSD). The significance of simplifying the F-PSD is to clarify the main source of the final demand, which will help with search for corresponding peak shaving countermeasures. To stabilize power grid operation, if the peak shaving demand mainly comes from load fluctuation, then the peak shaving power may be mainly distributed to the areas with large load fluctuations, and vice versa. For China, renewable energy powers are mainly distributed in the west, with the power load in the east, thus the above discussion is meaningful. If the two peak shaving demands are similar, it is beneficial to coordinate them, that is, the F-PSD based on the net load may be significantly less than the sum of the two peak shaving demands considered separately.
The load curves of China’s provinces share the following characteristics. Firstly, periodicity. Within a day, the load curves generally have two peak periods: day peak and night peak. Secondly, volatility. The load curves fluctuate randomly from hour to hour and even from minute to minute. Thirdly, diversity. Diversity includes spatial diversity and temporal diversity. Spatial diversity means that load curve differs among regions. Time diversity can be further divided into two categories, namely time zone divergence and workday-holiday divergence. Due to the vast size of China, different regions are located in different time zones so that there is divergence of local times at the same global time. Obviously, time zone divergence is distinguished from spatial diversity. Load curve on workdays is higher than that on holidays. The workday-holiday divergence refers to the difference between the two load curves. The five provinces with the largest workday-holiday divergence are Zhejiang (Average value of load curve on workdays is larger than that on holidays by 100%. The values in following parentheses are similar), Shanghai (96%), Chongqing (92%), Guangdong (88%), and Jiangsu (81%). The specific load curves for each region can be found in the annex of “Notice on the Signing of Medium- and Long-term Electricity Contracts in 2021" (Development and Reform Operation No. 1784 (2020), in Chinese) of National Energy Administration of China.
According to the above characteristics of load curves and gas-fired power units, load peak shaving can be cataloged into intra-hour peak shaving, intra-day peak shaving, intra-week peak shaving, and so on. Due to data accessibility, only intra-day and intra-week peak shaving demand of loads (referred to as id-PSD and iw-PSD) are analyzed in the paper. As for seasonal peak shaving, other technologies are more applicable than expensive gas power.
id-PSD equates to the peak-valley difference of load in a 24-h interval. Coordination of peak shaving between regions will affect the overall peak shaving demand of China. iw-PSD equates to the difference in maximum loads between workdays and holidays (weekdays and weekends). Three scenarios of peak shaving coordination are considered in the paper, i.e., independent peak shaving in each province (referred to as “Scenario 1”), areal coordinated peak shaving (“Scenario 2”), and national coordinated peak shaving (“Scenario 3”). The setting of the three scenarios is mainly based on the following two facts. Firstly, China’s Energy Administration has two sub levels: areal level and provincial level. Secondly, China’s power trading market is generally divided into provincial market and regional market. Independent peak shaving by province means that each provincial load curve (see Supplementary Table SA1 and Supplementary Table SA2 in Appendix A) is an independent and complete peak shaving object, with no coordination between different provinces. Areal coordinated peak shaving means peak shaving for the cumulative load curve of each province in the same area (see Supplementary Table SA3 and Supplementary Table SA4). National coordinated peak shaving means peak shaving for the cumulative load curve of all areas (and thus all provinces) in the country (see “total” indicators in Supplementary Table SA3 and Supplementary Table SA4). As the degree of coordination increases (from Scenario 1 to 3), the overall national peak shaving demand decreases significantly.
Should load not be considered, the peak shaving demand of renewable energy generation (REP-PSD) would be the difference between its maximum output (capacity) and its minimum output. Similar to the previous load peak shaving demand, REP-PSD comprises intra-day and intra-hour peak shaving demand (referred to as id-PSD and ih-PSD, respectively). id-PSD equates to the peak-valley difference in power output between different hours. For example, if the renewable energy output reaches its maximum value at 12:00∼12:59 (assuming the average output of 10 MW during this hour) and its minimum value at 20:00∼20:59 (assuming the average output of 1 MW), then the id-PSD is 10−1 = 9 MW. ih-PSD equates to the maximum positive deviation of renewable energy output within each hour, i.e., the difference between the maximum output and the average output of each hour. For example, for 12 o’clock (12:00∼12:59), the average output is 10 MW and the maximum output is reached at 12:30 (assumed to be 10.5 MW). Then the ih-PSD of 12 o’clock is 10.5−10 = 0.5 MW. Obviously, id-PSD and ih-PSD are additive.
In conclusion, REP-PSD is calculated by the following steps: Firstly, calculate the capacity of renewable energy generation; Secondly, calculate the hourly output coefficient (percentage of capacity) of renewable energy generating units; Finally, calculate the REP-PSD including id-PSD and ih-PSD.
Due to scarcity, energy should be supplied based on demand. Therefore, renewable energy capacity should not be directly taken as the current capacity data, but needs to be calculated based on renewable energy consumption. For ecological construction, the central government of China formulates the required renewable energy power consumption (proportion of total power consumption) of each region every year, which grows year by year. In order to distinguish it from the current generation and capacity, the required consumption-based generation and capacity of renewable energy power are defined as the required generation and capacity of renewable energy generation (respectively referred to as RG and RC hereinafter). Energy demand includes local demand and external demand (from other regions), which are complementary. Based on the required consumption of renewable energy and connection between regions, the required generation (RG) and the required capacity (RC) of renewable energy power in each region are calculated as shown in Eqss 2 to 4.
For regions with export power and no import power, RG (corresponding to
In Equation (2),
For regions with import power, RG (corresponding to
In Equation (3),
For all types of areas, the required renewable energy generation capacity (RC) is calculated as in Equation (4).
In Equation (4),
For any variable of Eqss 2 to 4, all types of power are included unless it is explicitly specified for renewable energy. For example,
Data on power generation and consumption of provinces were obtained from National Bureau of Statistics of China, and data on the weight of renewable energy power consumption were obtained from National Energy Administration of China (National Development and Reform Commission, 2020). Due to the lack of power trading data between provinces, this paper estimates it through the power trading between areas (China Electricity Union, 2019) and the geographical distance between provinces (see Supplementary Appendix SB for the estimation process and results). The utilization hours of wind and PV power in each province were obtained from reports on power construction and operation released by National Energy Administration of China.
Lacking detailed data on the hourly output of renewable energy generation in each province, this paper uses the impacting factor of renewable energy generation to estimate it. The renewable energy output is equal to the product of renewable energy capacity and renewable energy output coefficient, where the latter is the standardized value of its impacting factor (the maximum value is 1, and it is a positive indicator). The impacting factor curve (unstandardized) used for renewable energy output coefficient is referred to as the coefficient curve.
The coefficient curve has both a trend and fluctuation nature. For this reason, the hourly values can be divided into two parts, i.e., trend value and fluctuation value. In the coefficient curve, value on the (estimated) trend line is trend value of each hour, while the part of the actual value above the trend value (positive deviation) is the fluctuation value. Considering randomness, the fluctuation rate (ratio of fluctuation value to max trend value) should be uniform for 24 h, although the rate calculated for each hour may vary. For example, if only 3 hours are considered, and the fluctuation rates measured based on actual data are 10, 20, and 30%, then the fluctuation rate for each hour is unified to 30% to better describe the peak shaving demand within any hour. For the best fitting of the trend line, this paper uses Taylor series in Excel, in other words, polynomial function.
For the coefficient curve of wind power output, the hourly data of wind force (see Supplementary Table SC1) is used. This data is taken from China Meteorological Administration (which publishes the data of the last few days every day) and covers 24-h wind force (corresponding to the indicator “2-min average wind speed”) of each province on 24 July 2021. Based on this data, the trend value and fluctuation value of coefficient curve can be calculated. For coefficient curve of PV with obvious distribution characteristics (Li, 2020), the trend value is simulated according to the normal distribution. To calculate fluctuation values of PV coefficient curve, the hourly temperature data published by China Meteorological Administration is used (see Supplementary Table SC2).
The trend value of the coefficient curve is standardized to be the hourly average output coefficient of the renewable energy. The standardization of trend value is to divide the trend value for each hour by the largest trend value. The (uniform) fluctuation rate is used as the intra-hour fluctuation coefficient of renewable energy output. Based on the two coefficients above, the renewable energy generation output curve for each province consists of the following two components. Firstly, hourly average output, which is obtained by multiplying the required renewable energy generation capacity (RC) and the hourly average output coefficient. Secondly, intra-hour fluctuation, which is obtained by multiplying RC and the intra-hour fluctuation coefficient. In an areal coordination scenario (Scenario 2), the renewable energy output curve of each area is calculated as follows. Firstly, wind power output curve of each area is obtained by accumulating that of all provinces in the area. After that, trend value and fluctuation rate of the curve can be calculated to obtain the hourly average output and intra-hour fluctuation. Secondly, for PV output, the areal hourly average output is obtained by accumulating the hourly average output of all province in the area; the fluctuation rate is calculated by the areal average temperature curve, which is then multiplied by the maximum hourly average output to obtain intra-hour fluctuation. Thirdly, the hourly average output of different energies (wind and solar) is summed to obtain the hourly average output of renewable energies (wind and solar) as a whole. The overall intra-hour fluctuation of renewable energies is obtained in a similar way. For the renewable energy output curve of the whole country under a national coordination scenario (Scenario 3), the hourly average output of the whole country is obtained by summing up the hourly average outputs of all seven areas; the fluctuation rate is taken as the average value of that of all seven areas. The intra-hour fluctuation of renewable energy output is obtained by multiplying the max value of hourly average output and the fluctuation rate. Different output components correspond to different time intervals of peak shaving demand (see below).
3.1.2.3 Calculation of Peak Shaving Demand of Renewable Energy Power (REP-PSD).
Based on the calculation results of renewable energy output, and with the load unconsidered here, REP-PSD is calculated as follows. The peak-valley difference of hourly average output is the intra-day peak shaving demand (id-PSD), while the intra-hour fluctuation is the intra-hour peak shaving demand (ih-PSD). The sum of id-PSD and ih-PSD is the total REP-PSD.
Based on the above analysis, F-PSD can be calculated. Due to advantages of coordinated peak shaving, the paper only calculates the F-PSD of each area (not province) in Scenario 2 and 3. Since coordination means simultaneous action, the hourly data of load and renewable energy output involved is adjusted according to the time zone used before (with Xinjiang time as base time). The calculation steps of F-PSD are narrated as follows.
1) Calculate the load. The load is divided into two types: load on workdays and load on holidays. The loads of each province (corresponding to Scenario 1) are accumulated to generate the areal coordinated loads of seven areas (corresponding to Scenario 2), which are then accumulated to form the national coordinated load (corresponding to Scenario 3).
2) Calculate the renewable energy power output. It includes the hourly average output and intra-hour fluctuation, as described in Subsection 3.1.2.
3) Calculate the backup power output (i.e., net load in some articles). The backup power is conventional generating units other than renewable energy (it has the priority to connect to the grid). Backup power output includes average output and fluctuating output. The average hourly output of backup power is equal to the difference between the hourly load and the average hourly output of renewable energy. Fluctuating output includes fluctuations on different time intervals: intra-week fluctuation (from load) and intra-hour fluctuation (from renewable energy). The areal and national average hourly output curves are obtained directly by adding up the average output curves of each province. The intra-week fluctuation and intra-hour fluctuation are described in the previous section (see Subsection 3.1.1 and 3.1.2).
4) Calculate the final peak shaving demand (F-PSD). Through the previous analysis, the F-PSD includes intra-week peak shaving demand (iw-PSD), intra-day peak shaving demand (id-PSD), intra-hour peak shaving demand (ih-PSD), and operating reserve capacity (peak shaving demand at any time), which are additive. iw-PSD comes from load curves (see Subsection 3.1.1 for details). ih-PSD comes from renewable power output curves (see Subsection 3.1.2 for details). id-PSD is equal to the peak-valley difference of average output of backup power (calculated in step 3). The operating reserve capacity is the product of maximum load and the reserve rate (8%) (Li, 2020).
In the national coordination scenario (Scenario 3), the direct calculation result based on the national backup power output curve is the total peak shaving demand of the country, which needs to be allocated to each area. For different peak shaving demands, the allocation method is different. For id-PSD, considering the different roles of each area in the national coordinated peak shaving demand, this paper adopts Shapley value to allocate the national coordinated peak shaving demand to each area. The traditional Shapley value requires discussion of all possible area alliances, with seven areas corresponding to as many as
Bases on economy analysis, peak shaving priority is given to deep peak shaving of coal power, so that the start-stop peak shaving demand (SS-PSD) is equal to the final peak shaving demand (F-PSD) minus the deep peak shaving demand (D-PSD). D-PSD is subject to the following constraints. Firstly, peak shaving depth constraint. For deep peak shaving, there is a maximum peak shaving depth. In other words, there is a lower bound of D-PSD given a certain F-PSD, denoted as “lower capacity bound under depth constraint”; Secondly, load constraint. Since deep peak shaving units operate continuously, their capacity cannot be lower than the peak of the corresponding load curve (i.e., the above backup power curve), denoted as “lower capacity bound under load constraint”; Thirdly, load factor constraint. For economic efficiency, the operation of deep peak shaving units must meet a certain minimum average load factor, so there is a maximum capacity of the units given a certain load curve, denoted as “upper capacity bound under load factor constraint”. Given the load curve, the above three capacity bounds of deep peak shaving units are determined by the capacity of start-stop units, which are able to shave peak of the backup power curve to an extent. In other words, the above capacity constraints need to be satisfied when deciding the start-stop capacity (SS-PSD). There are possibly many start-stop capacities that satisfy the above constraint, among which the smallest one should be taken due to natural gas resource limitations. Therefore, the following Mathematical Programming set (see Supplementary Appendix SB for the calculation process) is used to determine the SS-PSD. Firstly, the objective function is to minimize the SS-PSD, where the start-stop units include intra-day start-stop units (units that operate during peak hours and shut down during valley hours within a day) and intra-week start-stop units (units that operate on workdays and shut down on holidays); Secondly, the constraints are the above three constraints. Using the above programming model, the SS-PSD of each area in Scenario 2 and the national capacity in Scenario 3 are obtained. In Scenario 3, the total national capacity needs to be allocated to each area according to certain rules. Similar to the previous peak shaving demand allocation, this paper uses Shapley value as the allocation rule (see Supplementary Appendix SD) to meet the fairness requirement.
To calculate SS-PSD, the parameters related to deep peak shaving units (thus related to SS-PSD) are set as follows: Firstly, the peak shaving depth is assumed to be 70% (i.e., the minimum operating load is 30%); Secondly, based on existing coal power units (Wang et al., 2019), the minimum economic average load factors of deep peak shaving units in each area are listed as follows: North China (70.45%), Northeast China (59.26%), East China (71.75%), Central China (72.03%), South China (52.82%), Southwest China (63.17%), and Northwest China (69.05%).
The above parameters related to deep peak shaving units are the current (baseline) values. To take information uncertainty and future technology update into account, sensitivity analysis is required. Considering the benefits of regional coordination, the paper analyzes the sensitivity of national SS-PSD to deep peak shaving ability of deep peak shaving units in Scenario 3, and the detailed steps are given as follows: Firstly, calculate the change of national SS-PSD after deep peak shaving ability decreases by 20% (both minimum load and minimum average load factor increase by 20%); Secondly, calculate the change of national SS-PSD after deep peak shaving ability increases by 20% (both minimum load and minimum average load factor decrease by 20%).
According to the load curves on workdays (Supplementary Table SA1 and Supplementary Table SA3), in Scenario 1∼3, the national intra-day peak shaving demands (id-PSD) are 246 × 1000 MW, 230 × 1000 MW, and 219 × 1000 MW, respectively. According to the load curves on holidays (Supplementary Table SA2 and Supplementary Table SA4), in the above three scenarios, the national id-PSDs are 166 × 1000 MW, 155 × 1000 MW, and 143 × 1000 MW, respectively. Compared with Scenario 1, in Scenario 2, the load peak shaving demands on workdays and holidays are reduced by 2.35%∼13.6 and 0.01%∼2.21%, respectively, where the reduction rate varies in different areas. Compared with Scenario 1, in Scenario 3, the national id-PSD on workdays and holidays are reduced by 27 × 1000 MW and 23 × 1000 MW, or by 11 and 14%, respectively. 27 × 1000 MW exceeds the average load on workdays in 22 provinces, and 23 × 1000 MW exceeds the average load on holidays in 24 provinces. The results show huge economic benefit brought by national coordination.
According to the relevant data (Supplementary Tables SA1–SA4), the national intra-week peak shaving demands (iw-PSD) on holidays in the three scenarios are 272 × 1000 MW, 269.2 × 1000 MW, and 268.8 × 1000 MW. It can be seen that the iw-PSD has also been reduced by regional coordination. The max load on workdays in each province is greater than that on holidays, so there is no iw-PSD on workdays.
Given that there is no iw-PSD on workdays, the id-PSD is also the total load peak shaving demand (L-PSD) on workdays. The total L-PSD on holidays is the sum of the id-PSD and the iw-PSD. Under the three scenarios, the national L-PSDs on holidays are 438 × 1000 MW, 424.2 × 1000 MW, and 411.8 × 1000 MW, respectively. In the end, the total L-PSD shall be the larger one between L-PSD on workdays and that on holidays. In Scenario 3, the total L-PSDs in East and South China are significantly higher than that in other areas of China, accounting for 44 and 18% of the country’s total demand respectively.
Table 2 shows the calculation results of the required capacity of renewable energy power (RC) of each province in China. The capacity is taken as the larger between the estimated value (Eqs 2-4) and actual value (2019).
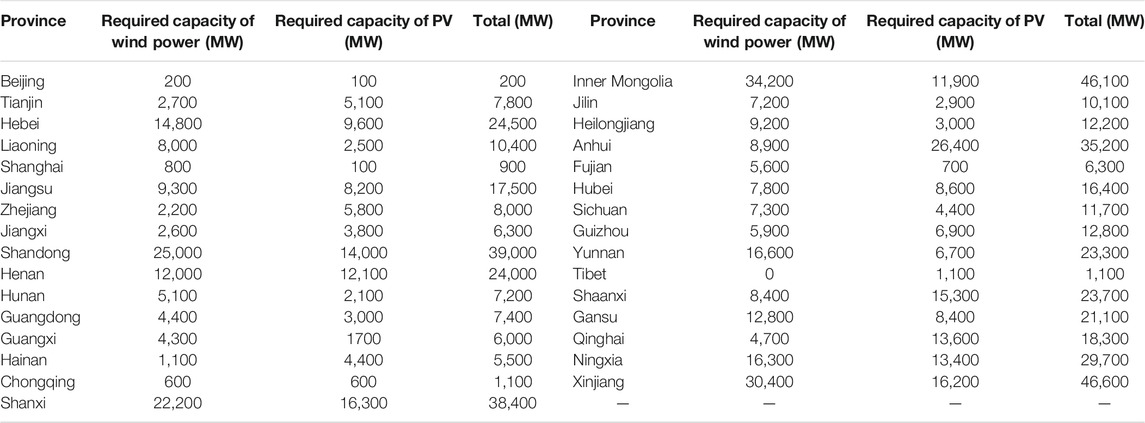
TABLE 2. Required capacity of renewable energy power (RC).
Table 3 shows the calculation results of peak shaving demand of renewable energy power (REP-PSD) in each area in Scenario 1 and 2. Due to the time and spatial difference of renewable energy output, the REP-PSD in each area in Scenario 2 is smaller than that in Scenario 1. According to Table 3, regardless of area, the REP-PSD in Scenario 2 is reduced by more than 100% compared to Scenario 1. In other words, the REP-PSD in Scenario 1 is more than twice that in Scenario 2. In Scenario 3, the national REP-PSD is 349.6 × 1000 MW, with further decreases compared to that in Scenario 2.
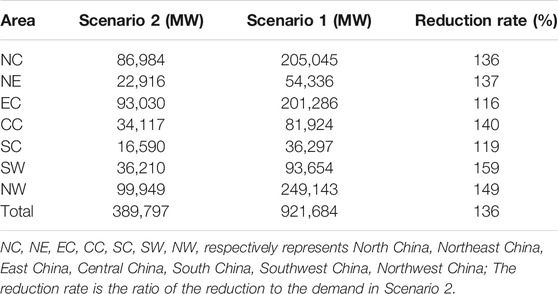
TABLE 3. Demand for peak shaving of renewable energy power (REP-PSD).
In Scenario 3, the national L-PSD and REP-PSD are 411.8 × 1000 MW and 349.6 × 1000 MW, respectively. The above two peak shaving demands are not very different, which means that the they deserve similar degrees of attention, and that there may be economy of scope if they are considered in coordination as shown in the following paragraphs.
It is calculated that the hourly average output of backup power in North China and Northwest China has negative values in some periods, representing renewable energy output exceeding the load in the areas. If there is no coordination (Scenario 2) between areas (e.g., North and Central China), then a negative hourly output of backup power means that renewable energy power that exceeds the load must be abandoned (the abandoned amount is calculated to be 110,766 MWh), and the peak shaving demand is the entire load. If there is coordination between areas (Scenario 3), then the renewable energy power that exceeds the load can be fully absorbed, reducing the amount of renewable energy abandonment and the areal peak shaving demand.
Table 4 shows the calculation results of final peak shaving demand (F-PSD). According to Table 4, the following further results can be obtained. Firstly, the F-PSD in Scenario 3 is less than that in Scenario 2, especially the F-PSD on workdays (the reduction rate reaches 7.21%). Compared with Scenario 2, the F-PSD on workdays in North China in Scenario 3 has the largest decrease rate, reaching about 14%. Secondly, the load on holidays in each area is lower than that on workdays, so the former has intra-week peak shaving demand, while the latter does not. Thirdly, East China has the highest F-PSD, followed by North China, and Northeast China has the lowest demand. The highest F-PSD in East China stems from the highest load and renewable energy capacity. The high F-PSD in North China is mainly due to high renewable energy capacity (mainly from Inner Mongolia). The lowest F-PSD in Northeast China is due to the lowest load.
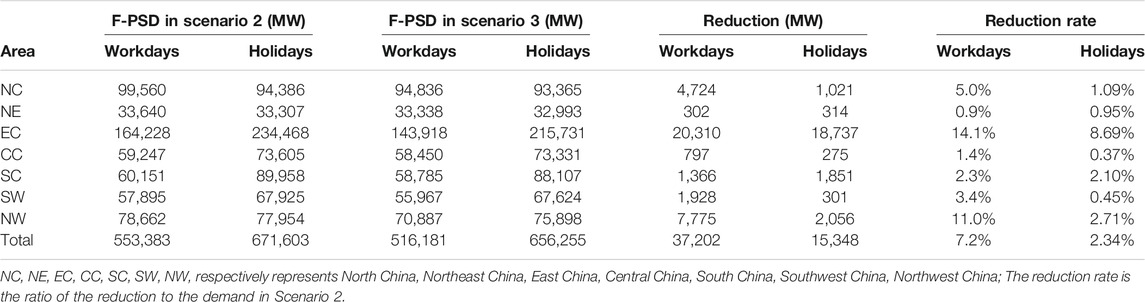
TABLE 4. Final peak shaving demand (F-PSD) in various areas in China.
According to Table 4, in Scenario 3, the national F-PSD is 656.3 × 1000 MW, which is the peak shaving demand when the load and renewable energy are considered in coordination. According to the previous results (the last paragraph of Subsection 4.1.2), the sum of the national L-PSD and the REP-PSD is 761.4 × 1000 MW, which is the peak shaving demand when the load and renewable energy are considered independently. The above two demands are significantly different. Thus, the coordinated consideration of load and renewable energy has economy of scope. The findings here would be of reference significance for peak shaving resource planning and investment decision-making.
Even in Scenario 2 and Scenario 3, the start-stop peak shaving capacity (SS-PSC) of 0 is not a feasible solution. In other words, when the SS-PSC is 0, no deep peak shaving capacity (D-PSC) value can meet its three constraints (See section 3.2) at the same time. Therefore, in order to support the development of renewable energy, SS-PSC is inevitable. The calculation results of SS-PSC of each area in Scenario 2 and Scenario 3 are shown in Table 5. According to Table 5, compared with Scenario 2, the total SS-PSC in Scenario 3 is greatly reduced, the intra-day SS-PSC is sharply reduced to 0 MW, and the intra-week SS-PSC is slightly increased. Overall, nearly half (375,838-255,126 = 120,712 MW) of the SS-PSC investment has been avoided through national coordination. In Scenario 3, China’s total demand for SS-PSC is 255,126 MW, accounting for about 11.6% of the total installed power generation capacity in China. The three areas with the largest demand for SS-PSC are East China (EC), North China (NC) and Northwest China (NW). Figure 2A intuitively shows the comparison of SS-PSC between areas.
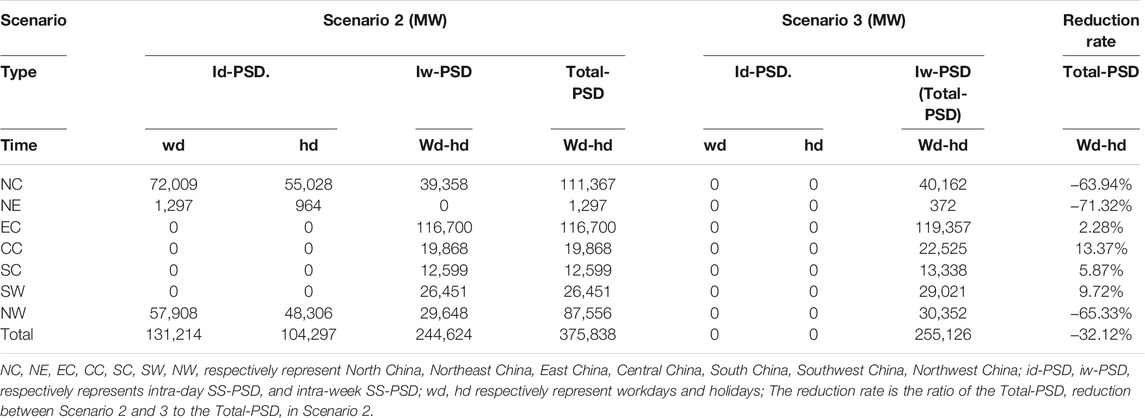
TABLE 5. | Start-stop peak shaving capacity demand (SS-PSD) in each region.
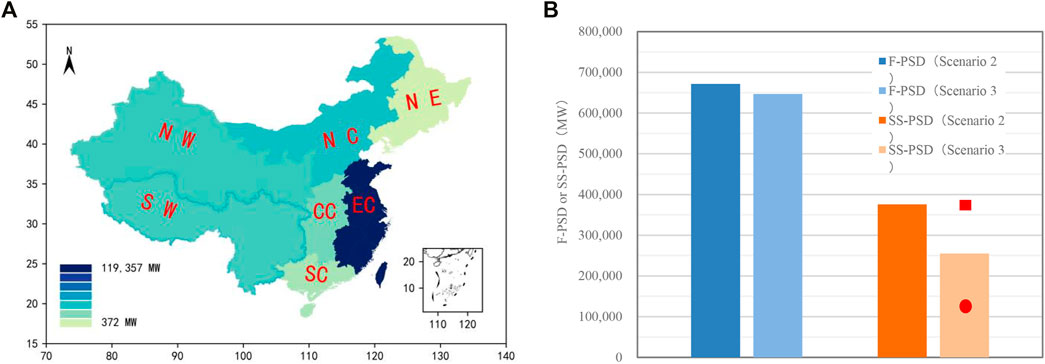
FIGURE 2. Distribution of gas peak shaving capacity demand in areas in Scenario 3 (A) and National peak shaving demand (F-PSD) and capacity demand (SS-PSD) under Scenario 2 and 3 (B). For the sake of simplicity, some islands are not drawn in the (A). The darker color in the figure means the greater demand for peak shaving capacity in the area. In the (B), the small red rectangles and circles represent the sensitivity analysis results of capacity demand on deep peak shaving capacity. The small rectangle represents the capacity demand (SS-PSD) when the deep peak shaving ability (D-PSA) decreases by 20% (Scenario 3). The small circle represents the SS-PSD when the D-PSA increases by 20% (Scenario 3).
Based on the allocation of SS-PSC according to Shapley value (fairness principle), it is also necessary to consider the efficiency of building SS-PSC. In other words, it should be constructed according to the efficiency principle, i.e., “who has lower cost, who builds more”. According to the efficiency principle, the areal distribution of SS-PSC may not be consistent with that of the fairness principle, but this does not deny the necessity of the latter. This is because the allocation of SS-PSC under the fairness principle represents the responsibilities and rights of each region. When the economy of SS-PSC is poor, no area is willing to invest in construction under the efficiency principle. At this time, allocating mandatory construction indicators to each region according to the fairness principle is the premise of promoting the SS-PSC construction. At present, gas-fired power plants are mainly Combined Heat and Power plant (CHP), and there are few start-stop peak shaving power plants. Under the pressure of carbon neutralization and renewable energy power utilization, the construction of gas-fired peak shaving power plants is urgent. The current paid auxiliary power market in China is only for the operation of existing units, not for the allocation of SS-PSC among areas. Therefore, the results of SS-PSC allocation based on the above fairness principle has practical guiding significance.
As the living habits, industrial structure, and climate in each area are relatively stable, the load curves and renewable energy endowments remain relatively stable. Therefore, the allocation of SS-PSC in accordance with the fairness principle would not change significantly over time. Based on this, the allocation of SS-PSC can be clarified as early as possible in policy. SS-PSC allocation in fairness principle corresponds to the mandatory allocated indicators, and that in the efficiency principle corresponds to expected actual utilization of the indicators. The areas with high SS-PSC demand (East China, North China, and Northwest China) should be encouraged to take the lead in building areal trading market for SS-PSC. In this trading market, provinces owning allocated SS-PSC and failing to use them economic-efficiently should sell SS-PSC to provinces in the opposite situation. The nominal income of capacity sales may be either positive or negative. When a positive income can be obtained from start-stop peak shaving, the sales income is positive; otherwise, it is negative (corresponding to the cost of entrusting other provinces to build SS-PSC). Regardless of the nominal income, compared to self-built case, selling SS-PSC can increase the income or reduce the cost, which means the actual income is always positive. The final transaction price is formed spontaneously in the market. Since Scenario 3 can largely reduce the demand for SS-PSC, a national capacity trading market should be established on the basis of areal trading markets in the future.
In order to promote sufficient investment in flexible power generation, capacity market mechanism has been implemented by some countries (DECC, 2012; Hach and Spinler, 2016). It should be noted that the concept of the existing power capacity market is different from that in this paper. The former refers to the transaction of reserve power generation capacity between grid companies and power plants in order to stabilize power systems (Hou et al., 2015), while the latter refers to SS-PSC transactions between various regions.
Although better than other peak shaving technologies, the economy of gas-fired power generation are not yet satisfactory, especially for China. Firstly, it is difficult to guarantee gas supply. China is already the largest importer of natural gas, and its dependence on foreign gas in 2020 exceeded 43%. Thus, it is not easy to meet the demand for gas-fired power (Li and Bai, 2010). Secondly, carbon prices are not high enough. China’s national carbon market has just started to operate in 2021, and carbon prices will not be strong enough for a certain period in the future, which is not conducive to the development of gas-fired power (IEA, 2020c). Thirdly, China requires much more investment in gas turbines. As of 2020, China’s installed capacity of gas-fired power was 98,020 MW, which is about 40% of the estimated capacity demand (255,126 MW, Table 5) in this paper. In addition, China’s existing gas-fired power plants are mainly (if not totally) CCGT units, rather than OCGT. OCGT is more suitable for start-stop peak shaving. In order to fill the gap of SS-PSC, substantial investment in OCGT units is required in future. Due to low utilization rates, the leveling cost of OCGT is approximately 1.6 times that of CCGT (IEA, 2020d). The economy of gas-fired power plant investment will also be potentially challenged by many new peak shaving technologies.
Facing the challenge of economy of gas-fired power, China may need the idea of grading peak shaving demand. In peak shaving demand, there are always some parts more urgent and economical than other parts, which should be met first. Of course, when it comes to specific investment, a detailed tech-economic evaluation needs to be carried out first.
When the deep peak shaving ability of existing power units increases by 20%, China’s SS-PSC demand sharply drops to 102,659 MW (all of it is intra-week SS-PSC). Compared with the SS-PSC of the base case (255,126 MW), the drop rate is 60%, and the sensitivity coefficient is about 3. When the deep peak shaving ability of existing units drops by 20%, China’s SS-PSC demand rises to 348,619 MW (including 56,591 MW of intra-day SS-PSC), and the sensitivity coefficient is 1.83. Figure 2B visually shows the sensitivity analysis results. It can be seen that SS-PSC demand is very sensitive to deep peak shaving ability of existing units. Flexibility retrofit of existing units can greatly reduce the demand for SS-PSC, which is good news for China (and maybe some other countries), where the cost of natural gas utilization is relatively high.
Flexibility retrofit has been seen in Chinese government documents. China’s “13th Five-Year Plan for Electric Power Development” required that, during the 13th Five-Year Plan period (2015∼2020), the min capacity for flexibility retrofit of CHP and condensing units in three north areas (Northeast, North China, and Northwest) are about 133 × 1000 MW and 82 × 1000 MW respectively, and that the retrofit capacity of condensing units in other areas is about 4.5 × 1000 MW, so the total required retrofit capacity is about 220 × 1000 MW. Shanxi Energy Bureau (2020) required that by the end of 2020, the retrofit capacity of coal power units of each power generation company should not be less than the company’s renewable energy installed capacity.
However, flexibility retrofit of power plants was not progressing as expected. As of May 2019, coal-fired power generation units in the three north areas have only completed 24% of the goals of the “13th Five-Year Plan for Electric Power Development” (China Electricity Council, 2019). Among the 22 pilot projects, Northeast and North China completed 80 and 25% respectively. Northwest China completed less. Northeast China introduced ancillary service compensation policies in 2016 with reasonable compensation, which accounts for high retrofit motivation of local plants. For most areas of China, insufficient economic compensation for peak shaving is an important reason for the low completion degree of flexibility retrofit (China Electricity Council, 2019). In 2018, China’s ancillary service compensation fee accounted for 0.83% of the total on-grid electricity fee, which is much lower than 2.5% in US PJM market and 8% in the United Kingdom. In addition, a lack of enthusiasm for flexible transformation in most parts of China may also be resulted from the fact that the past investment of some units has not been fully recovered. Compared with coal-fired power plants in developed countries, China’s coal-fired power plants have shorter operating times. Coupled with the previous environmental protection retrofit, some units in China may need more time to recover their investment.
In terms of peak shaving compensation, it may not be the best strategy for each province to formulate compensation policies independently, especially for the situation that there is a large amount of power export in the three northern areas. Considering the economy of scale effect brought by regional coordination, formulating compensation policy coordinately for deep peak shaving may be better, as in Scenario 3. The details are given as follows. The overall demand for deep peak shaving is supposed to be determined from the perspective of national coordination. With the above overall demand, some reasonable rules (such as Shapley value) are used to allocate the peak shaving demand of each region. After that, the market determines the actual implementation of deep peak shaving and flexibility retrofit of power plants.
In terms of investment recovery, it may be reasonable to allocate more responsibility of flexibility retrofit to those coal-fired and renewable energy units that have recovered all (or the majority of) their investment. In other words, the new and old units should be coordinated.
Faced with the requirements of carbon neutralization and the rapid development of renewable energy, it is more and more important to develop gas-fired power for peak shaving in China. However, the development of gas power in China is relatively slow. There are few existing studies on the peak shaving systems of large-scale spatial scopes and multi-time intervals. At the same time, some articles pointed out the economy of scale and the concept of different time intervals for peak shaving. Against this background, from the perspective of regional coordination and multi-time interval, this paper applies Taylor series, Mathematical Programming, and Shapley value to study the peak shaving demand of the power system and peak shaving capacity demand of gas-fired power in China. The main conclusions of the paper are as follows.
Regional coordination can greatly reduce the demand for peak shaving and the abandonment of renewable energy power generation. Firstly, compared with the scenario of independent peak shaving in each province (Scenario 1), the load peak shaving demand on workdays and holidays under the areal coordination scenario (Scenario 2) are reduced by 2.35%∼13.6 and 0.01%∼2.21%, respectively, where the reduction rates differ among areas. Secondly, compared with Scenario 1, the peak shaving demand of renewable energy power generation in each area is greatly reduced in Scenario 2, with reduction rates of 116%∼159%. Thirdly, coordination between provinces of the same area (Scenario 2) is not enough, since 110,766 MWh of renewable energy power would be abandoned in North China and Northwest China in the scenario. National coordinated peak shaving (Scenario 3) can completely avoid the above-mentioned abandonment of renewable energy power. Compared with Scenario 2, the final peak shaving demands on workdays and holidays in Scenario 3 are reduced by 0.91%∼14.11 and 0.37%∼8.69%, respectively.
Regional coordination (Scenario 2 or 3) fails to completely eliminate the demand for gas-fired power peak shaving, but is able to reduce it to a large extent. In any scenario, the pure deep peak shaving mode without start-stop peak shaving cannot meet the following constraints at the same time, namely peak shaving depth constraint, load constraint, and load factor constraint. Compared with areal coordination (Scenario 2), the national coordination (Scenario 3) avoids 100% (131,214 MW) of intra-day start-stop peak shaving capacity demand (SS-PSC) with minor increase of intra-week SS-PSC demand (4.29%, 10,502 MW).
Through flexibility retrofit of existing units, the demand for SS-PSC can be further reduced significantly.
Based on the previous analysis, the paper presents some policy recommendations as follows. Firstly, it is necessary to establish areal coordination and national coordination mechanisms for power peak shaving. Secondly, with the good stability of SS-PSC allocation under the fairness principle, SS-PSC allocation needs to be clarified as soon as possible in policy. This will help to promote the implementation of start-stop peak shaving responsibilities in regions, and preparation for the large-scale investment and construction of SS-PSC in the future. Thirdly, with large peak shaving demand, the three areas, including East China, Central China, and North China, are supposed to establish areal capacity trading markets. Fourthly, given the economy uncertainty, it is necessary to give priority to meeting the peak shaving demand with most urgency and economic-efficiency. Finally, in order to promote the flexibility retrofit of existing power units, both regional coordination mechanisms and coordination mechanisms between new and old units should be established.
However, there are some shortcomings in this paper, and further research is needed. Firstly, the renewable energy capacity in this paper is for the short-term future, and the medium-term or even long-term renewable energy capacity needs to be predicted in following research. Secondly, this paper ignores demand-side response or interruptible load, assuming that all loads need to be met. Load interruption as a way of peak shaving also requires costs (similar to peak shaving costs). Nonetheless, as technologies such as virtual power plants mature in the future, load interruption costs and peak shaving costs need to be compared and analyzed before calculating peak shaving demand.
The original contributions presented in the study are included in the article/Supplementary Material, further inquiries can be directed to the corresponding author.
SZ and YW proposed the initial vision, outlined the research framework, and wrote the manuscript. XZ, XD, and DL provided guidance on methods and expression. Everyone collaborated in discussing and polishing the manuscript.
This article is supported by the following fund projects: National Science and Technology Major Project “Research on the Optimization of Coalbed Methane Efficient Development and Development Indexes” (2016ZX05042-002-004); National Natural Science Foundation of China, “Research on Fossil Energy Production Subsidy Exit Mechanism under Carbon Emission Constraints” (71804187); Beijing Social Science Fund, Beijing-Tianjin-Hebei Natural Gas Stable Supply Capability Evaluation and Countermeasures Research under the Background of “Coal to Gas” (19GLC045); and CNPC Exploration Institute “Central Asia-Russia Region Oil and Gas Cooperation Development Strategy and Technology R&D Direction” project (2019D-4415).
The authors declare that the research was conducted in the absence of any commercial or financial relationships that could be construed as a potential conflict of interest.
All claims expressed in this article are solely those of the authors and do not necessarily represent those of their affiliated organizations, or those of the publisher, the editors and the reviewers. Any product that may be evaluated in this article, or claim that may be made by its manufacturer, is not guaranteed or endorsed by the publisher.
We sincerely thank all reviewers for their review and guidance of the paper. At the same time, we thank the editor for the final review and typesetting of the article.
The Supplementary Material for this article can be found online at: https://www.frontiersin.org/articles/10.3389/fenrg.2022.817767/full#supplementary-material
D-PSD, deep peak shaving demand; F-PSD, peak shaving demand; id-PSD, intra-day peak shaving demand (PSD between hours in a day); ih-PSD, intra-hour peak shaving demand (PSD between minutes in an hour); iw-PSD, intra-week peak shaving demand (PSD between workdays and holidays or weekends); PSC, deep peak shaving capacity; PSD, final peak shaving demand, including the following L-PSD and REP-PSD; PSD, PSD of load, including the following iw-PSD and id-PSD; RC, required consumption-based capacity of renewable energy power (subsection 3.1.2.1); REP-PSD, PSD of renewable energy power, including the following id-PSD and ih-PSD; RG, required consumption-based generation of renewable energy power (subsection 3.1.2.1); SS-PSC, start-stop peak shaving capacity; SS-PSD, start-stop peak shaving demand.
Acuña, L. G., Ríos, D. R., Arboleda, C. P., Ponzón, E. G., and Garcia, R. R. (2018). Cooperation Model in the Electricity Energy Market Using Bi-level Optimization and Shapley Value. Operations Res. Perspect. 5, 161–168. doi:10.1016/j.orp.2018.07.003
Agora, E. (2017). Flexibility in thermal Power Plants - with a Focus on Existing Coal-Fired Power Plants. Available at: https://www.agora-energiewende.de/fileadmin/Projekte/2017/Flexibility_in_thermal_plants/115_flexibility-report-WEB.pdf.
Azad-Farsani, E., Agah, S. M. M., Askarian-Abyaneh, H., Abedi, M., and Hosseinian, S. H. (2016). Stochastic Lmp (Locational Marginal Price) Calculation Method in Distribution Systems to Minimize Loss and Emission Based on Shapley Value and Two-point Estimate Method. Energy 107, 396–408. doi:10.1016/j.energy.2016.04.036
Banez-Chicharro, F., Olmos, L., Ramos, A., and Latorre, J. M. (2017). Estimating the Benefits of Transmission Expansion Projects: an Aumann-Shapley Approach. Energy 118, 1044–1054. doi:10.1016/j.energy.2016.10.135
Breeze, P. (2016). “An Introduction to Gas-Fired Power Generation,” in Gas-Turbine Power Generation. Editor P. Breeeze (Cambridge, Massachusetts, United States: Academic Press), 1–7. doi:10.1016/B978-0-12-804005-8.00001-X
Chang, K., Zhang, C., and Chang, H. (2016). Emissions Reduction Allocation and Economic Welfare Estimation through Interregional Emissions Trading in China: Evidence from Efficiency and Equity. Energy 113, 1125–1135. doi:10.1016/j.energy.2016.07.113
Chang, Y., Huang, R., Ries, R. J., and Masanet, E. (2015). Life-cycle Comparison of Greenhouse Gas Emissions and Water Consumption for Coal and Shale Gas Fired Power Generation in China. Energy 86, 335–343. doi:10.1016/j.energy.2015.04.034
Chen, X. (2020). Demand Analysis and Capacity Allocation of Peak Shaving and Frequency Modulation Power Supply in Regional Power Grid. Equipm. Techn. 02, 56. doi:10.16648/j.cnki.1005-2917.2020.02.050 [in Chinese]
China Electricity Council (2019). Research on Flexible Operation Policy of Coal Motor Unit. Available at: [in Chinese] https://cec.org.cn/detail/index.html?3-282218.
China Electricity Union (2019). Overview of the Operation of the Power Industry from January to October 2019. Available at: [in Chinese] https://cec.org.cn/detail/index.html?3-258809.
China Power Network (2021). China Gas Power Generation Report(2020). Available at: [in Chinese] http://mm.chinapower.com.cn/zx/zxbg/20210112/43967.html.
Cowell, R. (2020). The Role of Place in Energy Transitions: Siting Gas-Fired Power Stations and the Reproduction of High-Carbon Energy Systems. Geoforum 112, 73–84. doi:10.1016/j.geoforum.2020.03.009
DECC (2012). Energy Bill. Available at: http://www.publications.parliament.uk/pa/bills/cbill/2012- 2013/0100/130100.pdf.
East China Energy Supervision Bureau (2020). East China Power Grid Reserve Auxiliary Service Market Operation Rules (Draft for Solicitation of Comments). Available at: [in Chinese] http://hdj.nea.gov.cn/load.loadPage.d?newsid=1482513718&page=detail_index.xml&siteCode=hddjwucm&urlChannelId=1481001274&urlMenuId=1481001274.
Fan, K., Yang, C., Wang, P., and Ma, X. (2020). Study on Capacity Allocation for Gas-Fired Power Generation Units Based on High Penetration of Renewable Energy. Guangdong Electr. Power 33, 1–8. [in Chinese]. doi:10.3969/j.issn.1007-290X.2020.001.001
Fang, F., Yu, S., and Liu, M. (2020). An Improved Shapley Value-Based Profit Allocation Method for CHP-VPP. Energy 213, 118805. doi:10.1016/j.energy.2020.118805
Glensk, B., and Madlener, R. (2019). The Value of Enhanced Flexibility of Gas-Fired Power Plants: a Real Options Analysis. Appl. Energ. 251, 113125. doi:10.1016/j.apenergy.2019.04.121
Guo, H., Chen, Q., Xia, Q., and Kang, C. (2018). Market Equilibrium Analysis with High Penetration of Renewables and Gas-Fired Generation: an Empirical Case of the Beijing-Tianjin-Tangshan Power System. Appl. Energ. 227, 384–392. doi:10.1016/j.apenergy.2017.11.012
Hach, D., and Spinler, S. (2016). Capacity Payment Impact on Gas-Fired Generation Investments under Rising Renewable Feed-In - A Real Options Analysis. Energ. Econ. 53, 270–280. doi:10.1016/j.eneco.2014.04.022
Hou, F., Wang, X., Suo, T., Zhang, W., Yao, L., and Gong, B. (2015). Capacity Market Design in the United Kingdom and Revelation to China's Electricity Market Reform. Autom. Electr. Power Syst. 39, 8–14. doi:10.7500/AEPS20150322002 [in Chinese]
Hu, J., and Hu, L. (2015). Peaking Cost Allocation for Thermoelectric Unit via Improved Shapley Value. Proceed. Csu-epsa 027, 65–70. doi:10.3969/j.issn.1003-8930.2015.03.12 [in Chinese]
IEA (2020d). CCUS in Power. Available at: https://www.iea.org/reports/ccus-in-power.
IEA (2020a). Gas 2020. Available at: https://www.iea.org/reports/gas-2020.
IEA (2020c). Gas-Fired Power. Available at: https://www.iea.org/reports/natural-gas-fired-power.
IEA (2018). Outlook for Natural Gas. Available at: https://www.iea.org/reports/outlook-for-natural-gas.
IEA (2020b). Projected Costs of Generating Electricity 2020. Available at: https://www.iea.org/reports/projected-costs-of-generating-electricity-2020.
IEA (2019). The Role of Gas in Today' S Energy Transitions. Available at: https://www.iea.org/reports/the-role-of-gas-in-todays-energy-transitions.
Jankowiak, C., Zacharopoulos, A., Brandoni, C., Keatley, P., MacArtain, P., and Hewitt, N. (2020). Assessing the Benefits of Decentralised Residential Batteries for Load Peak Shaving. J. Energ. Storage 32, 101779. doi:10.1016/j.est.2020.101779
Jin, Y., Chang, C.-T., Li, S., and Jiang, D. (2018). On the Use of Risk-Based Shapley Values for Cost Sharing in Interplant Heat Integration Programs. Appl. Energ. 211, 904–920. doi:10.1016/j.apenergy.2017.11.097
Leadbetter, J., and Swan, L. (2012). Battery Storage System for Residential Electricity Peak Demand Shaving. Energy and Buildings 55, 685–692. doi:10.1016/j.enbuild.2012.09.035
Li, X. (2020). Characteristics of Renewable Energy Power Generation and Power Grid Peak Shaving Demand in Eastern Mongolia. Power & Energy 3, 279–285. doi:10.11973/dlyny202003001 [in Chinese]
Li, Y. (2021). A Power Grid Decarbonization Plan in the United States Excludes Natural Gas from Clean Energy, and a Glimpse of the Development Trend of Natural Gas in China. Available at: [in Chinese] https://view.inews.qq.com/a/20210911A06DYN00.
Li, Y., and Bai, F. (2010). A Policy Study Examining the Use of Imported Lng for Gas-Fired Power Generation on the Southeast Coast of China. Energy Policy 38, 896–901. doi:10.1016/j.enpol.2009.10.040
Liu, M., Zheng, H., Qin, L., Liu, S., Li, T., and Liang, J. (2020). Research on the Collaborative Scheme of Integrated Peak Shaving Resources Based on Generation-Grid-Load-Storage. Electr. Meas. Instrum. 06, 1–10. [in Chinese].
Mair, J., Suomalainen, K., Eyers, D. M., and Jack, M. W. (2021). Sizing Domestic Batteries for Load Smoothing and Peak Shaving Based on Real-World Demand Data. Energy and Buildings 247, 111109. doi:10.1016/j.enbuild.2021.111109
National Development and Reform Commission (2020). Notice on Issuing the Responsibility Weights of Renewable Energy Electricity Consumption in Provincial Administrative Regions in 2020 (Fagai Energy (2020) No. 767). Available at: [in Chinese] http://www.nea.gov.cn/2020-06/01/c_139105253.htm.
Oil Observer (2020). Zhu Xingshan: The Decisive Factor in the Development of Gas-Fired Power Is the National Environmental protection Policy. Available at: https://m.thepaper.cn/baijiahao_8447713. [in Chinese]
Pimm, A. J., Cockerill, T. T., and Taylor, P. G. (2018). The Potential for Peak Shaving on Low Voltage Distribution Networks Using Electricity Storage. J. Energ. Storage 16, 231–242. doi:10.1016/j.est.2018.02.002
Shanxi Energy Bureau (2020). Notice on Accelerating the Flexibility Transformation of Coal Motor Unit. Available at: [in Chinese] http://nyj.shanxi.gov.cn/gzdt/tzgggs/202004/t20200408_1422087.html.
Shen, J., Cheng, C., Zhang, X., and Zhou, B. (2018). Coordinated Operations of Multiple-Reservoir Cascaded Hydropower Plants with Cooperation Benefit Allocation. Energy 153, 509–518. doi:10.1016/j.energy.2018.04.056
Staple, G. C., and Bean, P. (2013). Post-election Prospects for Natural-Gas-Fired Generation. Electricity J. 26, 41–50. doi:10.1016/j.tej.2013.02.012
Tehrani Nejad Moghaddam, A. (2010). Allocating the CO2 Emissions of an Oil Refinery with Aumann-Shapley Prices: Comment. Energ. Econ. 32, 243–255. doi:10.1016/j.eneco.2009.09.010
Wang, C., Li, J., Zhang, B., Yin, J., Zhao, S., Hu, X., et al. (2019). Operating index Data Analysis and Energy Saving Potential Research of 0.6∼1.0GW Coal-Fired Power Units in China Based on Load Rate. Heilongjiang Electr. Power 41, 355–360. doi:10.13625/j.cnki.hljep.2019.04.015 [in Chinese]
Yang, X. (2021). Gas Receiving" Natural Gas Power Generation: as a Clean Energy, the Role Is Quite Embarrassing. Available at: [in Chinese] https://www.thepaper.cn/newsDetail_forward_13562021.
Yang, Y., Tang, L., Wang, Y., and Sun, W. (2020). Integrated Operation Optimization for Cchp Micro-grid Connected with Power-To-Gas Facility Considering Risk Management and Cost Allocation. Int. J. Electr. Power Energ. Syst. 123, 106319. doi:10.1016/j.ijepes.2020.106319
Yu, S., Wei, Y.-M., and Wang, K. (2014). Provincial Allocation of Carbon Emission Reduction Targets in China: an Approach Based on Improved Fuzzy Cluster and Shapley Value Decomposition. Energy Policy 66, 630–644. doi:10.1016/j.enpol.2013.11.025
Zeng, L., Du, W., Zhao, L., and Sun, Z. (2021). Modeling Interprovincial Cooperative Carbon Reduction in China: an Electricity Generation Perspective. Front. Energ. Res. 9, 649097. doi:10.3389/fenrg.2021.649097
Zhang, H., Yin, Y., Shen, H., He, J., and Zhao, S. (2011). Peak-load Regulating Adequacy Evaluation Associated with Large-Scale Wind Power Integration. Proceed. CSEE 31, 26–31. CNKI:SUN:ZGDC.0.2011-22-003. [in Chinese]
Zhang, Y.-J., Wang, A.-D., and Da, Y.-B. (2014). Regional Allocation of Carbon Emission Quotas in China: Evidence from the Shapley Value Method. Energy Policy 74, 454–464. doi:10.1016/j.enpol.2014.08.006
Keywords: renewable energy, shapley value, peak shaving, gas-fired power generation, regional coordination, capacity allocation, capacity trading, flexibility retrofit
Citation: Zhang S, Wang Y, Zhao X, Duan X and Luo D (2022) Estimating Peak Shaving Capacity Demand of Gas-Fired Power in China From a Regional Coordination Perspective. Front. Energy Res. 10:817767. doi: 10.3389/fenrg.2022.817767
Received: 18 November 2021; Accepted: 17 January 2022;
Published: 28 February 2022.
Edited by:
Bai-Chen Xie, Tianjin University, ChinaReviewed by:
Na Duan, Tianjin University of Finance and Economics, ChinaCopyright © 2022 Zhang, Wang, Zhao, Duan and Luo. This is an open-access article distributed under the terms of the Creative Commons Attribution License (CC BY). The use, distribution or reproduction in other forums is permitted, provided the original author(s) and the copyright owner(s) are credited and that the original publication in this journal is cited, in accordance with accepted academic practice. No use, distribution or reproduction is permitted which does not comply with these terms.
*Correspondence: Dongkun Luo, MTg3MTgyNzQxMDNAMTYzLmNvbQ==
Disclaimer: All claims expressed in this article are solely those of the authors and do not necessarily represent those of their affiliated organizations, or those of the publisher, the editors and the reviewers. Any product that may be evaluated in this article or claim that may be made by its manufacturer is not guaranteed or endorsed by the publisher.
Research integrity at Frontiers
Learn more about the work of our research integrity team to safeguard the quality of each article we publish.