 Qing Gong
 Wenjin Ding
 Yan Chai1
- 1Institute of Engineering Thermodynamics, German Aerospace Center (DLR), Stuttgart, Germany
- 2Institute of Engineering Thermodynamics, German Aerospace Center (DLR), Cologne, Germany
MgCl2–KCl–NaCl is a promising thermal energy storage (TES) material and heat transfer fluid (HTF) with high operating temperatures of >700°C for next-generation concentrating solar power (CSP) plants. One major challenge for future implementation of the molten chloride TES/HTF technology arises from the presence of some corrosive impurities, especially MgOHCl, a hydrolysis product of hydrated MgCl2. Even extremely low-concentration MgOHCl (tens of ppm O in weight) can cause unneglectable corrosion of commercial Fe–Cr–Ni alloys, which limits their service time as the structural materials in the molten chloride TES/HTF system. Thus, the chemical analysis and monitoring techniques of MgOHCl at the tens of ppm O level are vital for corrosion control. In this work, a chemical analysis technique based on direct titration and a high-precision automatic titrator was developed for an exact measurement of MgOHCl at the tens of ppm O level. It shows a standard deviation below 5 ppm O and an average error below 7 ppm O when the concentration of MgOHCl is 36 ppm O. Moreover, compared to other methods available in some literature reports, it can exclude the influence of co-existing MgO on the MgOHCl concentration measurement. This chemical analysis technique was used to calibrate the previously developed electrochemical method based on cyclic voltammetry (CV) to achieve reliable in situ monitoring of MgOHCl in the MgCl2–KCl–NaCl molten salt at a concentration as low as the tens of ppm O level. The in situ monitoring technique shows a monitoring limitation of <39 ppm O. The two techniques for MgOHCl measurement developed in this work could be used to develop an in situ corrosion control system to ensure the long service time of the molten chloride TES/HTF system in next-generation CSP plants.
Introduction
MgCl2–KCl–NaCl molten chloride salt has received much attention in recent years due to its wide working temperature range (420–800°C), low vapor pressure, low material cost, and good heat capacity (Mehos et al., 2017; Ding et al., 2018a; Turchi et al., 2018; Villada et al., 2021). It has potential use in the next-generation concentrating solar power (CSP) plants as thermal energy storage (TES) material and heat transfer fluid (HTF), allowing the operating temperature of the CSP plant to be increased from about 560°C to >700°C. With such a high operating temperature, the energy efficiency of the power cycle in the CSP plant can rise from 40% to >50% when integrated with the supercritical carbon dioxide (sCO2) Brayton power cycle, which would significantly reduce the levelized cost of electricity (LCOE) of CSP (Mehos et al., 2017). However, the molten MgCl2–KCl–NaCl mixture is strongly corrosive to commercial Fe-Cr-Ni alloys even under a protective inert atmosphere (Ding et al., 2018c; Sun et al., 2018), which greatly limits its application.
Numerous studies have shown that the corrosion in molten MgCl2–KCl–NaCl salt is caused by corrosive impurities, especially MgOHCl (Ding et al., 2018c; Choi et al., 2019; Grégoire et al., 2020; Sun et al., 2020; Zhao, 2020), not by the molten chloride salt itself (Zhang et al., 2020). As a consequence of the strong hygroscopicity of MgCl2, some moisture is inevitably absorbed in MgCl2–KCl–NaCl in practical applications. Subsequently, the main corrosive impurity MgOHCl is generated as a hydrolysis product during heating in the melting process, resulting in the strong salt corrosivity to the metallic structural materials, such as Fe–Cr–Ni alloys (Kipouros and Sadoway, 2001; Kashani-Nejad, 2005; Ding et al., 2018c). To represent the concentration of MgOHCl (C(MgOHCl))in the molten salt, the unit parts per million oxygen (ppm O) is defined as the mass fraction of oxygen (mO in MgOHCl) in the total mass of the salt sample (msample), as shown in Eq. 1 (Skar, 2001).
The estimated acceptable impurity level of MgOHCl for the different types of alloys based on the literature (Ding et al., 2018c; Ding et al., 2019a; Ding et al., 2019b; Kurley et al., 2019) and their relative cost factors (Gilardi et al., 2006) are summarized in Table 1. To allow the use of inexpensive alloys (e.g. stainless steels) for TES/HTF with molten MgCl2–KCl or MgCl2–KCl–NaCl at ≥700°C, the salt impurity needs to be controlled at the tens of ppm O level by monitoring and salt purification to control the salt corrosivity (Ding et al., 2019b; Kurley et al., 2019). As shown in Figure 1, a corrosion control system (CCS) integrated into the molten chloride TES/HTF system has been proposed in the previous work, which contains the main parts—part of online corrosion monitoring and part of corrosion mitigation (Villada et al., 2021). For CCS, reliable in situ and ex situ monitoring techniques of MgOHCl at the tens of ppm level are vital to ensure its effectiveness, efficiency, and economics.
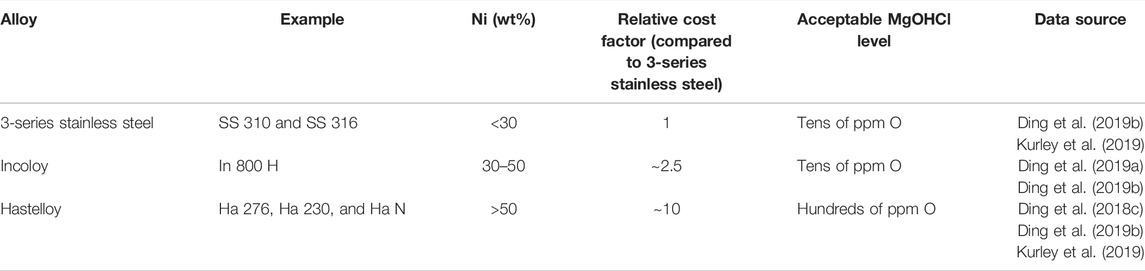
TABLE 1. Comparison of the Ni content, cost of the alloys, and their estimated acceptable impurity level with a target corrosion rate of 15 μm/year at ≥700°C for molten MgCl2-KCl or MgCl2-KCl-NaCl under inert atmosphere.
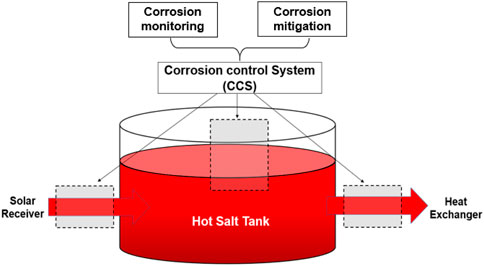
FIGURE 1. Corrosion control system (CCS) integrated into the molten chloride TES/HTF system, which contains the online corrosion monitoring and mitigation parts, and has been proposed in the previous work (Villada et al., 2021).
To measure the oxygen-containing impurity concentration or redox potential of molten salts, electrochemical methods including cyclic voltammetry (CV) (Skar, 2001; Ding et al., 2017; 2018b; Choi et al., 2019; Gonzalez et al., 2020; Guo et al., 2021), square wave voltammetry (SWV) (Song et al., 2018), chronopotentiometry (CP) (Zhang et al., 2020), and open-circuit potentiometry (OCP) (Choi et al., 2019; Gonzalez et al., 2020) have been employed in molten chloride salts (Williams et al., 2021). Among them, an approach combining in situ and ex situ measurement of MgOH+Cl− was investigated, in which cyclic voltammetry (CV) was employed as the in situ measurement of MgOHCl (Skar, 2001; Ding et al., 2018b; Guo et al., 2021), while ex situ methods of titration (Skar, 2001; Ding et al., 2018b) and carbothermal reduction (Skar, 2001) were used for the ex situ measurement to calibrate the in situ CV measurement. The reduction peak in the cyclic voltammogram—peak B, shown in Figure 2, represents the reaction of MgOH+ to MgO, as shown in Eq. 2 (Skar, 2001; Ding et al., 2018b; Guo et al., 2021). Moreover, the current density of peak B in the cyclic voltammogram is linearly linked to the concentration of MgOH+.
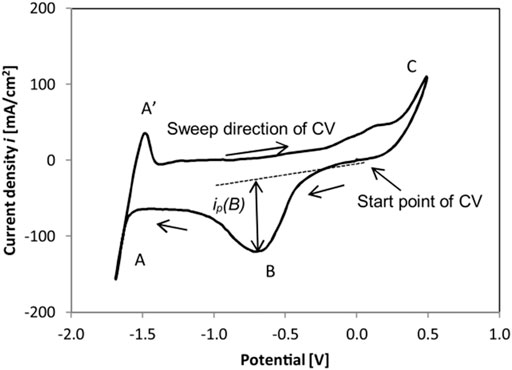
FIGURE 2. Cyclic voltammogram in eutectic MgCl2/KCl/NaCl at 500°C obtained by a tungsten working electrode with a sweep rate of 200 mV/s (Ding et al., 2017; 2018b).
It was pointed out in the work of Skar (2001) and Ding et al. (2018b) that the ex situ measurements based on titration and carbothermal reduction could result in an over-measurement of the MgOH+ concentration and biased calibration of CV since other impurities (e.g. MgO or H2O) cannot be quantitatively excluded in these ex situ measurements. In the MgCl2-KCl-NaCl molten salt, non-corrosive MgO and corrosive MgOHCl commonly co-exist. When the temperature is >555°C, MgOHCl can be decomposed into MgO and HCl, as shown in Eq. 3 (Kipouros and Sadoway, 2001; Kashani-Nejad et al., 2005).
To measure non-corrosive MgO and corrosive MgOHCl separately, Klammer et al. (2020) used water and methanol to extract MgOHCl/MgO based on the solubility difference (Klammer et al., 2020). This method can measure the concentration of MgOHCl down to 0.1 wt% (∼200 ppm O) by a typical ethylenediaminetetraacetic acid (EDTA) titration technique and has been used to measure the purity of MgCl2-containing chloride mixtures after pre-purification. However, due to the solubility of MgOHCl in methanol, this method cannot measure the extremely low-concentration MgOHCl.
In general, it was proposed that the in situ electrochemical CV measurement of MgOHCl calibrated by a reliable ex situ chemical analysis method is a promising approach to monitor MgOHCl (i.e., salt corrosivity) in molten MgCl2–KCl–NaCl. However, existing electrochemical and chemical measurement methods of MgOHCl have minimum measurement limits above the acceptable MgOHCl level. For corrosion control, the MgOHCl concentration should be controlled at tens of ppm O to allow inexpensive alloys (e.g., stainless steel) to withstand the corrosion of molten MgCl2–KCl–NaCl at ≥700°C. In this experiment, aiming to develop reliable chemical analysis and in situ monitoring techniques for MgOHCl at the tens of ppm O level, the following experiments were designed and carried out:
• Different concentrations of MgOHCl from thousands to tens of ppm O level were obtained by electrolysis at 500°C and thermal decomposition at 600 and 700°C.
• A chemical analysis technique based on direct titration and a high-precision automatic titrator was developed to measure MgOHCl concentration at the tens of ppm O level.
• The reliable concentration data on MgOHCl obtained by titration were used to calibrate the CV data to develop an in situ monitoring technique for MgOHCl at tens of ppm O.
Experimental
Materials and Experimental Setup
KCl (purity >99 wt%) and NaCl (purity >99 wt%) were purchased from Alfa Aesar, Germany, while anhydrous MgCl2 (purity >99 wt%) was supplied by Magnesia, Germany. They were used to synthesize the eutectic salt mixture of MgCl2-NaCl-KCl (47.1-30.2-22.7 mol%) for the experiments. This eutectic salt composition is suggested by the previous work (Villada et al., 2021).
Figure 3 shows the setup of electrochemical experiments. A chemically stable glassy carbon crucible purchased from HTW Germany (Sigradur® G) was used in this work to prevent the reaction of the strongly corrosive molten chloride salt with the crucible. The 250 g chloride salts were heated in an argon atmosphere (purity ≥99.999%, H2O ≤ 0.5 ppm, 10 nL/h, and pressure above atmospheric pressure of about 0.1 bar) to 500°C, 600°C, or 700°C. As shown in Figure 3, an alumina plate was used under the glassy carbon crucible to electrically insulate the glassy carbon and the autoclave system made of steel from each other.
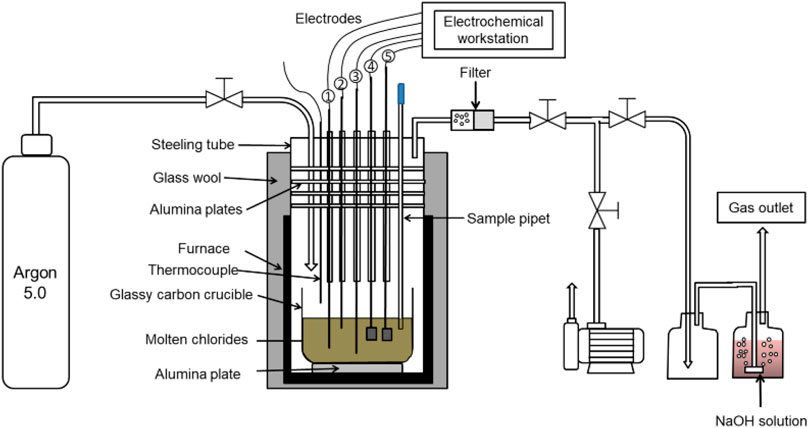
FIGURE 3. Schematic representation of the experimental setup for electrochemical salt purification and CV experiments.
As shown in Figure 3, five electrodes were used for electrolysis and cyclic voltammetry (CV). All the electrochemical experiments were conducted using a ZENNIUM electrochemical workstation from Zahner GmbH (Germany). Table 2 summarizes the electrodes used in different electrochemical experiments and the material composition of these electrodes. Three tungsten electrodes (1 mm diameter, purity >99.5%, purchased from Alfa Aesar) were used as working (∼32 mm2), counter (∼100 mm2), and quasi reference electrodes (∼100 mm2) for CV, while two graphite electrodes (size: 40 mm × 10 mm x 2 mm) were used for electrochemical purification. Due to their larger surface area compared with tungsten electrodes used in our previous work (Ding et al., 2017; 2018b), graphite electrodes with a 4 cm2 area were used to have a fast purification rate and be able to purify more salt before electrode passivation.
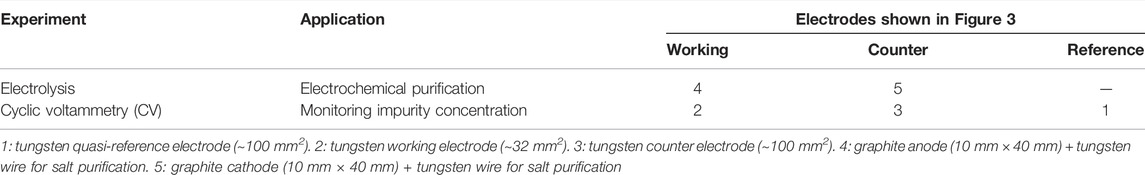
TABLE 2. Electrodes used for electrochemical purification via electrolysis and monitoring the impurity concentration via CV.
CV Experiments
Three groups of CV experiments at different temperatures (500°C, 600°C, and 700°C) were conducted. Once the temperature of the salt reached the target temperature, the counter electrode, reference electrode of CV, and the two graphite electrodes of electrolysis were inserted into the molten salts but without touching the crucible bottom, while the immersion depth of the working electrode of CV was fixed to 10 mm (i.e., the contact area of the tungsten electrode with the melt is about 31.4 mm2). A sweep rate of 200 mV/s was used in all CV experiments as in the previous work (Ding et al., 2017; 2018b), while the potential voltage of CV was from 0.5 V to −1.7 V vs. reference.
Figure 4 is an example cyclic voltammogram of the eutectic MgCl2-NaCl-KCl salt before electrolysis treatment at 500°C, in which peak B represents the reduction reaction in Eq. 2 and is in line with the previous work (Ding et al., 2018b).
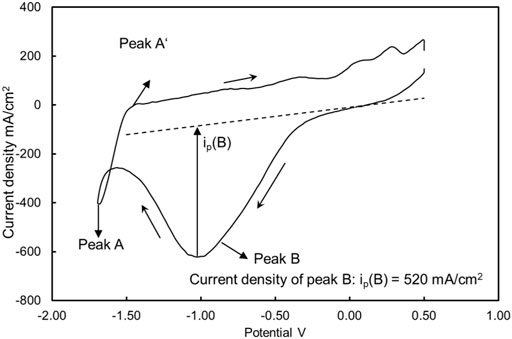
FIGURE 4. Example of a cyclic voltammogram for molten MgCl2-KCl-NaCl salt with impurity ion MgOH+ at 500°C. The current density of peak B in this case was 520 mA/cm2. The working, reference, and counter electrodes of CV were tungsten. Sweep rate: 200 mV/s.
Skar (2001) and Guo et al. (2021) discovered that the peak current density of the peak B (ip(B)) is proportional to the concentration of MgOHCl (C(MgOHCl)) in molten MgCl2-NaCl or (-KCl) salts(Skar, 2001; Guo et al., 2021), which is in accordance with the Randles–Sevcik equation (Randles, 1948; Ševčík, 1948):
where
Eq. 5 can be simplified to Eq. 6, where the concentration of C(MgOHCl) [ppm O] is proportional to
In the CV experiments, all current densities of peak B were read with a tangent at the starting point of peak B as the baseline (see Figure 4). The current densities of peak B would then be calibrated using an advanced titration process (see Titration Experiments section) to improve the measurement accuracy and precision of CV.
In order to study the relationship between the current density of peak B and the concentration of MgOHCl in the molten salt (i.e., calculating the
Figures 5A,B show the flowchart of CV experiments at 500, 600, and 700°C. Cyclic voltammograms were obtained at different temperatures and different MgOHCl concentrations. After each CV experiment, 1−2 g chloride salts, as shown in Figure 5C, were taken out from the crucible using a sample pipet (see Figure 3) for further titration experiments. During the short sample extraction, the system remained under an Ar (purity: 99.999%) atmosphere all the time to avoid air leakage into the autoclave. Combining the data on titration and CV experiments,
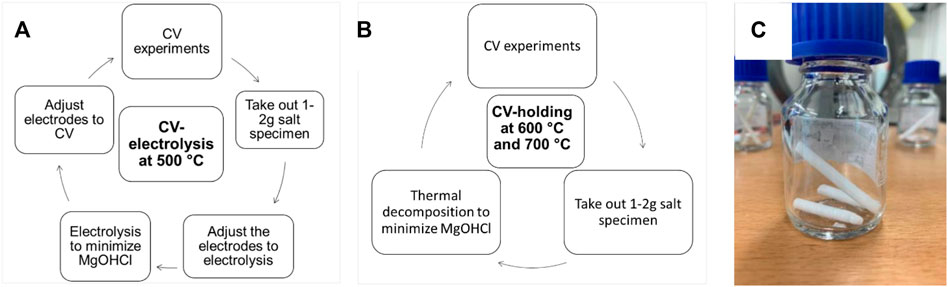
FIGURE 5. Flowchart of CV experiments at (A) 500°C, (B) 600, and 700°C; (C) salt specimen taken from the glassy carbon crucible for titration.
Titration Experiments
The acid consumption method based on titration was used for the quantitative measurement of the total amount of MgOHCl in a salt sample. A high-precision automatic titration instrument, 905 Titrando, purchased from Metrohm Germany, was employed. The titration method is as follows: first, about 500 mg sample was weighed by using an analytical balance. Then, the solid samples were dissolved in a beaker with 150 ml of ultrapure water (HiPerSolv, VWR, Germany). After installation of the beaker with samples, the standard titrant (0.01 M HCl) was charged into a 20 ml cylinder from the reagent bottle and then dripped into the salt solution through the rotation of the gear at an average rate of 0.2 ml/min (slower at pH values near 7). Meanwhile, a stirrer homogenized the solution. The titration was performed under a nitrogen purge to exclude any interference from carbon dioxide/carbonic acid. Hydrochloric acid solution (0.01 M) purchased from Merck KGaA was used to prepare the standard titrant. The titer of the HCl solution was calibrated with sodium carbonate (Na2CO3). The pH value and the amount of the consumed titrant were plotted by the computer, as shown in Figure 6. The equivalence point (EP) is marked out, where moles of acid (HCl) and moles of base (MgOHCl) neutralize each other, as shown in Eq. 10.
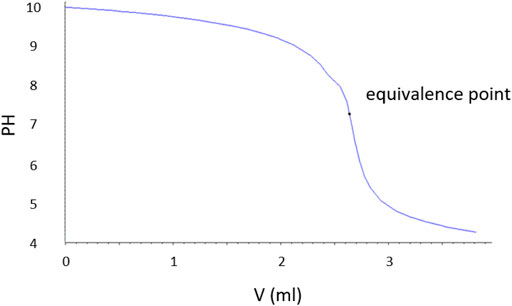
FIGURE 6. Typical pH change curve of a direct titration of a salt sample containing MgOHCl with the 0.01 M HCl titrant recorded by using the high-precision titrator.
The concentration of MgOHCl in samples in ppm O is calculated according to Eq. 11, where ti is the titer of HCl, i.e., the ratio of actual concentration to theoretical concentration (0.01 M); VHCl is the volume of HCl at EP in mL; CHCl is 0.01 mol/L;
Error Analysis for Titration and CV
For ex situ direct titration to measure the concentration of MgOHCl in 500 mg samples, there are two main sources of error: one caused by the co-existing MgO impurity in the salt sample and another caused by the titration experiment (i.e., titration conditions and equipment).
For the first error, once the MgCl2-KCl-NaCl-(MgO-MgOHCl) sample is placed in water, two types of impurities will dissolve in the water or react with water, as shown in Eq. 12 and Eq. 13 (Chen et al., 2018; Klammer et al., 2020).
Empirically, the dissolution of MgOHCl in water (see Eq. 12) occurs rapidly, when the aqueous solution is not saturated with Mg(OH)2 (i.e., pH < 10.4) (Dong et al., 2010). In this work, the pH value of the salt solution for titration was smaller than 10 because of the low MgOHCl concentration (<4000 ppm O in salt samples), as shown in Figure 6. Unlike the rapid dissolution of MgOHCl shown in Eq. 12, the reaction between MgO and H2O shown in Eq. 13 has been experimentally proved slow in an alkali or a neutral environment, as shown in Figure 7 (Fruhwirth et al., 1985). As can be seen, in the pH range of 6–9, the dissolution rate of MgO is less than 10−11 mol cm−2 s−1. Thus, when we know the diameter and concentration of MgO particles in the system, the amount of HCl consumed by MgO can be estimated. Taking the highest concentration of MgOHCl (4000 ppm O) as a reference, the maximum mass fraction of MgO was 1 wt% (assuming that all MgOHCl was converted to MgO) (Zhao, 2020). We measured the diameter of MgO in MgCl2-KCl-NaCl and found that the broad peak of the laser-based particle-size analyzer was 10–30 µm. Using the parameters mentioned earlier and the density of MgO (3.58 g/cm3), the total surface area (A) in 250 g of chloride salt can be calculated, as shown in Table 3. Then, the maximum dissolution rate of MgO in this direct titration experiment can be calculated according to Eq. 14.
where E is the error caused by MgO in ppm O/min; k is the MgO dissolution rate, adopting 10−11 mol cm−2 s−1; A is total MgO surface area in cm2, listed in Table 3;
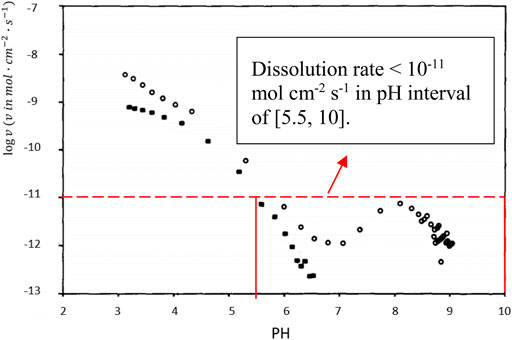
FIGURE 7. pH vs. the rate of dissolution of MgO powder (°) and a (100) MgO crystal (■) at 25°C in aqueous solution (Fruhwirth et al., 1985). The dissolution rate is smaller than 10−11 mol cm−2 s−1 in the pH interval of [5.5, 10].
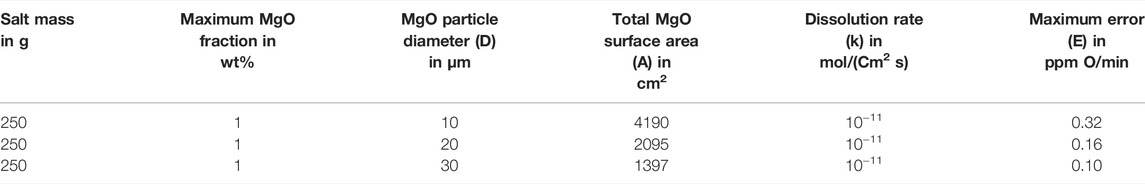
TABLE 3. Error caused by the dissolution of MgO with different particle sizes in an aqueous solution with pH 5.5–10.4.
The calculated error caused by MgO in ppm O/min is listed in Table 3. In the direct titration, the time required for the titration to reach EP was not exceeded by 5 min for neutralization of 50 ppm O MgOHCl by 0.01 M HCl, which means that the titration error due to co-existing MgO is less than 1.6 ppm O (0.32 × 5) for the MgOHCl concentration measurement.
The second error source of the measurement based on direct titration in this work was the experimental error, which could be caused by the dissolved carbon dioxide (i.e. carbonic acid) and the fluctuation of the HCl amount injected by gear etc. An experiment was carried out to determine the relative standard deviation (RSD) and percentage error of direct titration. An amount of 1.308 mg of Mg(OH)2 was weighed and dissolved in 2 L distilled water as the 1.13 × 10⁻⁵ mol/L Mg(OH)2 standard solution. Then, about 50 ml of standard solution was extracted and measured by direct titration, whose HCl consumption is equivalent to 36 ppm O MgOHCl in the 500 mg salt sample. The titration of the standard solution was repeated 13 times to obtain sufficient data for statistical analysis (see Table 4). It was found that the average standard deviation was 4.35 ppm O (RSD = 10.2%), and the average error was +6.62 ppm O (average relative error = +18%) for measuring the equivalent of 36 ppm O MgOHCl in 500 mg samples by direct titration using the titrator. Compared to this error, the titration error due to MgO is much smaller and thus neglectable.
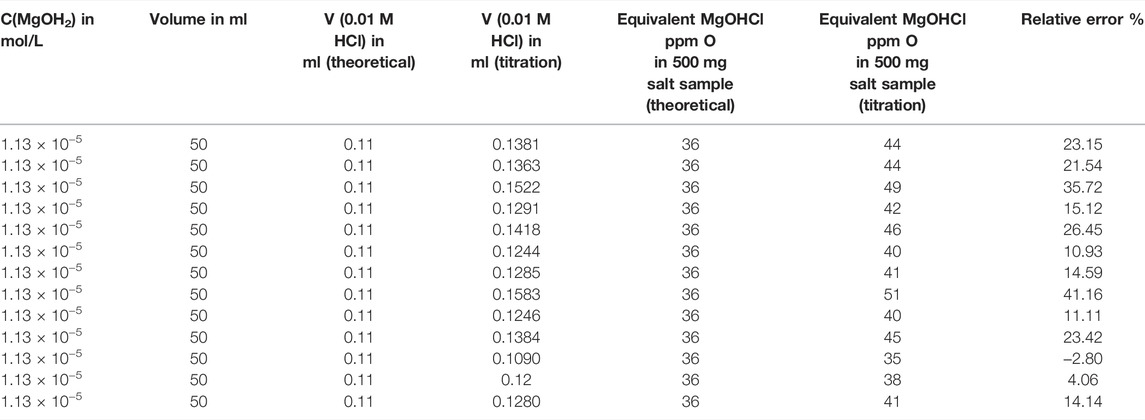
TABLE 4. Thirteen times direct titration experiments with the standard Mg(OH)2 solution to determine RSD and relative error at a concentration equivalent 36 ppm O in 500-mg salt sample.
For in situ measurement by CV, the repeatability of cyclic voltammograms is significant to determine the current density of peak B and link it to the concentration of MgOHCl. Figure 8 displays three times the CV curves in molten chloride salt at 500°C after 30 min of electrolysis at 1.7 V. The difference of ip(b) in the same situation is the deviation of the current density. The average height of peak B is 42 mA/cm2, while the relative standard deviation (RSD) is 6.3%, showing good stability at the low current density of ip(b). Generally, the closer to the detection limit, the greater will be the relative standard deviation. The 42 mA/cm2 height of peak B is the smallest current density obtained at 500°C. Due to the thermal decomposition of MgOHCl (Eq. 3), the CV voltammograms at 600 and 700°C are not suitable for error analysis. The MgOHCl concentration changed during several CV measurements at 600 and 700°C. Hence, for all the CV measurements in this work, the relative standard errors are set at 6.3%.
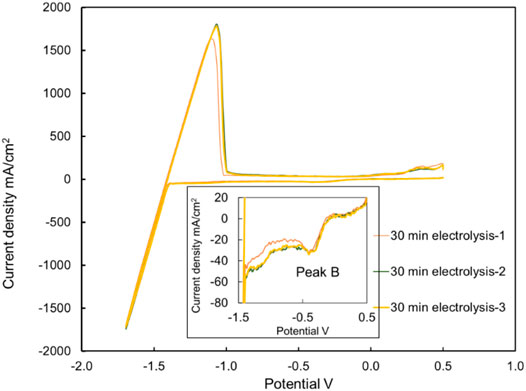
FIGURE 8. Three cyclic voltammograms with the same molten salt batch were carried out directly and immediately after each other. The current densities of peak B were 43, 39, and 44 mA/cm2 in three measurements, respectively. Temperature: 500°C, after 30 min electrolysis. Working, reference, and counter electrodes of CV: tungsten. Sweep rate: 200 mV/s.
Both precision and accuracy data in this work are summarized in Table 5. To determine the MgOHCl concentrations in salt samples and their errors, three titrations were carried out for each sample. When the standard deviation of one batch of samples was higher than 6.62 ppm O (the average error), the standard deviation of three titrations was adopted as the main error source. When the standard deviation was smaller than 6.62 ppm O, the average error (6.62 ppm O) was adopted as the domination error for the direct titration.
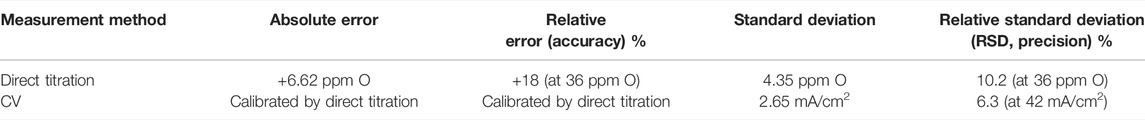
TABLE 5. Summary of the precision and accuracy for direct titration and CV. Data on direct titration come from repeated titration of 36 ppm O equivalent MgOHCl; data on CV come from repeated scanning of 500°C salts after 30-min electrolysis.
Results and Discussion
In previous work, some efforts have been made to understand the relation between the height of peak B (in Figure 2) and the concentration of MgOHCl in the MgCl2-containing chloride salts (Skar, 2001; Ding et al., 2017; 2018b; Choi et al., 2019; Gonzalez et al., 2020; Guo et al., 2021). It was found that adding NaOH can increase the height of peak B because of the reaction shown in Eq. 15. In addition, the potential difference between peak B and peak A is comparable ∼1.5 V. The reactions corresponding to peak A and peak A’ are seen as the typical peaks of Mg2+ reduction and its reverse reaction of Mg oxidation, as shown in Eq. 16 and Eq. 17, respectively, which can be seen as a marker. This evidence suggests that the peak at the potential of about 0 V in this work can be seen as the peak B corresponding to the reaction shown in Eq. 2. Different from the previous work (Ding et al., 2018b; Guo et al., 2021), the gradient of the MgOHCl concentration in this work was not obtained by adding NaOH but was obtained by electrolysis and thermo-decomposition to decrease the concentration of MgOHCl. Hence, the concentration of MgOHCl in this work was reduced to tens of ppm O since this level was interesting for corrosion control.
Concentration of MgOHCl Measured by Titration
The decrease in the MgOHCl concentration with electrolysis time at 500°C is shown in Figure 9, while the decrease in the MgOHCl concentration by thermal decomposition at 600 and 700°C with enhanced holding time is displayed in Figure 10. All the concentration data in Figures 9, 10 were obtained by the direct titration method.
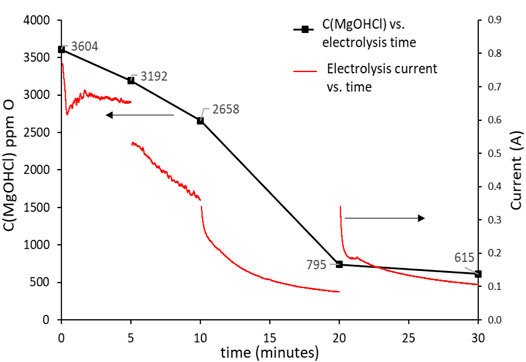
FIGURE 9. Concentration of MgOHCl at 500°C decreases with the increasing electrolysis time. The black line using the left y-axis shows the concentration of MgOHCl in ppm O; the red line using the right y-axis shows the electrolysis current in A.
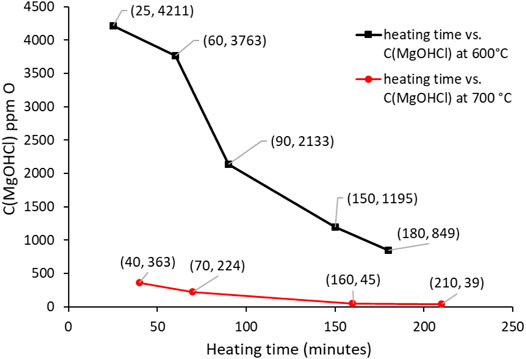
FIGURE 10. Concentration of MgOHCl decreases with increasing holding time at 600 and 700°C.
Figure 9 shows the relationship between the concentration of MgOHCl and electrolysis time. Generally, the concentration of MgOHCl decreased with the increasing electrolysis time at 500°C. However, as can be seen from the red line in Figure 9, the first two electrolysis experiments were carried out for 5 min, with the decrease in current from ∼700 to ∼400 mA, while the last two electrolysis experiments were conducted for 10 min with the decrease in current from ∼400 to ∼100 mA because of the MgO passivation. During the running of electrolysis, the poor electrical conductivity of MgO was generated, as shown in Eq. 8, which covered the surface of the graphite electrode and hindered electronic transmission, leading to the low efficiency of MgOHCl removal (Ding et al., 2019a). Two methods were carried out in order to mitigate the problem of the passive MgO film on the electrode and increase the efficiency of electrolysis. First, the positive and negative electrodes of electrolysis were reversed after each electrolysis. Once reversing the cathode and anode, an instantaneous recovery was displayed on the current curve, which could be attributed to the disruption of the MgO film by the generated chlorine gas (Ding et al., 2021). The reversing electrodes did not completely solve the problem of electrode passivation. Hence, second, after the first two times of 5-min electrolysis, the duration of electrolysis time was expanded to 10 min to obtain a measurable reduction of MgOHCl at lower currents.
Compared to our previous work (Ding et al., 2017), the electrolysis electrodes were improved. The tungsten wire electrodes were replaced by 10 mm × 40 mm graphite foils. After 30 min of electrolysis, the MgOHCl concentration decreased from 3603 ppm O to 415 ppm O, i.e., the concentration of MgOHCl was reduced to about 17% of the original concentration. In our previous work (Ding et al., 2017), after 25 min of electrolysis with a tungsten wire electrode, the concentration of MgOH+ was reduced to only 69% of the original MgOH+ concentration (from 10,400 ppm O to 7200 ppm O).
At 600 and 700°C, the reason for the decrease of MgOHCl with increasing heating time is the thermal decomposition of MgOHCl (Kipouros and Sadoway, 2001). Furthermore, the impurity level at 600°C was significantly higher than at 700°C because MgOHCl decomposes faster at 700°C than at 600°C, which compares well with that reported in some literature reports (Kashani-Nejad, 2005; Kashani-Nejad et al., 2005). In addition, before molten chloride salt reached 700°C, thermal decomposition had already occurred at the temperature range between 600 and 700°C during heating with a 5 K/min rate.
For comparison, Table 6 lists different measurement methods of MgOHCl in molten MgCl2-containing chlorides (Skar, 2001; Ding et al., 2017, 2018b; Kurley et al., 2019; Klammer et al., 2020). Kurley et al. (2019) carried out the method of direct titration to measure oxygen-containing impurities in the salt samples, which were purified by CCl4 bubbling with as low as 1.6 ppm O impurity. This indicates that direct titration is suitable for the low concentration impurity determination of the molten chloride salt. However, the authors did not discuss the error based on their results nor did they explain the principle of direct titration to measure MgOHCl in MgCl2-containing salt. In this study, it was confirmed that direct titration can measure the tens of ppm O level MgOHCl with acceptable errors. In addition, this method can exclude the interference of MgO with a relatively uncomplicated method, compared with the method published by Ding et al. (2018b) and Klammer et al. (2020). Therefore, it has relatively higher precision than the back-titration employed in our previous work (Ding et al., 2017; 2018b).
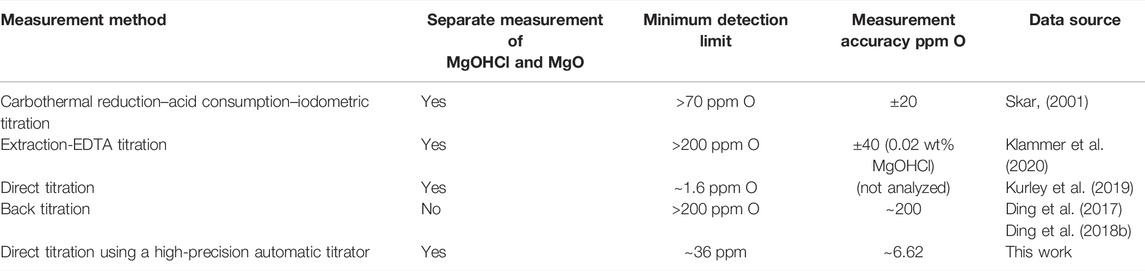
TABLE 6. Comparison with measurement methods of MgOHCl in molten chlorides.
CV Results
As shown in Figures 11–13, the cyclic voltammograms in this work show similar features to those in the literature (Ding et al., 2018b; Choi et al., 2019; Guo et al., 2021). For example, the potential of peak B is about 1.5 V higher than that of peak A at 500–700°C. Although the height of peak A′ is not relevant to the MgOHCl concentration, it is still noticeable that the heights of oxidation peaks are different from each other. Peak A′ corresponds to the oxidation of Mg to Mg 2+, as shown in Eq. 17. This can be explained by the fact that the amount of deposition Mg on the tungsten electrodes increased as the experiment proceeded, resulting in reaction enhancement at peak A’. When the MgOHCl concentration in melts was relatively high, the deposition Mg can react with MgOHCl rapidly, as shown in Eq. 18. After electrolysis or decomposition, the MgOHCl concentration decreased significantly, resulting in a slower reaction of Eq. 18 and more Mg deposition on the electrodes. This deposition of Mg could cause the high peak A’.
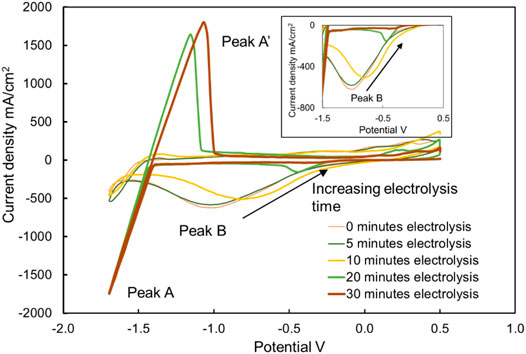
FIGURE 11. Cyclic voltammograms of chloride molten salt before electrolysis (i.e., 0 min), after 5, 10, 20, and 30 min of electrolysis at 500°C. The working, counter, and reference electrodes of CV with a sweep rate of 200 mV/s were tungsten. The working and counter electrodes of electrolysis were graphite. The voltage on the working and counter electrodes of electrolysis was kept at −1.7 V.
Comparing the concentrations shown in Figure 9 and the heights of peak B shown in Figure 11, it is clearly visible that the height of peak B decreases from 453 to 42 mA/cm2, with the decreasing concentration of MgOHCl from 3640 to 615 ppm O at 500°C with 30-min electrolysis at 1.7 V. Similarly, comparing the heights of peak B in Figures 12, 13, with the decomposition of MgOHCl, the heights of peak B decreased significantly at 600 and 700°C as well. After 180 min of holding in the furnace under an argon atmosphere at 600°C, the current density of peak B decreased from 507 to 69 mA/cm2, corresponding to the concentration of MgOHCl decreasing from 4211 to 894 ppm O as seen from the black line in Figure 10. At 700°C, after 210 min of holding, the current density of peak B decreased from 166 to 24 mA/cm2, which corresponds to 363 and 39 ppm O MgOHCl (the red line in Figure 10). In general, the height of peaks B in this work always decreases with the decline in the MgOHCl concentration measured by titration.
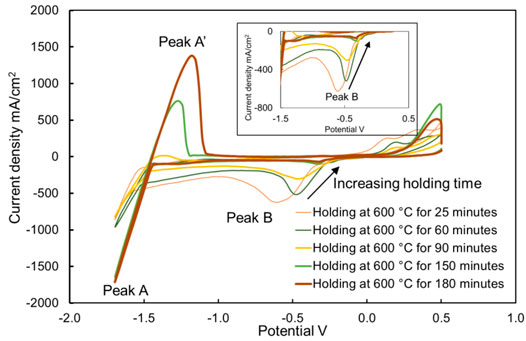
FIGURE 12. Cyclic voltammograms of chloride molten salt, holding at 600°C for 25, 60, 90, 150, and 180 min. The working, reference, and counter electrodes of CV were tungsten. Sweep rate: 200 mV/s.
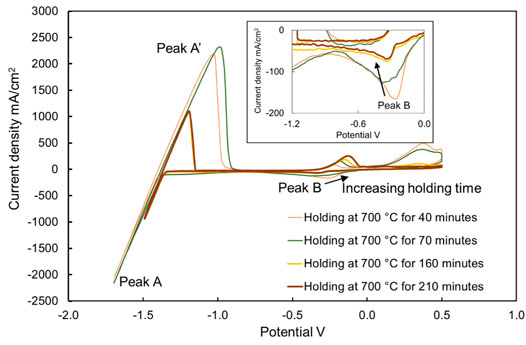
FIGURE 13. Cyclic voltammograms of chloride molten salt, holding at 700°C for 40, 70, 160, and 210 min. The working, reference, and counter electrodes of CV were tungsten. Sweep rate: 200 mV/s. There is a correlation between the current density and impurity concentration.
It is a promising method to measure the MgOHCl concentration in situ with the current density of peak B on CV (an electrochemical signal) when it can be calibrated by the ex situ measurement. In previous work, it has been repeatedly demonstrated that the density of peak B is linearly related to the concentration of MgOHCl in MgCl2-containing molten chloride salts (Skar, 2001; Ding et al., 2017, 2018b; Choi et al., 2019; Gonzalez et al., 2020; Guo et al., 2021). This work attempted to extend this linear relationship to the tens of ppm O level MgOHCl impurities. All the titration and CV data obtained with ex situ and in situ measurements are summarized and shown in Figure 14, which show the linear relationship between the MgOHCl concentration and the current density of peak B even when the concentration of MgOHCl is low to 39 ppm O. When all the data were between the two error lines, the slope k(T, D) in Eq. 6 for MgOHCl at 500–700°C was between 5.2 and 9.2 (i.e., 7.2 ± 2) (ppm O)/(mA/cm2).
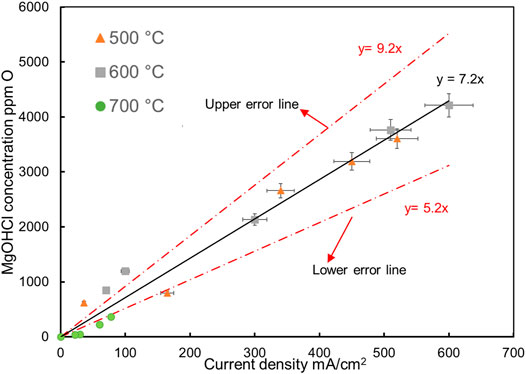
FIGURE 14. Peak B current densities vs. concentrations of MgOHCl in molten MgCl2-NaCl-KCl (47.1-30.2-22.7 mol%) at 500°C ( ), 600°C (
 ) and 700°C (
 ). Error bars in this plot are from section (Error analysis for titration and CV). The solid lines are the linear regressions.
Although the linear relationship between MgOHCl and current density in this work is consistent with the literature, the slope k(T, D) obtained in this work is smaller than that in the literature (Skar, 2001; Ding et al., 2017; 2018b) with the same sweep rate of 200 mV/s, as summarized in Table 7. This difference may be explained as follows: first, according to Eq. 6, the overmeasurement of the MgOHCl concentration, which has been discussed earlier, leads to a larger slope k(T, D). In our previous work (Ding et al., 2017; 2018b), in back titration with 0.1 M HCl (pH = 1), MgO unavoidably reacted with HCl, leading to over-measured concentrations of MgOHCl. In the work of Skar (2001), the concentration of MgOHCl was obtained by combining carbothermal reduction and iodometric titration. The impurities of O2 or H2O contained in the salt could also lead to overmeasurement of the O element in carbothermal reduction, further leading to overmeasurement of MgOHCl. Second, according to Eq. 7, k(T, D) decreases with the increasing diffusion coefficient (D). As pointed out by Skar (2001), with the increasing MgCl2 content in molten chloride salt, the diffusion coefficient of MgOH+ decreases. The molar fraction of MgCl2 in this work was 47.1 mol%, which is smaller than that in our previous work, which was 60 mol%. Thus, the diffusion coefficient of MgOH+ in this work could be larger than that of our previous work, resulting in a smaller k(T, D). These overlapping factors lead to the difference in the slopes between this work and previous work.
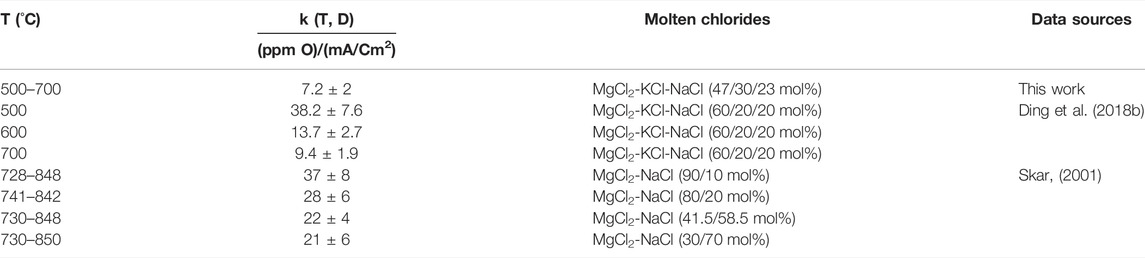
TABLE 7. Comparison of slopes of peak current densities vs. concentrations of MgOH+(k(T, D)) in molten chlorides determined in this work and reported in the literature (Skar, 2001; Ding et al., 2018b).
In our previous work, the value of k(T, D) was given separately at the temperatures of 500°C, 600°C, and 700°C. However, in this study, the same value of k(T, D) was obtained at 500–700°C (the key operating temperature range of the molten chloride TES/HTF system), being in line with that of Skar (2001). There are two reasons for giving the same value of k(T, D) in this work. First, when the k(T, D) values were calculated separately, the difference between these values was small. The k(T, D) values were ∼7, ∼7.5, and ∼4 at 500°C, 600°C, and 700°C, respectively. Second, the in situ monitoring technique of MgOHCl by CV would be employed as a warning system in the corrosion control system (Villada et al., 2021). Under this condition, the lowest measurable value of MgOHCl concentration is of interest, regardless of the temperature.
The diffusion coefficient (D) of MgOHCl can be estimated with the known k(T, D) value and the fixed sweep rate (200 mV/s in this work), according to Eq. 4 (Berzins–Delahay equation). The estimated diffusion coefficients of MgOHCl in MgCl2-KCl-NaCl at 500°C, 600°C, and 700°C were 1.64 × 10⁻⁴ cm2/s, 1.83 × 10⁻⁴ cm2/s, and 2.04 × 10⁻⁴ cm2/s, respectively. In addition, it was pointed out in the literature (Schenin-King and Picard, 1993; Skar, 2001) that the dissolved MgOHCl in molten chloride salt could be a dimer, i.e., (MgOHCl)2. When the calculation is based on the dimer (MgOHCl)2, the estimated diffusion coefficients at 500°C, 600°C, and 700°C were 8.20 × 10⁻⁵ cm2/s, 9.14 × 10⁻⁵ cm2/s, and 1.02 × 10⁻⁴ cm2/s, respectively. The Arrhenius relationship (log10(D) vs. 1/T) of this work and published data are summarized in a plot, as shown in Figure 15. The estimated diffusion coefficients of this work are higher than those in the literature (Skar, 2001; Ding et al., 2018b; Guo et al., 2021), which is mainly caused by the relatively higher k(D, T) adopted in the calculation. Moreover, when the dissolved impurity is considered as the dimer (MgOHCl)2 with two electrons transferred at peak B, the calculated diffusion coefficients are lower than those based on the monomer MgOHCl. In addition, the published diffusion coefficients are estimated by the soluble-soluble Randles–Sevcik equation, while the estimation in this work is based on the soluble-insoluble Berzins–Delahay equation.
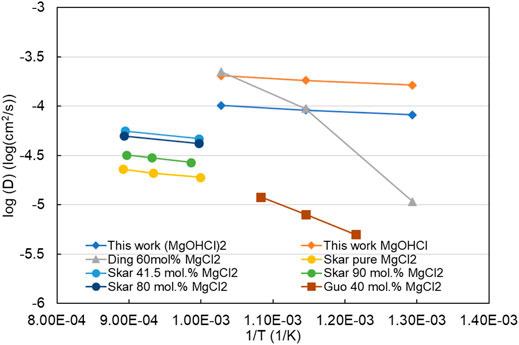
FIGURE 15. log10(D) vs. 1/T of this work and the literature in the melts with different concentrations of MgCl2. “This work MgOHCl and (MgOHCl)2” means that the diffusion coefficients are calculated based on the dissolution form as MgOHCl and (MgOHCl)2 in molten MgCl2-KCl-NaCl with 47.1 mol% MgCl2, respectively.
Conclusion
The MgCl2-KCl-NaCl molten salt shows low corrosivity to the metallic structural materials (i.e., alloys) at ≥700°C when the concentration of the main corrosive impurity MgOHCl is as low as tens of ppm O. To allow the use of inexpensive alloys (e.g. stainless steels) for TES/HTF with MgCl2-KCl-NaCl molten salt at ≥700°C, the salt impurity needs to be controlled at the tens of ppm O level by using the corrosion control system (CCS), including the online corrosion monitoring subsystem and corrosion mitigation subsystem. Thus, reliable chemical analysis and monitoring techniques of MgOHCl at the tens of ppm O level are vital in CCS to ensure its effectiveness, efficiency, and economics.
This work developed a chemical analysis technique based on direct titration and a high-precision automatic titrator, which can measure MgOHCl at the tens of ppm O level, e.g., 36 ppm O MgOHCl with a measurement error of about 7 ppm O. This chemical analysis technique was used to calibrate the in situ monitoring technique based on the CV developed in our previous work. The obtained CV data (i.e., peak current density) for 500–700°C shows good linearity with the data on direct titration (i.e., MgOHCl concentration) in the range from 39 to 4211 ppm O. The slope of the concentration of MgOHCl vs. the peak current density in CV was 7.2 ±2 (ppm O)/(mA/cm2) at 500–700°C. Using the calibrated CV technique and the slope in CCS, the corrosive impurity of MgOHCl low to tens of ppm O could be monitored in situ with quick response and cost-effectively. With the slope value, the estimated diffusion coefficients of MgOHCl in MgCl2-KCl-NaCl at 500–700°C were 1.64 × 10 −4–2.04 × 10⁻⁴ cm2/s, when it is assumed that the existing form of MgOHCl is the monomer MgOH+.
The two techniques for MgOHCl measurement developed in this work could be used to develop an in situ corrosion control system to ensure the long service time of the molten chloride TES/HTF system in next-generation CSP plants. Some future work is suggested to realize the commercial application of these techniques:
• the design of the in situ monitoring subsystem based on CV including the electrodes and their material selection,
• building a molten chloride test loop and testing the CV technique and subsystem under dynamic conditions of molten chlorides close to the real application conditions,
• testing the chemical analysis technique for the salt samples from the loop test, and
• development and testing of the corrosion mitigation techniques studied in our previous work or available in the literature in the molten chloride test loop.
Data Availability Statement
The original contributions presented in the study are included in the article/supplementary material; further inquiries can be directed to the corresponding authors.
Author Contributions
WD, QG, and YC contributed to the conception and design of the study. QG, WD, and JS performed the statistical analysis. QG wrote the first draft of the manuscript. All authors contributed to manuscript revision, read, and approved the submitted version.
Conflict of Interest
The authors declare that the research was conducted in the absence of any commercial or financial relationships that could be construed as a potential conflict of interest.
Publisher’s Note
All claims expressed in this article are solely those of the authors and do not necessarily represent those of their affiliated organizations, or those of the publisher, the editors, and the reviewers. Any product that may be evaluated in this article, or claim that may be made by its manufacturer, is not guaranteed or endorsed by the publisher.
Acknowledgments
This research has been performed within the DLR-DAAD fellowship program (Nr. 57540125). The authors would like to thank the colleagues M. Braun, R. Hoffmann, and A. Hanke for technical support in the different laboratories.
References
Berzins, T., and Delahay, P. (1953). Oscillographic Polarographic Waves for the Reversible Deposition of Metals on Solid Electrodes. J. Am. Chem. Soc. 75 (3), 555–559. doi:10.1021/ja01099a013
Boghosian, S., Godø, A., Mediaas, H., Ravlo, W., and Østvold, T. (1991). Oxide Complexes in Alkali--Alkaline-Earth Chloride Melts. Acta Chem. Scand. 45, 145–157. doi:10.3891/acta.chem.scand.45-0145
Chen, Y., An, Z., and Chen, M. (2018). Competition Mechanism Study of Mg+H2O and MgO+H2O Reaction. IOP Conf. Ser. Mat. Sci. Eng. 394, 022015. doi:10.1088/1757-899x/394/2/022015
Choi, S., Orabona, N. E., Dale, O. R., Okabe, P., Inman, C., and Simpson, M. F. (2019). Effect of Mg Dissolution on Cyclic Voltammetry and Open Circuit Potentiometry of Molten MgCl2-KCl-NaCl Candidate Heat Transfer Fluid for Concentrating Solar Power. Sol. Energy Mater. Sol. Cells 202, 110087. doi:10.1016/j.solmat.2019.110087
Ding, W., Bonk, A., and Bauer, T. (2018a). Corrosion Behavior of Metallic Alloys in Molten Chloride Salts for Thermal Energy Storage in Concentrated Solar Power Plants: A Review. Front. Chem. Sci. Eng. 12 (3), 564–576. doi:10.1007/s11705-018-1720-0
Ding, W., Bonk, A., Gussone, J., and Bauer, T. (2017). Cyclic Voltammetry for Monitoring Corrosive Impurities in Molten Chlorides for Thermal Energy Storage. Energy Procedia 135, 82–91. doi:10.1016/j.egypro.2017.09.489
Ding, W., Bonk, A., Gussone, J., and Bauer, T. (2018b). Electrochemical Measurement of Corrosive Impurities in Molten Chlorides for Thermal Energy Storage. J. Energy Storage 15, 408–414. doi:10.1016/j.est.2017.12.007
Ding, W., Gomez-Vidal, J., Bonk, A., and Bauer, T. (2019a). Molten Chloride Salts for Next Generation CSP Plants: Electrolytical Salt Purification for Reducing Corrosive Impurity Level. Sol. Energy Mater. Sol. Cells 199, 8–15. doi:10.1016/j.solmat.2019.04.021
Ding, W., Shi, H., Jianu, A., Xiu, Y., Bonk, A., Weisenburger, A., et al. (2019b). Molten Chloride Salts for Next Generation Concentrated Solar Power Plants: Mitigation Strategies against Corrosion of Structural Materials. Sol. Energy Mater. Sol. Cells 193, 298–313. doi:10.1016/j.solmat.2018.12.020
Ding, W., Shi, H., Xiu, Y., Bonk, A., Weisenburger, A., Jianu, A., et al. (2018c). Hot Corrosion Behavior of Commercial Alloys in Thermal Energy Storage Material of Molten MgCl2/KCl/NaCl under Inert Atmosphere. Sol. Energy Mater. Sol. Cells 184, 22–30. doi:10.1016/j.solmat.2018.04.025
Ding, W., Yang, F., Bonk, A., and Bauer, T. (2021). Molten Chloride Salts for High-Temperature Thermal Energy Storage: Continuous Electrolytic Salt Purification with Two Mg-Electrodes and Alternating Voltage for Corrosion Control. Sol. Energy Mater. Sol. Cells 223, 110979. doi:10.1016/j.solmat.2021.110979
Dong, C., Cairney, J., Sun, Q., Maddan, O. L., He, G., and Deng, Y. (2010). Investigation of Mg(OH)2 Nanoparticles as an Antibacterial Agent. J. Nanopart Res. 12 (6), 2101–2109. doi:10.1007/s11051-009-9769-9
Fruhwirth, O., Herzog, G. W., Hollerer, I., and Rachetti, A. (1985). Dissolution and Hydration Kinetics of MgO. Surf. Technol. 24 (3), 301–317. doi:10.1016/0376-4583(85)90080-9
Gilardi, T., Rodriguez, G., Gomez, A., Leybros, J., Borgard, J., Carles, P., et al. (2006). “Influence of Material Choice on Cost Estimation of Some Key Components of the Sulfur Iodine Thermochemical Process,” in Proc. of 16th World Hydrogen Energy Conference (WHEC), 13-16 June 2006 (Lyon, France: Association Francaise pour l'Hydrogene et les Piles a Combustible AFHYPAC), 13–16.
Gonzalez, M., Faulkner, E., Zhang, C., Choi, S., and Simpson, M. F. (2020). Electrochemical Methods for Analysis of Hydroxide and Oxide Impurities in Li, Mg/Na, and Ca Based Molten Chloride Salts. ECS Trans. 98 (10), 161–169. doi:10.1149/09810.0161ecst
Grégoire, B., Oskay, C., Meißner, T. M., and Galetz, M. C. (2020). Corrosion Mechanisms of Ferritic-Martensitic P91 Steel and Inconel 600 Nickel-Based Alloy in Molten Chlorides. Part II: NaCl-KCl-MgCl2 Ternary System. Sol. Energy Mater. Sol. Cells 216, 110675. doi:10.1016/j.solmat.2020.110675
Guo, J., Hoyt, N., and Williamson, M. (2021). Multielectrode Array Sensors to Enable Long-Duration Corrosion Monitoring and Control of Concentrating Solar Power Systems. J. Electroanal. Chem. 884, 115064. doi:10.1016/j.jelechem.2021.115064
Kashani-Nejad, S., Ng, K.-W., and Harris, R. (2005). MgOHCl Thermal Decomposition Kinetics. Metall Materi Trans B 36 (1), 153–157. doi:10.1007/s11663-005-0015-2
Kashani-Nejad, S. (2005). Oxides in the Dehydration of Magnesium Chloride Hexahydrate. Montreal, Canada: McGill University. Thesis.
Kipouros, G. J., and Sadoway, D. R. (2001). A Thermochemical Analysis of the Production of Anhydrous MgCl2. J. Light Metals 1 (2), 111–117. doi:10.1016/S1471-5317(01)00004-9
Klammer, N., Engtrakul, C., Zhao, Y., Wu, Y., and Vidal, J. (2020). Method to Determine MgO and MgOHCl in Chloride Molten Salts. Anal. Chem. 92 (5), 3598–3604. doi:10.1021/acs.analchem.9b04301
Kurley, J. M., Halstenberg, P. W., McAlister, A., Raiman, S., Dai, S., and Mayes, R. T. (2019). Enabling Chloride Salts for Thermal Energy Storage: Implications of Salt Purity. RSC Adv. 9 (44), 25602–25608. doi:10.1039/c9ra03133b
Mehos, M., Turchi, C., Vidal, J., Wagner, M., Ma, Z., Ho, C., et al. (2017). Concentrating Solar Power Gen3 Demonstration Roadmap. Golden, CO (United States): United States: National Renewable Energy Lab.NREL.
Randles, J. E. B. (1948). A Cathode Ray Polarograph. Part II.-The Current-Voltage Curves. Trans. Faraday Soc. 44, 327–338. doi:10.1039/tf9484400327
Schenin-King, J., and Picard, G. (1993). “Oxoacidity Effect on Metallic Oxide Dissolution Reactions in Fused Chlorides,” in Retrospective Collection: Trans Tech Publ) (Durnten, Switzerland: Publisher and Materials Science and Enginerring), 13–24.
Ševčík, A. (1948). Oscillographic Polarography with Periodical Triangular Voltage. Collect. Czechoslov. Chem. Commun. 13, 349–377.
Skar, R. A. (2001). Chemical and Electrochemical Characterisation of Oxide/hydroxide Impurities in the Electrolyte for Magnesium Production. Trondheim, Norway: Norwegian University of Science and Technology Fakultet for naturvitenskap og teknologi.
Song, J., Huang, X., Fan, Y., Yi, J., Shu, Y., and He, J. (2018). In Situ Monitoring of O2−Concentration in Molten NaCl-KCl at 750°C. J. Electrochem. Soc. 165 (5), E245–E249. doi:10.1149/2.1101805jes
Sun, H., Wang, J.-Q., Tang, Z., Liu, Y., and Wang, C. (2020). Assessment of Effects of Mg Treatment on Corrosivity of Molten NaCl-KCl-MgCl2 Salt with Raman and Infrared Spectra. Corros. Sci. 164, 108350. doi:10.1016/j.corsci.2019.108350
Sun, H., Wang, J., Li, Z., Zhang, P., and Su, X. (2018). Corrosion Behavior of 316SS and Ni-Based Alloys in a Ternary NaCl-KCl-MgCl2 Molten Salt. Sol. Energy 171, 320–329. doi:10.1016/j.solener.2018.06.094
Turchi, C. S., Vidal, J., and Bauer, M. (2018). Molten Salt Power Towers Operating at 600-650 °C: Salt Selection and Cost Benefits. Sol. Energy 164, 38–46. doi:10.1016/j.solener.2018.01.063
Villada, C., Ding, W., Bonk, A., and Bauer, T. (2021). Engineering Molten MgCl2-KCl-NaCl Salt for High-Temperature Thermal Energy Storage: Review on Salt Properties and Corrosion Control Strategies. Sol. Energy Mater. Sol. Cells 232, 111344. doi:10.1016/j.solmat.2021.111344
Williams, T., Shum, R., and Rappleye, D. (2021). Review-Concentration Measurements in Molten Chloride Salts Using Electrochemical Methods. J. Electrochem. Soc. 168 (12), 123510. doi:10.1149/1945-7111/ac436a
Zhang, M., Ge, J., Yin, T., and Zhang, J. (2020). Redox Potential Measurements of Cr(II)/Cr Ni(II)/Ni and Mg(II)/Mg in Molten MgCl2-KCl-NaCl Mixture. J. Electrochem. Soc. 167 (11), 116505. doi:10.1149/1945-7111/aba15a
Keywords: MgOHCl concentration measurement, direct titration, cyclic voltammetry, corrosion control, next-generation concentrating solar power
Citation: Gong Q, Ding W, Chai Y, Bonk A, Steinbrecher J and Bauer T (2022) Chemical Analysis and Electrochemical Monitoring of Extremely Low-Concentration Corrosive Impurity MgOHCl in Molten MgCl2–KCl–NaCl. Front. Energy Res. 10:811832. doi: 10.3389/fenrg.2022.811832
Received: 09 November 2021; Accepted: 10 May 2022;
Published: 22 June 2022.
Edited by:
Xiaohui She, University of Birmingham, United KingdomReviewed by:
Yafei Wang, University of Wisconsin-Madison, United StatesBrenda Garcia-Diaz, Savannah River National Laboratory (DOE), United States
Zhu Jiang, Southeast University, China
Zhongfeng Tang, Shanghai Institute of Applied Physics (CAS), China
Copyright © 2022 Gong, Ding, Chai, Bonk, Steinbrecher and Bauer. This is an open-access article distributed under the terms of the Creative Commons Attribution License (CC BY). The use, distribution or reproduction in other forums is permitted, provided the original author(s) and the copyright owner(s) are credited and that the original publication in this journal is cited, in accordance with accepted academic practice. No use, distribution or reproduction is permitted which does not comply with these terms.
*Correspondence: Qing Gong, cWluZy5nb25nQGRsci5kZQ==; Wenjin Ding, d2VuamluLmRpbmdAZGxyLmRl