 Haibin Zhou1
 Zhicheng Xie
94% of researchers rate our articles as excellent or good
Learn more about the work of our research integrity team to safeguard the quality of each article we publish.
Find out more
ORIGINAL RESEARCH article
Front. Energy Res., 08 April 2022
Sec. Smart Grids
Volume 10 - 2022 | https://doi.org/10.3389/fenrg.2022.809127
This article is part of the Research TopicAdvanced Digital Technologies in Digitalized Smart GridView all 13 articles
The on-load tap changer (OLTC) is one of the key components of converter transformer. The energy generated during tap switching process of the OLTC will cause thermal expansion and surging of the insulating oil in the chamber, resulting in the mis-operation of protective relay and threatening the safe and stable operation of the power system as well. Therefore, taking the typical dual-transition resistance-type OLTC as an example, a numerical modeling method of OLTC oil flow surging based on the realizable k-ε model is proposed, and the fluid simulation model is established based on the FLUENT software. The quantitative relationship between the OLTC transition resistance value and the oil velocity and oil pressure at the top of the oil chamber is analyzed, that is, the smaller the transition resistance, the greater the oil flow velocity and oil pressure during switching. In addition, an equivalent experimental platform is built to carry out the static action characteristic experiment of OLTC oil flow relay, the corresponding relationship between the change range of oil pressure at the top of the chamber, and the oil velocity under typical value (1.5 m/s, 2.0 m/s, and 2.5 m/s) are revealed. Based on which, the optimization suggestions on the protection relay threshold configuration of OLTC oil velocity and oil pressure are put forward.
On-load tap changer (OLTC) is one of the key components of converter transformer, which plays the role of compensating power grid voltage change and optimizing the control angle. The OLTC of a converter transformer has a wide voltage regulation range, has frequent operation, has a high recovery voltage during voltage regulation, and bears severely working conditions such as harmonics. Therefore, its fault rate is higher than that of a AC power transformer (Zhu and Shen, 2012; Zhu and Shen, 2016).
The OLTC is composed of a tap selector and changer switch, whose position in the converter transformer is shown in Figure 1. The tap selector connects the tap in advance according to the tap sequence and makes it bear continuous load. The changer switch is placed in a separate oil chamber and can transfer the load current between different taps. Besides, the OLTC has a separate conservator, and the pipeline from the oil chamber to the conservator has a protective relay (oil flow velocity relay and oil pressure relay).
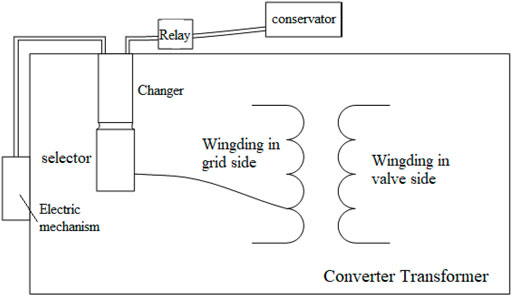
FIGURE 1. Location diagram of the OLTC in the converter transformer.
During tap changing, the insulating oil in the chamber will be heated, expanded, and surged by the energy generated from arc breaking. Normally, the two relays should send alarm/trip signals at the same time or within a certain period of time (may be milliseconds). Actually, there have been many cases of relay malfunctions, especially oil flow velocity relay. However, it can only modify the protection setting value based on experience to deal with the mis-operation case, due to a lack of mechanism research (Liang et al., 2016).
The oil flow surging is related to the energy generated during the tap changing process, the volume of the oil chamber, the height difference between the oil chamber and the conservator, and the diameter of the pipe.
For the operation characteristics and fault diagnosis of the OLTC, scholars have carried out extensive research. In terms of OLTC operation characteristics analysis, electromagnetic transient simulation research has been carried out for the switching process of the OLTC, and quantitative analysis has been obtained from the two aspects of amplitude and phase. The particularity of the operating conditions of the commutator tap changer is revealed, and the technical points of the selection of the commutator tap changer are proposed (Lei et al., 2018; Fan et al., 2018). Yang et al. (2014) simulated the action process of the mechanical OLTC and that with power electronic devices, and calculated the energy loss in the process of on-load voltage regulation under the two modes. A new hybrid on-load tap changer scheme has been given by Shi (2015) and a 110-/35-kV single-phase on-load tap changer model has been built. The feasibility of the proposed scheme is further verified by simulating the transient characteristics of the primary side in the switching process. A new on-load tap changer, which triggers the thyristor circuit through overvoltage and realizes the switching process of uninterrupted current has been proposed by Li (2017). Shen et al. (2015) improved the on-load tap changer of the double transition resistance branch triggered by micro-arc and established a new model of active trigger combined with the double transition resistance branch. Rivas-Trujilo et al. (2010) proposed a modeling structure of on-load tap changer based on the arc model. In each operation of the tap changer, there are a series of switching events with specific timings, and these switching operations are modeled according to the accuracy of the proposed on-load tap changer model that is verified by the measurement of results obtained from computer simulations and the on-load tap changer operation real-time test. Castro et al. (2017) puts forward the measurement method of the on-load tap changer current during transformer operation, and models and simulates the transformer and on-load tap changer in ATP-draw.
In terms of OLTC fault diagnosis, the abnormal physical information of on-load tap changer before and after fault occurrence has been discussed, the joint mapping relationship between the vibration sound and arc has been revealed (Seo et al., 2018), and the joint detection technology has been based on the vibration sound fingerprint and driving motor current (sound and electricity) (Yu et al., 2020), acyclic graph support vector machine fault diagnosis model (Xu et al., 2019), arc detection method of on-load tap changer based on energy conservation principle (Song et al., 2019a), fault identification method based on the multi-resolution feature extraction algorithm, and the genetic optimization support vector machine (Duan et al., 2017). Some scholars have explored the cooperation between OLTC oil flow surge and nonelectric protection by means of the equivalent test. For example, Xu et al. (2021) built a short-circuit arcing test platform and carried out the short-circuit arcing test, and put forward a proposal for the standardized configuration of on-load tap changer nonelectric protection device. Song et al. (2019b) carried out typical test analysis and research on the arc waveform generated by different types of changeover switches, which provided guidance for the optimal design of OLTC. Ding et al. (2016) compared and analyzed the differences of heavy gas protection setting values of different models of on-load tap changer and carried out the static action characteristic test on the gas relay of an on-load tap changer, so as to put forward suggestions on the threshold settings of the gas relay of large capacity transformers.
However, these studies were carried out on the basis of experiments, and the research conclusions have certain limitations. The quantitative mechanism research is insufficient, so it has not formed a unified conclusion. This article focuses on the key operation problems of an OLTC, that is, how to optimize the threshold of oil flow relay and oil pressure relay to ensure the correct action of protection, thus, the refined modeling, oil flow characteristic analysis, and protection threshold optimization are not only the difference between this article and the existing literature but also the key technical innovation of this article.
In this article, in Section 2, the mathematical simulation model of OLTC is established; in Section 3, the simulation result is analyzed, and besides the experimental method, the result is proposed; the change law of the oil speed and oil pressure at the top of the chamber when the OLTC operating under different transition resistances is analyzed, so as to provide guidance for the OLTC protection configuration.
Taking a double transition resistance type OLTC as the simulation object, of which the rated stage voltage is 4037 V and the rated current is 2 × 643 A. The complete tap changing process is shown in Figure 2, which includes two arc extinguishing processes (in step d and step f, respectively), and the breaking current, recovery voltage, and switching capacity of the two arc extinguishing processes are shown in Table 1.
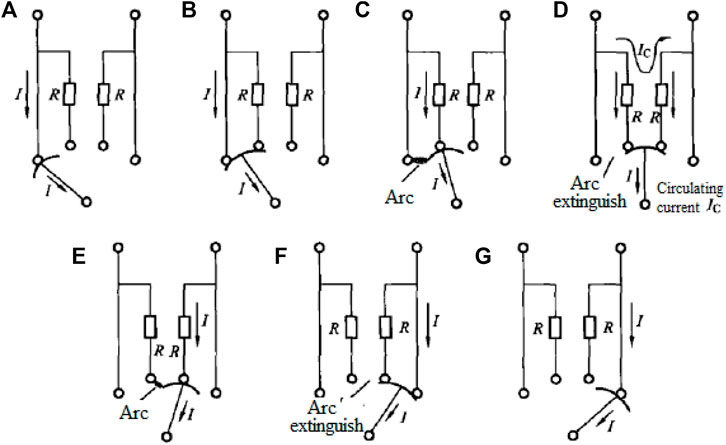
FIGURE 2. Switching process of dual-transition resistance-type OLTC.

TABLE 1. Characteristic variables in tap changing process of OLTC.
It can be seen from Table 1 that 1) the recovery voltage of the auxiliary contact is greater than that of the main contact; 2) the breaking current and the recovery voltage of the main contact is independent of the transition resistance R and the stage voltage, respectively, while those of the auxiliary contact are related to the transition resistance R and stage voltage.
In order to reduce the breaking capacity of the main contact, the value of transition resistance should be lower. However, in order to reduce the switching capacity of the auxiliary contact, the transition resistance value should be higher, in order to reduce the circulating current in the switching process. Therefore, the transition resistance shall be appropriate so that the recovery voltage can be withstood between the actual contacts, and the arc will not rekindle after it is extinguished when the main contact or transition contact is disconnected.
The transition resistance is generally selected according to the principle of minimizing the breaking capacity of the transition contact. The corresponding breaking capacity P1 of the main contact, the switching capacity P2 of the transition contact and the total breaking capacity P3 can be expressed as:
The relationship between the switching capacity P1 of the main contact and P2 of the auxiliary contact, total switching capacity P3, and coefficient n of transition resistance is shown in Figure 3.
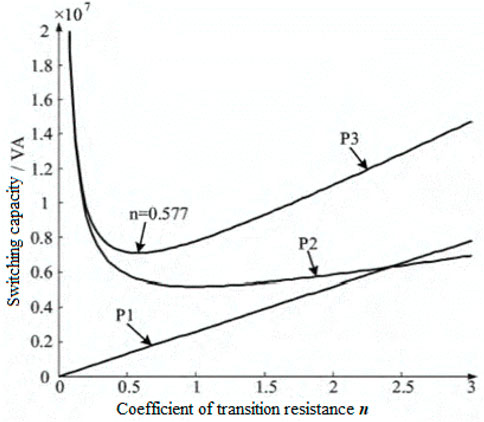
FIGURE 3. Relationship curve between capacity and transition resistance coefficient.
It can be seen that the transition resistance value has a great impact on the OLTC switching capacity. For the dual-transition resistance OLTC studied in this article, when the coefficient of transition resistance n = 0.577, the total switching capacity is the smallest, and when n = 1, the switching capacity of the main contact equals that of the transition contact.
Firstly, the 3D parameter of the OLTC is measured accurately, and the relative position of each component of the OLTC is drawn in AutoCAD according to the measurement results. Besides, taking the center of the calculation area as the model origin, each component is modeled and assembled by the ProE software.
The OLTC has a complex structure and a large number of components, which is a great challenge to modeling. Therefore, this article proposes an optimization modeling method:
1) In the process of switching, the moving contact and its fast mechanism swing between the two diaphragms, where the flow mainly occurs. Therefore, all structures outside the diaphragms are removed during modeling.
2) Because the movement of the tension spring at the lower part of the moving contact is difficult to simulate, while it has little effect on the transformer oil flow caused by the switching process, all the tension springs at the lower part of the moving contact are therefore removed during modeling.
3) The quick mechanism of transition contact is connected with that of the main contact through the connecting rod mechanism. During the numerical simulation, if the modeling is based on the actual structure, the motion equations of the main contact, transition contact, contact quick mechanism and connecting rod mechanism will become very complex, and the structure has little effect on the transformer oil flow caused by the switching process. Therefore, the connecting rod mechanism is removed during the modeling, The motion equation of the main contact, the transition contact and the fast mechanism are comprehensively determined according to the contact structure of the dynamic and static contacts, the structure of the fast mechanisms, and the current change law in the switching process, such that it can simulate the motion of the moving contact and its fast mechanism in the switching process.
4) The movement speed of the driving mechanism is much smaller than that of the changeover switch, and its influence on the flow of transformer oil is far less than that of the changeover switch. Therefore, the action of the driving mechanism is not considered in modeling.
In the process of switching, when the moving and static contacts are separated from contact, the main contact and transition contact not only rotate with their own rapid mechanism but also rotate around their own rotating shaft under the action of the spring at the bottom of the contact. Therefore, it is necessary to determine the process from contact to separation of the dynamic and static contacts in order to ensure normal operation of the numerical simulation. According to the structure of on-load tap changer provided by the actual converter station and the field measured results, the separation process of the dynamic and static contacts of the main contact and transition contact is finally determined as follows:
1) During the switching process, the main contact quick mechanism rotates a total of 28° (14° on one side), and the rotation angle of its moving contacts during the separation of the moving and static contacts is 26°. According to the structure of the main contact, it is assumed that both the active contact and the fast mechanism rotate at a uniform speed around their respective rotating axes. When the active contact rotates 26°, the fast mechanism rotates 5.42°, that is, when the fast mechanism of the main contact rotates 1°, the moving contact rotates 4.8°, and after the fast mechanism of the main contact rotates 8.58°, the moving contact begins to contact with the static contact. Figure 4 schematic diagram of the process from the contact to the initial separation of the moving and stationary contacts of the main contact. The process from the initial separation position to the contact is opposite to this process.
2) The transition contact quick mechanism rotates 34° in total during the switching process, and the rotation angle of its moving contact during the separation of the moving and static contacts is 24°. According to the structure of the transition moving and static contacts, when the transition moving contact rotates 24°, its fast mechanism rotates 12°, that is, when the transition contact fast mechanism rotates 1°, its moving contact rotates 2°, and after the transition contact fast mechanism rotates 22°, its moving contact begins to contact with the static contact. Figure 5 shows the process diagram of the dynamic and static contacts of the transition contact from the initial contact to full contact (left transition contact). The process from contact to separation is the opposite.
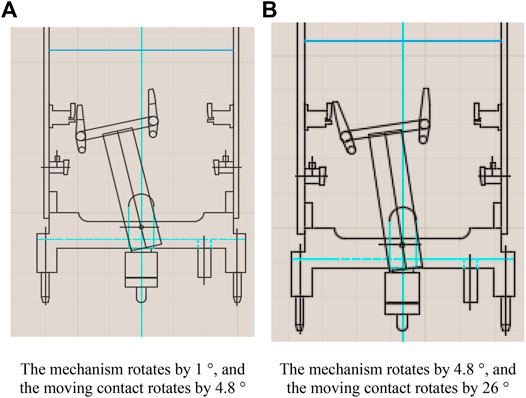
FIGURE 4. The dynamic and static contacts of the main contact are from contact to separation. (A) The mechanism rotates by 1°, and the moving contact rotates by 4.8°. (B) The mechanism rotates by 4.8°, and the moving contact rotates by 26°
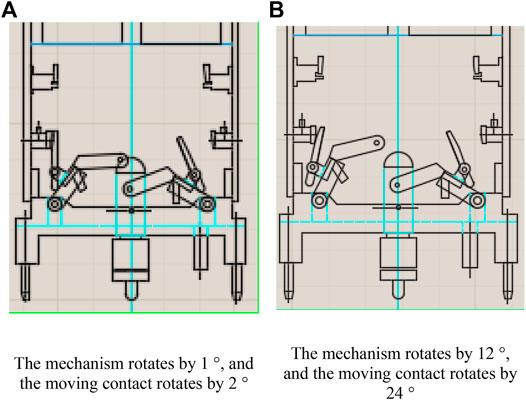
FIGURE 5. The contact process of dynamic and static contact of transition contact. (A) The mechanism rotates by 1°, and the moving contact rotates by 2°. (B) The mechanism rotates by 12°, and the moving contact rotates by 24°
The whole and contacts modeling results of the OLTC are shown in Figures 6, 7, respectively.
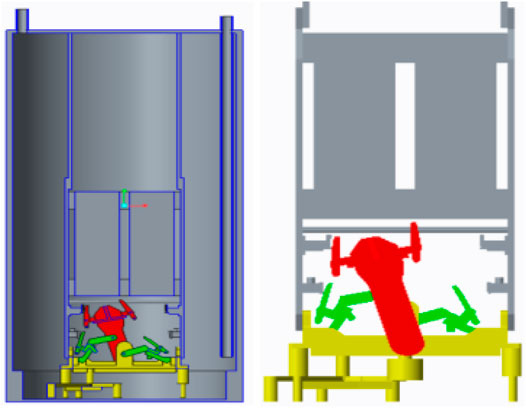
FIGURE 6. Integral model of the OLTC.
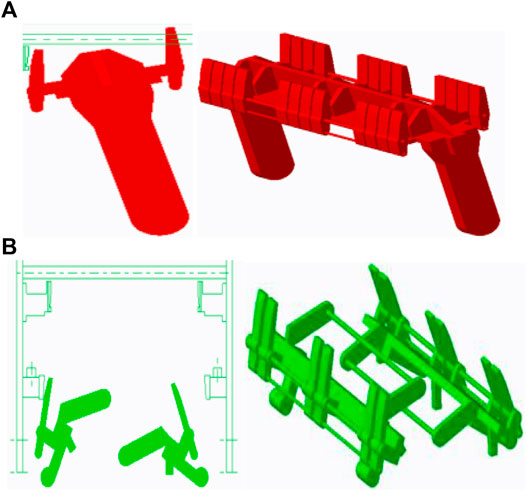
FIGURE 7. Model of contacts and its fast mechanism. (A) Model of the main contact and its fast mechanism. (B)Model of the auxiliary contact and its fast mechanism.
In Figure 6, the two circular pipes on the upper part of the changer are oil flow in–out ports of the on-line oil filter, whose diameters are both 25 mm. Among that, the right part is the in port of oil flow, and its pipe extends into the changer cylinder for 1.15 m; the left part is the out port of oil flow, while its pipe does not extend into the changer cylinder.
The flow field of oil chamber is simulated by realizable k-ε model (Wang, 2004; Wen, 2010), which is improved based on the standard k-ε model, that is, the k equation remains unchanged, while the equation of dissipation rate ε and the eddy viscosity equation are improved mainly. The corresponding transport equation is:
where
The generation term of the dissipation rate ε in Equation 5 (the second term on the right) does not include the turbulent kinetic energy
The viscosity coefficient formula is
where
For the action of the OLTC, the swing arm will form many vortices, and the improved model has high reliability and accuracy in the flow field simulation.
One of the key factors for fluid computing is the quality of the computational grid. Actually, the structure of the OLTC is extremely complex, including a large amount of transition area of large space and local irregular small areas. Therefore, how to mesh the transition areas becomes very important.
To meet the requirement of the complex geometric model of the oil chamber, the unstructured tetrahedral grid with strong adaptability to complex boundaries is adopted (Baker and Ying, 1994), whose grid distortion rate is less than 0.6, and the total number of grids is 22.68 million. Figure 8 shows the overall grid of the OLTC. The grid at the contact between the moving and static contacts of the main contact and the transition contact has been densified.

FIGURE 8. Overall grid of OLTC.
Among them, the maximum volume grid scale of the computational domain is 24 mm; since the gap between the moving and stationary contacts is only 1 mm at the beginning and end of the switching process, the grid scale of the corresponding moving and stationary contact surface is set to 0.5 mm, and the grid of the adjacent surface is set to 1 mm; for the quick mechanism of the main contact and transition contact, the face grid adjacent to the main contact, transition contact, and rotating shaft is set as 2 mm, and the other face grids are set as 4 mm; for the switch base, the face grid adjacent to the rotating shaft is set as 2 mm, and the other face grids are set as 4 mm; for the transition resistance, since the distance between the resistance and the isolation plate is 5.7 mm, the front and rear surface grid is set as 4 mm, and the grid between the four sides and the tightening bolt surface is set as 2 mm; due to the large area of the two diaphragms and insulating cylinder, the grid scale of the outer wall of the diaphragm and the inner wall of the insulating cylinder is set to 16 mm to reduce the number of grids. At the same time, in order to take into account the calculation accuracy and the number of grids, the surface grid scale of the inner wall of the diaphragm (surface mounted static contact) is set to 8 mm.
During the switching process of the OLTC, the movement of the contact will change the flow domain, and the motion of the boundary will also change along with time. The motion form of boundary is predefined through User-Defined-Function (UDF), and its angular velocity is specified before calculation. The updating process of the mesh is completed automatically according to the change in boundary at each iteration step. Because the displacement of the moving boundary is much larger than the grid size, to avoid the grid with negative values, or the calculation that does not converge due to excessive grid distortion, the grids with excessive distortion rates or excessive size changes are concentrated together and redivided in the calculation process, to meet the requirements of the distortion rate and size.
Normally, the OLTC is placed in a sealed cylinder filled with insulating oil. Therefore, the calculation area is set to be filled with transformer oil (#25), with oil pressure of 100 kP A and oil temperature of 40°C. The oil density is 895 kg/m3, the dynamic viscosity is 0.97 kg/(ms), the thermal conductivity is 0.128 W/(mK), and the specific heat capacity at constant pressure is 1.8 kJ/(kgK). Owing to the high density of the insulating oil, the influence of its own gravity should be considered in numerical simulation. Each solid wall is set as an adiabatic nonslip boundary, without the consideration of the influence of wall roughness.
The OLTC switching sequence diagram is shown in Figure 9. The total flow duration T during the switching process is about 44 ms.
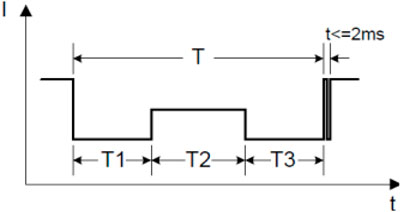
FIGURE 9. Switching sequence diagram of OLTC.
The active contact not only moves with the fast mechanism but also rotates around its own rotating shaft when the moving contact starts to contact with the static contact. Similarly, assuming that the moving contact rotates at a uniform speed around its own rotating shaft, it has been determined during modeling that when the fast mechanism rotates 1°, the moving contact rotates 4.8° around its own rotating shaft. Therefore, it can be calculated that the angular speed of the moving contact rotating around its own rotating shaft is 1872°/S = 3.1416 rad/s.
The fast mechanism of transition contact rotates 22° in the noncontact stage of dynamic and static contacts, and its angular speed is 774.65°/S = 6.76 rad/s; in the contact stage, it rotates 12°, and its angular velocity is 76.5°/S = 2.413 rad/s; in the contact stage, when the fast mechanism of the transition contact rotates by 1°, the moving contact rotates by 2° around its own rotating shaft. Therefore, the angular speed of the transition moving contact rotating around its own rotating shaft is 553°/S = 4.826 rad/s.
According to the test report, the arcing time does not exceed 12 ms, with an average of 6 ms. According to OLTC stage voltage and rated current, AC arc energy during switching can be calculated by:
where
where,
The main contact and transition contact of the OLTC are swing rod devices with one end fixed, then the value of
where
The arcing current is the periodic current, which can be expressed by:
Putting Equations 8–10 into Equation 7, we get:
The arcing energy can be obtained by integrating Equation 11 in the arcing time.
Figure 10A shows the velocity field and pressure field at the section 11 mm away from the cylinder's center before OLTC action, after the calculation of unsteady flow field converges.
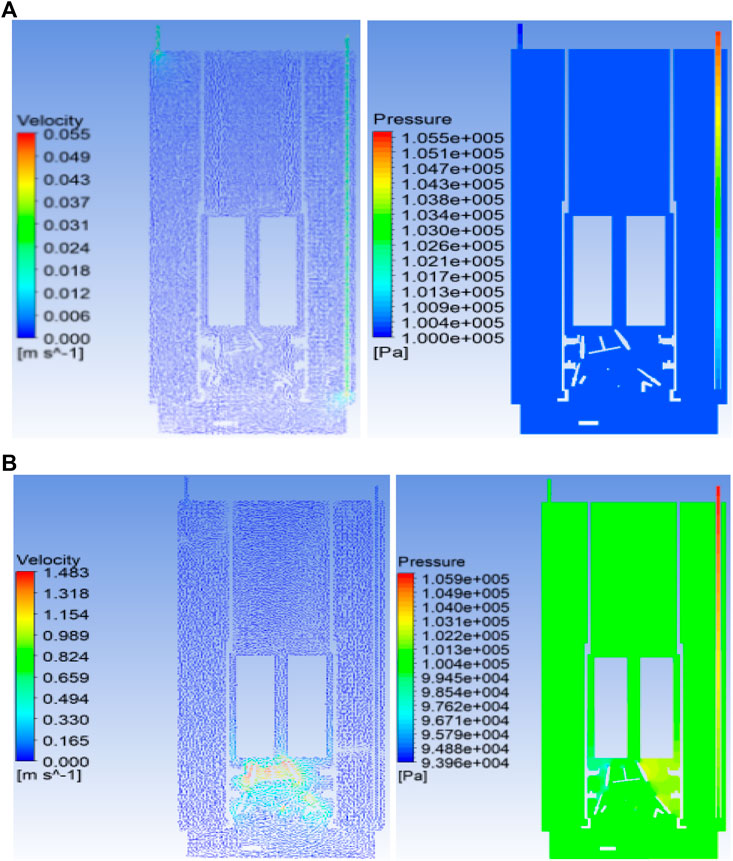
FIGURE 10. Velocity field and pressure field of OLTC. (A) Velocity field and pressure field before action. (B) Velocity field and pressure field before arcing.
Before switching, the flow in the switch cylinder is smooth, the speed is very low, and the maximum speed is just about 0.055 m/s. The oil pressure in the cylinder is basically the same and that on the cylinder's wall is about 100.4 kPa. The temperature difference in the whole cylinder is very small, only 0.5°C.
Figure 10B shows the velocity field and pressure field at the central section of the oil barrel of the OLTC before the arc energy of the main contact is added, after the moving contact and fast mechanism act for 13.9 ms.
Before adding the arcing energy of the main contact, the oil flow rate near the moving contact and the fast mechanism increases obviously, but the flow in other areas is still gentle and the flow rate is very low. The oil pressure on the cylinder wall changes little, about 100.6 kPa. The temperature difference in the whole cylinder is very small, only 1.8°C. It shows that the influence of switching action on the flow field in the cylinder is mainly concentrated near the moving contact and fast mechanism.
After the stage voltage and rated current are determined, the transition resistance has the greatest impact on the OLTC breaking performance.
The different transition resistance coefficients are selected, the arcing energy of the main contact, arcing energy of the transition contact, and total arcing energy under various working conditions according to Equation 11 are calculated, and the arcing time is then set as 10 ms. Based on the OLTC simulation model, the oil pressure and oil flow velocity of insulating oil in the oil chamber under different transition resistance values are obtained. The results are summarized in Table 2.
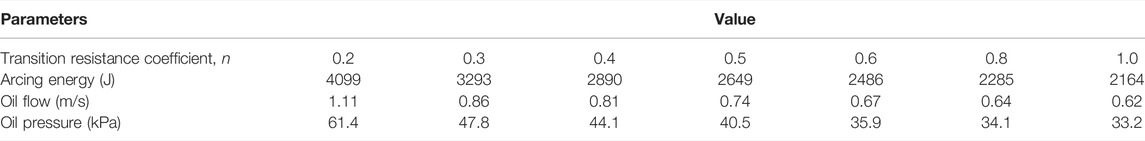
TABLE 2. Oil flow velocity and oil pressure under different transition resistors.
Through the correlation analysis of the transition resistance coefficient, the arcing energy, oil flow, and oil pressure data are shown in Table 2, and it can be found that the correlation coefficients of transition resistance coefficient–arcing energy, transition resistance coefficient–oil flow, and transition resistance coefficient–oil pressure are −0.89, −0.86, and −0.87, respectively, showing a negative correlation. The correlation coefficients of both the arcing energy–oil flow and arcing energy–oil pressure are 0.99, indicating that the effect of arcing energy on oil flow and oil pressure is basically linear. The correlation coefficient between oil flow and oil pressure is 0.99, that is, the quantitative relationship between them can be expressed by a linear function.
The oil pressure and oil flow speed of insulating oil in the switch oil chamber during OLTC switching under different loads are shown in Table 3.

TABLE 3. Oil flow velocity and oil pressure under different loads.
It can be seen from Table 3 that the arcing energy of the main contact, the arcing energy of the transition contact, and the total arcing energy increase with the increase of the load, and result in the increase of oil flow and oil pressure with the increase of the load. When the load is 1.2 times the rated load, the oil flow speed reaches 1.13 m/s, which is close to the preset 1.5 m/s. Since the gasification of transformer oil caused by arcing is not considered in the simulation, the actual oil flow velocity should be higher than that of the numerical simulation, so it is necessary to consider increasing the setting value of oil flow relay.
Select different T1, T2, and T3 to simulate the changes of oil flow speed and pressure in the oil chamber of the transfer switch when the on-load tap changer is switched under various combinations, as shown in Table 4.
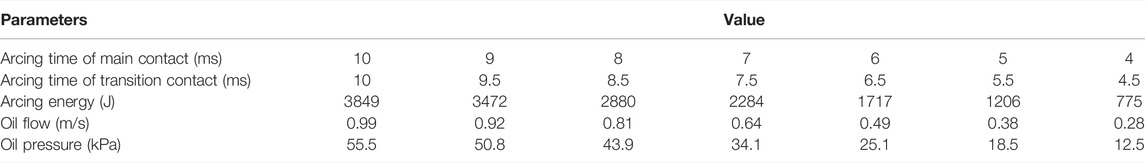
TABLE 4. Oil flow velocity and oil pressure under switching times.
It can be seen from Table 4 that different switching times lead to differences in arc energy, but the oil flow speed and oil pressure increase with the increase of arc energy.
The curve drawn according to the above simulation data is shown in Figure 11.
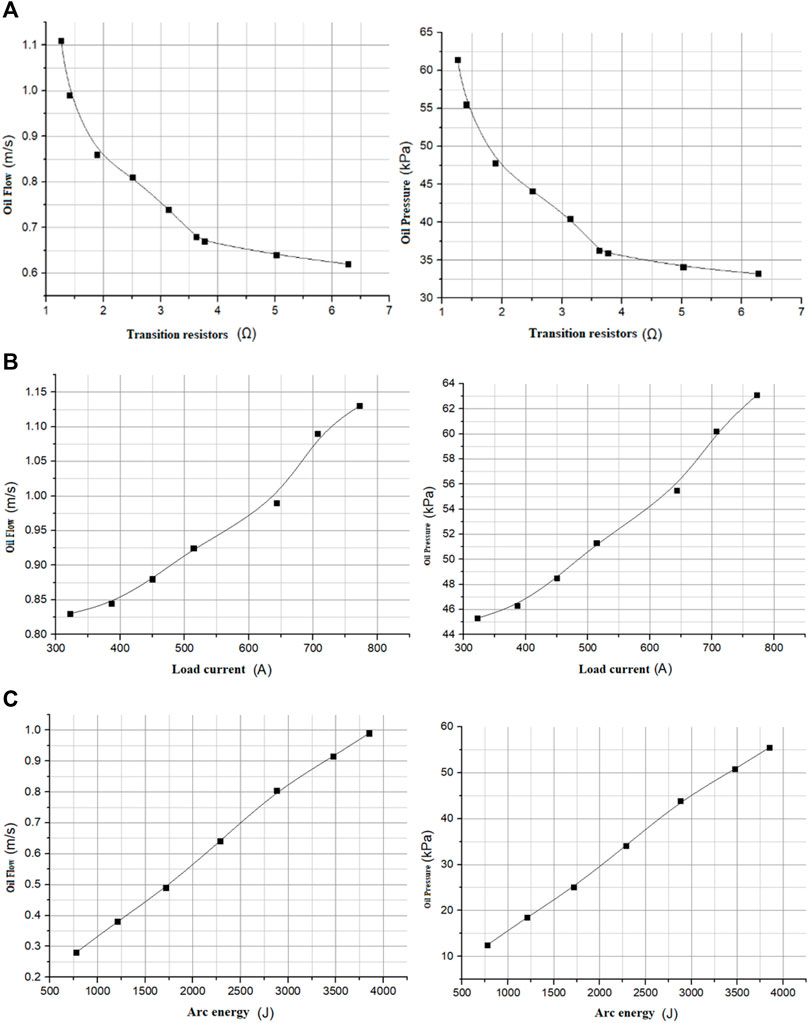
FIGURE 11. Variation curve of oil flow and oil pressure with transition resistance, load and total arc energy. (A) Variation curve of oil flow and oil pressure with transition resistance. (B) Variation curve of oil flow and oil pressure with load. (C) Variation curve of oil flow and oil pressure with total arc energy.
It can be seen that the smaller the transition resistance, the greater the oil flow speed and oil pressure; the greater the load, the greater the oil flow speed and oil pressure; and the greater the arcing energy, the greater the oil flow velocity and oil pressure.
For the OLTC with both oil flow relay and pressure relay, to match the threshold values of the two relays, it is also necessary to carry out the static action characteristic experiment of oil flow relay, to further analyze the corresponding relationship between oil flow and oil pressure. The test principle is shown in Figure 12.
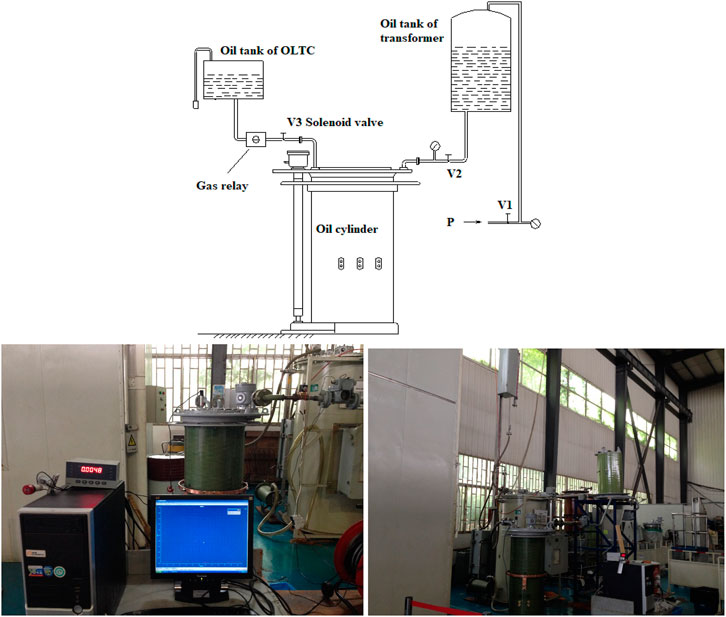
FIGURE 12. Schematic diagram and physical picture of oil flow relay experiment.
A certain pressure is applied to the oil chamber of the OLTC, to simulate the rise of the internal pressure of the oil chamber under OLTC failure, and then the solenoid valve installed in the oil flow relay pipeline is opened to release the pressure immediately, to make the insulating oil surge. Test the action of the oil flow relay to obtain the corresponding relationship between the internal pressure value of the oil chamber and the action of the oil flow relay. Meanwhile, according to the successive approximation principle, the critical pressure threshold of the oil flow relay is defined, which provides a criterion for the OLTC to select appropriate protective relays.
Three different types of oil flow relays from the same manufacturer with speed threshold values of 1.5 m/s, 2.0 m/s, and 2.5 m/s are used for the comparative experiment. The action pressure range and action percentage are shown in Table 5.
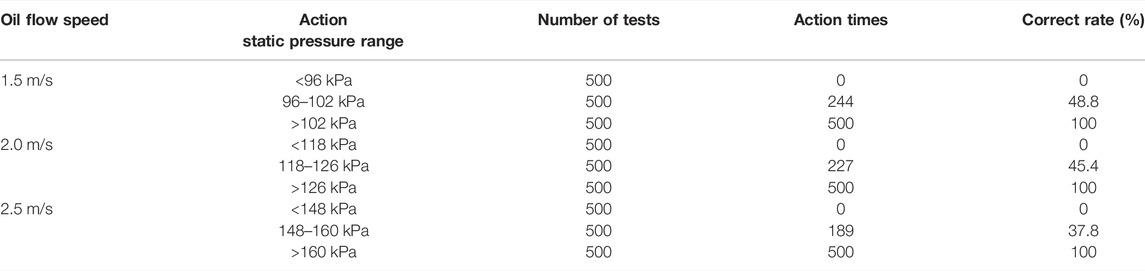
TABLE 5. Results of oil flow relay static pressure test.
It can be seen that by increasing the applied pressure value continuously, the correct rate of oil flow relay action is gradually improved, and finally 100% correct action is achieved. Therefore, we can obtain the reliable operating pressure range of the above three oil flow relays, that is, the oil pressure range of the three oil flow relays (1.5 m/s, 2.0 m/s, and 2.5 m/s) are 96–102 kPa, 118–126 kPa, and 148–160 kPa, respectively.
Therefore, if the oil flow relay of the converter transformer OLTC is one of the above three oil flow relays, the pressure threshold of the matched oil pressure relay can be set with reference to the above results. Otherwise, a similar test method is recommended.
In view of the problem that the oil flow surge caused by tap switching of the OLTC may cause protection mis-operation, taking the typical double transition resistance type OLTC as an example, the simulation analysis and experimental demonstration of the flow rate and pressure of the insulating oil in the oil chamber during the action of the tap changer were carried out in this article. The conclusion is as follows:
1) The smaller the transition resistance value of the OLTC, the greater the oil flow and pressure during switching. The effect of the arcing energy on oil flow and oil pressure is basically linear. And the quantitative relationship between oil flow and oil pressure can be expressed by linear function.
2) Through the experiment, it is found that the oil pressure corresponding to the oil speed of 1.5 m/s is 96–102 kPa, the oil pressure corresponding to the oil speed of 2.0 m/s is 118–126 kPa, and the oil pressure corresponding to the oil speed of 2.5 m/s is 148–160 kPa. If the oil flow relay of the converter transformer OLTC is one of the above three oil flow relays, the pressure threshold of the matched oil pressure relay can be set with reference to the above results.
The following work of this paper will analyze more types of OLTC and summarize a unified protection configuration method.
The original contributions presented in the study are included in the article/Supplementary Material, further inquiries can be directed to the corresponding author.
HZ, ZX and JD contributed to the establishment of OLTC and analysis; XC and QZ contribute to the experiment of the OLTC; GL and XY contributed to the simulation of OLTC oil flow characteristics.
This work is sponsored by the National Natural Science Foundation of China (No. 52007011).
Authors HZ, ZX, and JD were employed by the company Extra-High Voltage Transmission Company of China Southern Power Grid. Authors XC and QG were employed by the company Shenyang Transformer Research Institute Co. Ltd.
The remaining authors declare that the research was conducted in the absence of any commercial or financial relationships that could be construed as a potential conflict of interest.
All claims expressed in this article are solely those of the authors and do not necessarily represent those of their affiliated organizations, or those of the publisher, the editors, and the reviewers. Any product that may be evaluated in this article, or claim that may be made by its manufacturer, is not guaranteed or endorsed by the publisher.
Baker, A. M., and Ying, S. (1994). “A Fixed Time Performance Evaluation of Parallel CFD Applications,” in Proc. ACM/IEEE Conf. Sup. (IEEE), 18–23. doi:10.1145/602770.602781
Castro, J. C., Lagos, G. S., and Gonzalez, O. A. (2017). Simulation and Measuring Transients in On-Load Tap Changers. IEEE Latin Am. Trans. 15, 1901–1907. doi:10.1109/TLA.2017.8071234
Ding, G., Zhen, C., Chen, Q., Tian, Y., Zhang, Y., and Yu, G. (2016). Experimental Study on Heavy Gas Setting Value of Domestic on Load Switch for Large Capacity Transformer. Transformer 3, 58–59. doi:10.19487/j.cnki.1001-8425.2016.03.015
Duan, X., Zhao, T., Li, T., Liu, J., Zou, L., and Zhang, L. (2017). Method for Diagnosis of On‐load Tap Changer Based on Wavelet Theory and Support Vector Machine. J. Eng. 2017, 2193–2197. doi:10.1049/joe.2017.0719
Fan, R., Fu, P., Tao, J., Gao, G., Song, Z., Huang, L., et al. (2018). Strategy Design and Transient Analysis of ITER PPEN Transformer On-Load Tap Changer during Converter Operation. J. Fusion Energ 37, 346–353. doi:10.1007/s10894-018-0203-0
Lei, Y., Zhao, L., Peng, Z., Bao, L., Yang, J., Zhang, X., et al. (2018). Switching Process Simulation and Type-Selection Technology of On-Load Tap Changer of Converter Transformer. Sou. Pow. Sys. Tech. 7, 14–19. doi:10.13648/j.cnki.issn1674-0629.2018.07.003
Li, X. (2017). A New Type of on Load Tap Changer and its Analysis. High. Vol. Elec. Appa. 4, 197–202. doi:10.13296/j.1001-1609.hva.2017.04.031
Liang, C., Wu, H., Xia, G., and Zhou, H. (2016). Analysis of Protective Action False Case of OLTC for Converter Transformer. Transformer 2, 61–63. doi:10.19487/j.cnki.1001-8425.2016.02.014
Rivas-Trujillo, E., Laniado-Jácome, E., San-Román, J. L., and Díaz, V. (2010). Characterizing the Diverter Switch of a Load Tap Changer in a Transformer Using Wavelet and Modal Analysis. Eng. Structures 32, 3011–3017. doi:10.1016/j.engstruct.2010.05.020
Seo, J., Ma, H., and Saha, T. K. (2018). On Savitzky-Golay Filtering for Online Condition Monitoring of Transformer On-Load Tap Changer. IEEE Trans. Power Deliv. 33, 1689–1698. doi:10.1109/TPWRD.2017.2749374
Shen, Y., Cao, N., Yang, S., and Ma, Y. (2015). Simulation of New Power Transformer Hybrid On-Load Tap Changer. Harbin, china: Coal Mine Machinery
Shi, L. (2015). Scheme and Simulation Research of a New on Load Tap Changer. [Dissertation]. Jinan, China: Shandong University doi:10.7666/d.Y2792775
Song, D., Ding, L., Dong, B., Fan, J., and Du, H. (2019a). Experimental Analysis and Research on Arcing Process of on Load Tap Changer with Different Topology. Adv. Tech. Elec. Eng. Ener. 12, 55–62.
Song, D., Ma, J., Ma, Y., Lin, H., and Liu, S. (2019b). Research on the Switching Arc Loss of On-Load Tap Changer. IEEE Access 7, 180793–180803. doi:10.1109/ACCESS.2019.2959790
Wang, F. (2004). Computational Fluid Dynamics Analysis - Principle and Application of CFD Software. Beijing: Chinese Electrical Press.
Xu, H., Wang, J., Liao, W., Shan, H., and Wang, J. (2021). Experimental Study on Optimal Configuration of Pressure Relief Device, Pressure and Oil Flow Relay of On-Load Tap-Changer. Transformer 10, 48–52. doi:10.19487/j.cnki.1001-8425.2021.10.008
Xu, Y., Zhou, C., Geng, J., Gao, S., and Wang, P. (2019). A Method for Diagnosing Mechanical Faults of On-Load Tap Changer Based on Ensemble Empirical Mode Decomposition, Volterra Model and Decision Acyclic Graph Support Vector Machine. IEEE Access 7, 84803–84816. doi:10.1109/ACCESS.2019.2925046
Yang, S., Zhu, N., Yu, Q., and Li, H. (2014). Simulation of on Load Voltage Regulation of Power Transformer Based on PSCAD/EMTDC. Elec. Tech. 2, 30–32. doi:10.3969/j.issn.1673-3800.2014.02.007
Yu, B., Yang, Z., Lin, H., Jin, Y., and Yang, Y. (2020). Discussion on Multi-Dimensional Diagnostic Technology Based on Fault of On-Load Tap-Changer. IOP Conf. Ser. Earth Environ. Sci. 495, 012008–012012. doi:10.1088/1755-1315/495/1/012008
Keywords: on-load tap changer, fluid simulation, oil flow surging, protection optimization, transformer
Citation: Zhou H, Xie Z, Chen X, Guan Q, Deng J, Liu G and Yan X (2022) Study on Oil Flow Surging and Protection Optimization for on Load Tap Changer of Converter Transformer. Front. Energy Res. 10:809127. doi: 10.3389/fenrg.2022.809127
Received: 04 November 2021; Accepted: 28 February 2022;
Published: 08 April 2022.
Edited by:
Dongqi Liu, Changsha University of Science and Technology, ChinaReviewed by:
Nasir Ahmed Algeelani, Al-Madinah International University, MalaysiaCopyright © 2022 Zhou, Xie, Chen, Guan, Deng, Liu and Yan. This is an open-access article distributed under the terms of the Creative Commons Attribution License (CC BY). The use, distribution or reproduction in other forums is permitted, provided the original author(s) and the copyright owner(s) are credited and that the original publication in this journal is cited, in accordance with accepted academic practice. No use, distribution or reproduction is permitted which does not comply with these terms.
*Correspondence: Zhicheng Xie, eGllemhpY2hlbmcwOTIxQGZveG1haWwuY29t
Disclaimer: All claims expressed in this article are solely those of the authors and do not necessarily represent those of their affiliated organizations, or those of the publisher, the editors and the reviewers. Any product that may be evaluated in this article or claim that may be made by its manufacturer is not guaranteed or endorsed by the publisher.
Research integrity at Frontiers
Learn more about the work of our research integrity team to safeguard the quality of each article we publish.