- 1Power and Energy Reliability Research Center, State Key Laboratory of Power Transmission Equipment and System Security and New Technology, Chongqing University, Chongqing, China
- 2State Grid Deyang Electric Power Supply Company, State Grid Sichuan Electric Power Company, Deyang, China
- 3China Electric Power Research Institute, State Grid Corporation of China, Beijing, China
The operational uncertainty of the power system is significantly increased by the high penetration of renewable energy and diversification of load behavior, which have aroused the novel research on stochastic steady-state security assessment (SSSA) urgently when the operational condition gets worse and contingency happens more frequently. First of all, a novel contingency analysis model has been proposed based on chance constrained optimal power flow (CCOPF) in this work, which is able to give a comprehensive consideration on conventional generator outage, uncertainty of system operation and load shedding of interruptible loads (ILs). Moreover, the proposed model is very practical and can be solved much efficiently by an iteration method so that the purpose of secure system operation after contingency can be better realized. Second, to further enhance the steady-state security of the system, a novel pricing method for ILs has been developed here. In addition, a composite contingency ranking index has been also established to reflect the severity of generator outage more accurately. Finally, extensive study results based on a modified IEEE-39 test system have demonstrated the validity of the proposed model, which can hold a good balance amongst security, economy, controllability, and maneuverability.
1 Introduction
In recent years, power fluctuation caused by high penetration of renewable energy and diversification of load behavior has significantly increased the operational security risk. Especially, system contingency occurred much more frequently during the golden development period of renewable generation (2015 Renewable Energy Data Book1), which means large-scale utilization of renewable energy has indeed given a remarkable rise to the frequency of system contingency to some extent. Meanwhile, the electric utilities tend to operate the system close to its limitation in context of liberalization market (Seyed Javan et al., 2013), together with constant growth of electricity consumption but delayed construction of power infrastructure, which further expose the operational security issues of the power system. Therefore, for a power system which has high percentage of uncertainties and deteriorated operational conditions, a novel stochastic steady-state security assessment (SSSA) method is urgently required to evaluate system security level much more accurately and to put forward reasonable measures to deal with potential contingency.
The contingency situations considered in SSSA generally contain the outage of the generator and branch (i.e., transmission line or transformer) (Sunitha et al., 2013; Varshney et al., 2016; Roberto and Patelli, 2018; Huang et al., 2019). Most studies focus on branch outage only (Sunitha et al., 2013; Varshney et al., 2016; Roberto and Patelli, 2018), some studies take both into consideration (Huang et al., 2019), but few studies mainly focus on generator outage (Eygelaar et al., 2018). However, compared to branch outage, much more tougher challenges are brought to operational security by generator outage because of its higher probability and much more serious influence (Eygelaar et al., 2018), especially in stochastic situations. Therefore, this paper concentrates on the impact of generator outage in stochastic SSSA.
As an important alternative to conventional fossil energy, wind power generation technology becomes relatively mature, which is much more suitable for large-scale development and operation; thus, it occupies a high percentage amongst the renewable energy. System spinning reserve has been sharply reduced as more conventional generators are replaced by wind turbines, which results in larger power shortage after generator outage. In most existing studies, power shortage can only be balanced by conventional generator adjustment with low cost (Duan and Zhang, 2014; Negnevitsky et al., 2015). However, rated capacity and ramp rate limit its applicable situation. Thus, some studies employed load shedding (Negnevitsky et al., 2015) or energy storage (Pudjianto et al., 2014) technology to deal with power shortage, but they hardly investigate from the perspective of SSSA. Meanwhile, the cost of energy storage is relative high in that the life cycle of energy storage is relatively short (Khodadoost Arani et al., 2019) and large-capacity storage technology is still not mature (Álvaro et al., 2019). Therefore, load shedding based on interruptible loads (ILs) is a great approach owing to its fast response speed and comparatively low cost.
A major feature of wind power generation is that the output power will change randomly in a large range (Zhu et al., 2018), which further exacerbates the fluctuation of the power shortage. Moreover, the uncertainties of wind generation and load (Ahmad et al., 2018) will result in probabilistic operational conditions, which means it is necessary to adopt stochastic methods for SSSA. These stochastic methods such as Monte Carlo Simulation (MCS) are still based on deterministic power flow (PF) models, which can be divided into a direct current (DC) model (Negnevitsky et al., 2015) and alternating current (AC) model (Sunitha et al., 2013; Duan and Zhang, 2014). The calculation speed of the DC model is relatively fast owing to its linear model. However, the information of bus voltage magnitude and branch reactive flow is neglected, which leads to relatively poor accuracy. Meanwhile, the nonlinear AC model can cover the system information comprehensively. The contingency analysis model can be also divided into a conventional probabilistic power flow (PPF) model and stochastic optimal power flow (OPF) model according to whether involving an optimal method or not. Inequality constraints in the latter model make control variables or state variables within or slightly exceed their limit, which can coordinate the security and economy of system operation. Therefore, the focus of this work is SSSA based on stochastic AC-OPF in combination with load shedding, whose characteristics will be introduced in detail in the following.
The stochastic OPF models generally include the probabilistic OPF (POPF) model (Jia and Zheng, 2017), robust OPF (ROPF) model (Yang et al., 2016), and chance constrained OPF (CCOPF) model (Roald et al., 2015; Roald and Andersson, 2018). The distributions of state variables and control variables can be obtained by the POPF model, while in ROPF, constraints must be satisfied in the worst operational scenario and the results of variables are intervals. The common inequality constraints in the POPF model are transformed into chance constraints in the CCOPF model, which allow system variables within or slightly exceed their limit to coordinate security and economy. Moreover, the results of the CCOPF model are deterministic, which is much more likely to be accepted by system operators. On the contrary, the results of POPF and ROPF are not deterministic, and the latter one probably leads to immeasurable cost. Therefore, CCOPF can be regarded as an optimization model that achieves a good balance amongst security, economy, and applicability of power system operation. To the author’s limited knowledge, few studies consider and discuss load shedding-based CCOPF (CCOPF-L), not even to mention making its results as evaluation indicators and response measures for SSSA.
To address the issues mentioned above, a novel SSSA model is proposed based on AC-CCOPF. The proposed model gives a comprehensive consideration of conventional generator outage, uncertainty of system operation, and load shedding of ILs, especially under stochastic situations, i.e., stochastic SSSA. The main contributions of this paper are threefold:
1) To take various operational factors into account and make it much more practical than the conventional DC model, a load shedding-based AC-CCOPF model for stochastic SSSA is proposed, and also, it can be solved efficiently by an iteration method with full use of probabilistic characteristics
2) To further enhance the steady-state security level after contingency, a novel pricing method for ILs is developed based on their contribution to system security, which can be treated as a preprocessing step for the proposed model mentioned above
3) To quantify the generator outage severity more accurately, a novel contingency ranking index to give a comprehensive consideration on the cost is established, which can better balance power shortage and the overload situation of branch MW flow/bus voltage magnitude after contingency
Moreover, there are some common advantages of the proposed CCOPF model for stochastic SSSA. First, the overload probability of operational parameters can be controlled after each contingency. Meanwhile, compared to deterministic SSSA, the CCOPF-based N-2 criterion makes a reasonable compromise between economy and security, where the N-1 criterion is not sufficient to guarantee the security while the N-2 criterion is too costly. In addition, the defense measures obtained by the proposed method have a great maneuverability even in stochastic situation.
The remaining sections of this article are organized as follows. Section 2 introduces several common stochastic SSSA methods. In Section 3, the stochastic SSSA method based on the CCOPF model with load shedding is formulated and its solving procedure is also presented. In Section 4, some comparisons are made among SSSA methods introduced in Section 2 and the proposed method. Finally, some conclusions are drawn in Section 5.
2 Traditional SSSA of Power System
SSSA focuses on whether the power system possesses an ability to reach a new secure steady state for a pre-selected contingency, which neglects the transient procedure in essence. The general framework of SSSA (Hatziargyriou et al., 1994) contains contingency definition, contingency analysis, and contingency ranking. Due to the existence of power fluctuations of wind generation and load consumption, it becomes necessary to adopt the stochastic method for contingency analysis, and a detailed process of stochastic SSSA is summarized in Figure 1.
As shown in Figure 1, the stochastic SSSA majorly consists of three steps, and their features are introduced. The first step determines the target contingencies, and the generator outage is selected here. The second step contains the core of stochastic SSSA, as well as more scenarios covered in it compared with deterministic SSSA. Actually, the contingency analysis constitutes the most central focus of this paper, which is presented in detail in this section and the next section. In addition, the sampling method for covering stochastic scenarios and the compositive ranking index to capture the system security comprehensively are also research focuses, and they will be introduced in Section 3.4 and Section 3.5, respectively. The last step is to evaluate the severity of predefined contingencies particularly and rank contingency based on the corresponding results of the second step.
First, all stochastic SSSA methods are based on the deterministic PF equations. The pre-contingency state of the system is the base case, in which there is no failure, while the wind generation and load consumption are both forecasted values. AC PF Eq. 1a at the base case are briefly introduced here. Assume that the total bus number in the power system is
where
We define that
where the symbol “
2.1 Stochastic SSSA by the Use of PPF-Based Generation Adjustment
Power shortage in traditional stochastic SSSA is mainly balanced by adjusting the output of conventional generators (Duan and Zhang, 2014), which can tackle power fluctuations by MCS. The participation factor
where
In essence, the calculation based on Eq. 4a can be regarded as PPF analysis, which is normally realized by repeating the deterministic PF calculation. Correspondingly, the stochastic SSSA method introduced in this section can be abbreviated as “PPF-G” in this article. However, the drawback of this method is that the adjustable power of generator output will be restricted by ramp rate and capability in practice, while the method in Section 3.2 with IL to balance the power mismatch can get rid of such restriction.
2.2 Stochastic SSSA by PPF Based Load Shedding
We assume that the maximum adjustment of each traditional generator after contingency was 3% (Polymeneas, 2015) of its output power at the base case due to its restricted adjustment ability, and the total adjustable power of generators
When
where
where
The adoption of the ILs to be cut in the PPF-L model can make the off-limit amplitude of the operating parameters after contingency smaller than that in the PPF-G model, and the consideration on a finite ramp rate of the generator makes SSSA results closer to the actual situation. However, the operating parameters could still exceed the limits in a few cases; especially, the off-limit probability is completely uncontrollable. Therefore, the POPF with consideration of load shedding is introduced in the following to balance the power vacancy, which keeps the operating parameters from violation after contingency.
2.3 Stochastic SSSA by POPF-Based Load Shedding
Both the PPF-G model and PPF-L model introduced above are relevant to PPF problems in essence, and the POPF model in this section can be established by replacing each deterministic PF calculation in the PPF problem with the deterministic OPF calculation, solved still in combination with MCS. The POPF problem contain ILs to eliminate the power imbalance after a contingency can be represented by the following equations:
The objective function Eq. 8a is to minimize the cost of active power output of the traditional generator and IL curtailment after contingency.
Since the relationships for the samples after contingency are independent in the POPF-L model, the load shedding scheme would vary sharply along with the power fluctuations, which is complex and cumbersome for the system operator. This indicates that the effect of the same load shedding on the off-limit situations of variables depends on operating conditions after the same contingency; that is, the selection of different ILs to participate in balancing power shortage will have a significant impact on the security of the power system. In addition, the economic cost of satisfying the constraints by the use of POPF-L in stochastic scenarios after contingency is also unattainable. To keep a trade-off between the operation economy and security of the power system, a stochastic SSSA method based on the CCOPF problem for balancing such fluctuating power shortage with controllable off-limit probability and relatively low operation cost will be introduced in Section 3.
3 Stochastic SSSA by CCOPF Based on Load Shedding
ILs are the primary sources to balance power shortage after contingency, so they are treated as the control variables to minimize the objective function value in both the POPF-L model and CCOPF-L model introduced in the following for stochastic SSSA. The “unit price” of each IL can directly affect the final load shedding strategy and indirectly affect the off-limit situations of some variables, which can reflect the security level of the system in operation. Thus, it is necessary to properly determine the corresponding “unit price” of each IL according to its influence on the system security. Therefore, the calculation method for “unit price” of each IL is defined and proposed first in Section 3.1, while the modeling and the related solving process of the CCOPF-L model are introduced in Section 3.2 to Section 3.4. In addition, the ranking index (RI) for the stochastic SSSA method is presented at the end of this section.
3.1 Contribution Index and “Unit Price” of Each IL
To make full use of the ability of IL to maintain system security after contingency, it is necessary to carry out a security assessment for each IL in advance. For this purpose, a contribution index (CI) is introduced to evaluate the importance of each unit load shedding to the system security with respect to branch active PF. The relationships between bus injection powers and bus voltages can be expressed as follows:
where
where
Equation 11 represents the effect of changed injection power on branch power variation. Load curtailment mainly decreases the injected power, which will directly affect the branch active power. The small values of
where the subscript “
We assume that the “unit price” range of load buses is
According to the pricing method mentioned above, the higher the system security becomes with a unit IL removed after contingency, the lower the corresponding “unit price” of that IL will be. Therefore, the problem of minimizing the objective function value is equivalent to the problem of maximizing the system security to withstand a contingency. In general, the “unit price” can be regarded as a pretreatment for guaranteeing system security after contingency, the purpose of which is to highlight the involvement level or the security weights of ILs even in combination with the actual “unit price.”
3.2 Modeling of CCOPF Based Load Shedding
In response to the abovementioned problem of volatile IL shedding schemes in the POPF-L model, CCOPF just makes some adjustments to the IL shedding strategy in order to deal with power fluctuations, which makes the violation probabilities of system operating parameters acceptable. The CCOPF-based load shedding can be built and represented by the following equations:
As shown in Eq. 14a, the objective of the model is to minimize the cost of forecasted active power generation, i.e.,
Compared with the POPF-L model, CCOPF-L allows a certain probability to exceed the limit, which avoids the huge economic cost on excessive system security to some extent. In addition, the operation process is closer to practice by determined control of ILs; thus, the stochastic SSSA method based on the CCOPF-L model makes more practical sense.
3.3 Solution of the CCOPF-L Model
From the modeling perspective, CCOPF-L transforms the inequality constraints of POPF-L into chance constraints, and it also makes the final result a deterministic value and the solving process more complex. The reformulation of the chance constraint Eq. 14d is taken as an example. When the bus power injections deviate from the initial base value, the branch active power flows in the system vary accordingly. The power flow on branch
In combination with Eq. 11, the active power flow deviations can be represented as follows:
The chance constraint (Eq. 14d) in Section 3.2 can be replaced by
We assume that both
Furthermore, Eq. 18 can be rearranged as
where
Note that the term
Applying the analytical reformulation to all chance constraints and using the definition of the uncertainty margins from the work of Roald and Andersson (2018), Eq. 14a can be reformed as Eq. 21a below
The detailed steps of an iterative procedure for solving the CCOPF-L problem are given in what follows:
The second step, i.e., contingency analysis, in Figure 1 of the traditional stochastic SSSA is replaced with more details in Figure 2. The difference of the four contingency analysis methods lies in the treatments of balancing power shortage after contingency. The improved sampling method and composite ranking index are described in detail in the following, while the contingency ranking results are shown in Section 4.2.
3.4 Improved Sampling Method
The sampling method is used to generate samples to describe uncertainties of wind power and load power, which is needed for all the four power balance methods in stochastic SSSA. In practical application, the solution speed of SSSA is required to be high, but the solution time increases with samples. Therefore, the selection of reasonable and effective samples is crucial to improve the efficiency of stochastic SSSA. Compared with MCS, Latin hypercube sampling (LHS) can cover a much larger sampling space of the input random variables with the identical sample size, and also, it is more robust, so it is selected as the sampling method in this paper. The procedure of LHS can be divided into two main steps including sampling and permutation. The cumulative distribution function (CDF)
The LHS method changes the order of sampling values of each random variable by permutation, making the correlations tend to theoretical values. Common permutation methods include genetic algorithm (Xu et al., 2017), Cholesky decomposition (Cai et al., 2013), and ranked Gram–Schmidt orthogonalization (Owen, 1994). Cholesky decomposition is selected herein owning to its slight computational burden, and the steps of such permutation can be summarized as follows:
It is worth noting that the solution of
3.5 Ranking Index of SSSA
The composite security index defined as Eq. 23 (Sunitha et al., 2013) can be used to describe the security level of the power system after contingency, which covers the impact of the off-limit amplitude and off-limit probability of both branch active power and voltage magnitude. Two types of limits are defined herein, i.e., security limit and alarm limit, to get a reasonable composite index. The security limit denotes the maximum limit, while the alarm limit provides alarm zones adjacent to the security limit.
where
where
where
The system is considered insecure if one or more bus voltages or branch active flows exceed their security limits and in the alarm state, if one or more bus voltages or branch active flows exceed their alarm limits without exceeding their security limits. If none of the voltages or branch active flows violates an alarm limit, the system is considered secure. Seen from the definition of the composite security index, the system would fall into one of the three states as follows:
1) Secure state if
The cost of balancing power shortage in contingency relevant to generator outage, as shown in Eq. 26a, is mainly composed of two parts, i.e., generator output adjustment cost Eq. 26b and IL curtailment cost in Eq. 26c.
where
With consideration of load shedding for the SSSA, the security index of some severe contingencies will be relatively small, but with expensive cost to remove power mismatch. Therefore, the cost of balancing power shortage after contingency should be combined with the composite security index to form the contingency ranking index (i.e., RI). Since the cost value of balancing power shortage in contingency is relatively large compared with the security index, it is divided by 50000 to make it in the same order to the value of the security index; the two entries are multiplied by 0.5 and summed to obtain the comprehensive contingency ranking index as follows:
Based on it, the top ten contingency ranking results obtained by the four methods mentioned in this article are shown in Figure 11.
4 Case Study
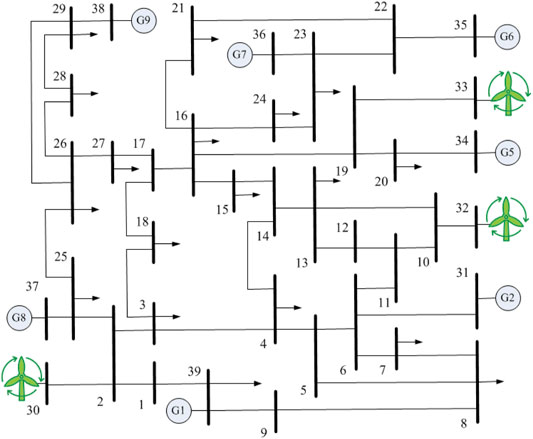
The modified 39-bus New England system, as shown in Figure 3, is selected as the test system, and the details of relevant parameters are accessible from MATPOWER 6.0 (Zimmerman et al., 2011). In order to facilitate the simulation and analysis, a few modifications have been made to the original test system. The conventional generators of bus 30, 32, and 33 are replaced with the wind power generators, and the negative reactive load of bus 24 is changed to a positive one. In the subsequent tests, the deterministic PF and OPF calculation are conducted by the use of MATPOWER, while the PPF, POPF, CCOPF, and stochastic SSSA are implemented in the MATLAB platform (MATLAB User’s Guide, 1995).
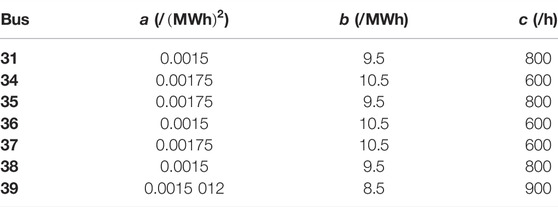
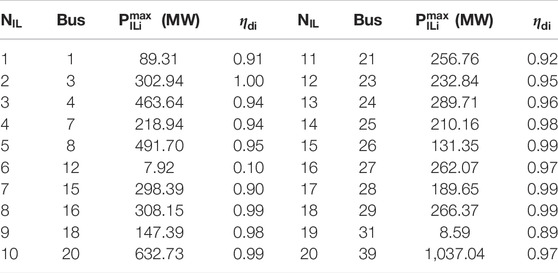
For each conventional generator in the system, a quadratic cost function is used, and the parameters are given in Table 1. The column “Bus” represents at which bus this generator is located. The columns “a,” “b,” and “c” represent the quadratic, linear, and constant term of the generation cost function, respectively. The minimum value of each load in NC samples is regarded as its capacity of IL in the stochastic context, and the corresponding data are available in Table 2. The column “
The N-1 and N-2 contingencies in terms of traditional generator outage are considered as a focus in this paper. The detailed relationship of contingency numbering (CN) and corresponding contingency composition is listed in Table 3.
It is assumed that the prediction errors of load consumption and wind generation are all subject to normal distribution and their standard deviations are the percentage of the predicted values, which are set to 2 and 5%, respectively. In this assumption on the stochastic modeling, the fluctuations between wind power and load power are independent of each other. We assume that the correlation coefficient between any two loads is 0.5. The correlation coefficient of the corresponding wind power fluctuations of bus 30 and bus 32 or 33 is set to 0.2, while that of the wind power fluctuations between bus 32 and bus 33 is set to 0.6 due to their adjacent locations. In addition, the acceptable off-limit probability of chance constraints is uniformly set to 0.025 in the subsequent tests.
4.1 Validity of Improved Sampling Method Used for Stochastic SSSA
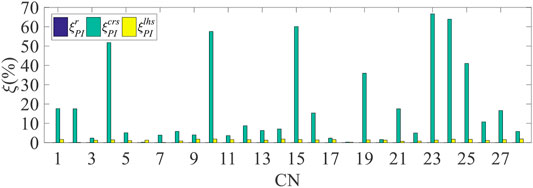
All the N-1 and N-2 contingencies relevant to generator outage are selected to confirm the validity of the improved sampling method for an efficient solution of the CCOPF-L problem, and the composite security index
For the contingencies studied, all the
In order to further confirm the numerical stability of the LHS method and study the influence of sample size on the iterations during solving the CCOPF-L problem, 10 groups with different sample sizes from 1,000 to 10000 are selected for analysis on contingency 16 as an example. The
4.2 Performance Comparison of Probabilistic SSSA Methods
To compare the direct influence of four methods on the steady-state security of the power system, the off-limit situations of branch active power are first analyzed for contingency 26. Notice that Figure 7 only lists the distributions of the overload branches, so there is no subfigure for the POPF method since it can effectively get rid of the over-limit. The number of subfigures in Figure 7 for PPF-G (“black”), PPF-L (“blue”), and CCOPF-L (“green”) models is seven, two, and three, respectively, which respond to the quantity of overload branches. The red vertical line for each subfigure represents the capacity of the branch active power; thus, the area ratio beyond this value corresponds to the off-limit probability.
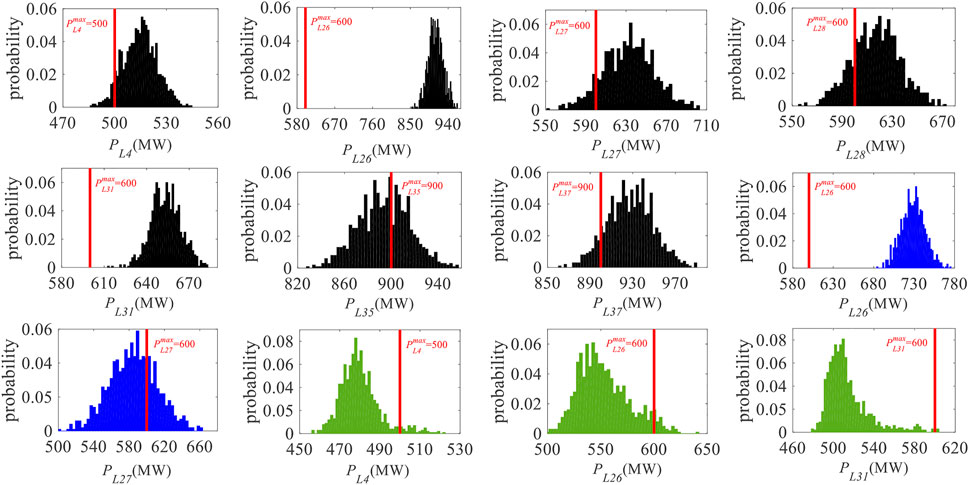
FIGURE 7. Active power distributions of overload branches for contingency 26 using different methods.
As also seen from the subfigures mentioned above, no matter from the off-limit quantity, amplitude, and probability for branches, the overall violating situation is the most serious when the PPF-G model is adopted, of which the maximum off-limit amplitude of branch 26 is 362.42 MW, and its off-limit probability is 100%. Compared with the PPF-G model, the number of overload branches relevant to the PPF-L model has been reduced from seven to two with much lower off-limit amplitude. However, the off-limit probability of branch 26 is still 100% even if the PPF-L method is adopted, which indicates that load shedding can relieve the off-limit amplitude and probability of branches to some extent, but the system cannot reach a new secure steady state after contingency 26. Through the optimization of the load curtailment with the CCOPF-L model, the off-limit amplitude and violation probability of branches is within 143 MW and 5%, respectively, while the number of off-limit branches is only one more than that of the PPF-L model. To further compare the influences of the four stochastic SSSA methods on the system security suffering from contingencies, the overall off-limit situation of bus voltage magnitude and branch active power for all the contingencies considered in this article is analyzed in the following.
The out-of-limit situation of branch active power and bus voltage magnitude is shown in Figures 8, 9, respectively. Methods 1 to 4 correspond to the SSSA method which adopts POPF-L, CCOPF-L, PPF-L, and PPF-G models, respectively. The detailed explanation of CN can be found in Table 3. Each method corresponds to two rows of data along the axis “Method” in Figure 9, which cover the off-limit situations of the lower and upper voltage. The average off-limit probabilities of the branch active power and bus voltage are denoted by “
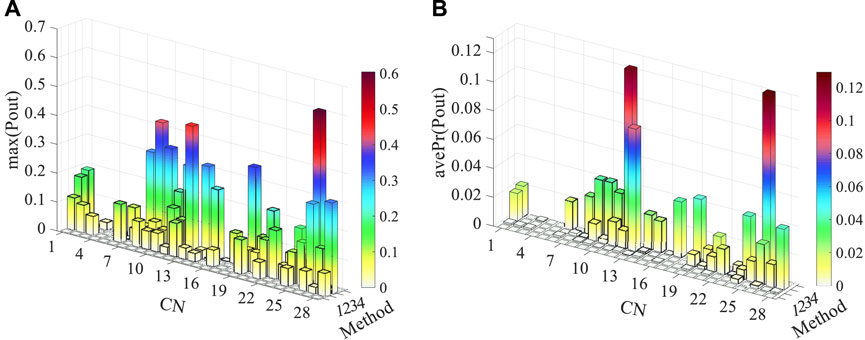
FIGURE 8. Out-of-limit situation of branch active power. (A) Maximum out-of-limit situation of branch active power. (B) Average out-of-limit situation of branch active power.
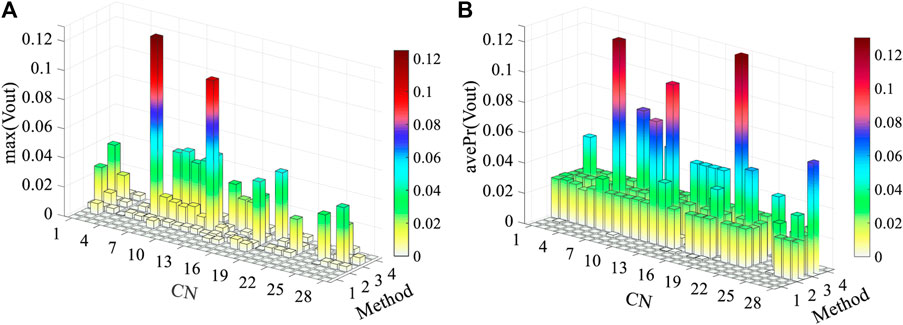
FIGURE 9. Out-of-limit situation of voltage magnitude. (A) Maximum out-of-limit situation of voltage magnitude. (B) Average out-of-limit situation of voltage magnitude.
Regardless of the branch power or the bus voltage, the off-limit situation using the PPF-G model is the worst for the convergent contingencies. In particular, the
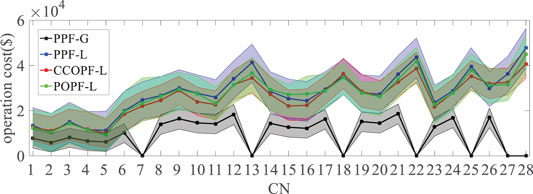
Figure 10 depicts the cost range for handling power mismatch after contingencies using different SSSA methods with power fluctuations consideration. The same color corresponds to one method, and the dotted line corresponds to the cost at the base case, while the two unmarked lines for the same color, respectively, represent the upper and lower cost in case of considering power fluctuations. It is worth noting that the optimized result of CCOPF-L as defined in Eq. 14a is a deterministic value, but it needs adjusting the load shedding strategy slightly to deal with power fluctuations, which will produce certain adjustment costs, so its cost discussed herein is also a range. The cost of some contingencies for the PPF-G model is set to zero due to the divergence issue. In general, the larger the power shortage after contingency occurs, the higher the operating cost will be, so the overall costs of N-2 contingencies are always higher than those of N-1 contingencies.
As indicated by Figure 10, the PPF-G model has the lowest forecasted cost and a small range of cost. This phenomenon can be explained by the lower unit cost of the conventional generator compared with the “unit price” of IL. Since IL curtailment is used for the other three methods for contingency analysis, making the cost range and forecasted cost for the same contingency to be in a similar order of magnitude, they are worthy to be compared in a further step. For a contingency, there are the maximum forecasted costs amongst the three methods, while the maximum value of most contingencies belongs to the PPF-L model in Figure 10. The IL for power imbalance is not optimized using the PPF-L method, so part of the contingencies, e.g., contingency 13 and 22, will lead to large upper operation cost in response to power fluctuations. However, the cost range is slightly small for the CCOPF-L model, since this method will not result in much more operation cost, especially when the power fluctuations are significant. Meanwhile, the POPF-L method can also lead to huge cost ranges after some contingencies, e.g., contingency 7 and 16, just in order to fully satisfy the inequality constraints of Eq. 8. Therefore, considering the cost to balance power shortage, the PPF-G model is the cheapest while the PPF-L model is the most expensive, in which the POPF-L model is the second most expensive and the CCOPF-L model is the second cheapest.
Since the introduction of load shedding can change the system security level after contingency through its impact on the off-limit situation as shown in Figures 8, 9 , the
The horizontal axis in Figure 11 represents the rank order based on the RI value, while the value on each bar denotes the CN defined in Table 3. The PPF-G model cannot rank all the contingencies considered in this article since some contingencies are divergent, which is one of the reasons leading to its ranking results differing so much from those of the other three methods. The specific contingency ranking results are different amongst the other three methods with IL curtailment, but their top ten contingencies’ sets are almost the same, so the ranking results based on the RI value have a certain credibility degree.
The following conclusions can be drawn in this section from the analysis mentioned above. The significant drawback of the PPF-G model lies in the off-limit situation after contingency is so serious that it threatens the system security, and the analysis on some severe contingencies is even divergent. In addition, the output of the generator is limited by its adjustment rate and capability in practice, so the PPF-G model is eliminated. Despite that the introduction of IL curtailment can make the power system more secure right after contingency, the load shedding scheme without optimization such as the PPF-L model still makes the off-limit situation unacceptable for a few severe contingencies, and the economics of this approach are not encouraging as well. In summary, from the perspective of system security and cost range after contingency, the performance of the POPF-L and CCOPF-L model for SSSA is worthy of further study.
4.3 Comparison of Load Shedding Scheme and Running Speed for Optimal Stochastic SSSA Methods
The comparison of the load shedding scheme between CCOPF-L and POPF-L models can be conducted from the perspective of practicality and maneuverability. Figure 12 shows the distribution of load shedding schemes of four contingencies, obtained by means of the POPF-L and CCOPF-L models, respectively.
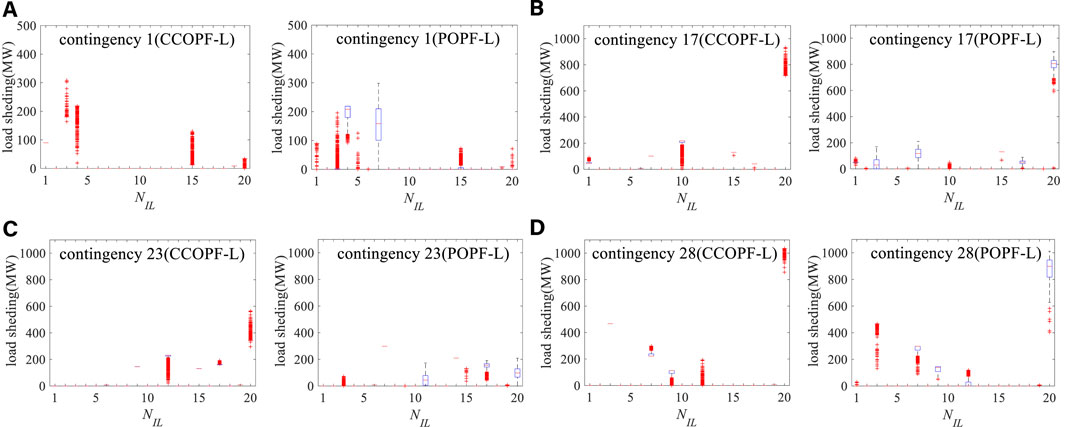
FIGURE 12. Optimal load shedding schemes of different contingencies. (A) Optimal load shedding schemes of contingency 1. (B) Optimal load shedding schemes of contingency 17. (C) Optimal load shedding schemes of contingency 23. (D) Optimal load shedding schemes of contingency 28.
In general, the POPF-L model employs more ILs to balance power shortage arisen from contingencies, and the curtailment amount of ILs varies widely with power fluctuations, which can lead to a large operation cost range as shown in Figure 10, while the results of employing the CCOPF-L model are the opposite as shown in Figure 12. Taking contingency 17 in Figure 12B as an example, when both POPF-L and CCOPF-L models are used, ten and seven ILs are required to balance power mismatch, respectively, while the total change range of their curtailment amounts is 3,023.7 MW and 538.9 MW for all the sampling scenarios. This phenomenon can be explained based on the models. The objective values should be kept minimum, and the constraints should be satisfied for all the sampling scenarios when the POPF-L model is taken; thus, the load shedding results could vary sharply. Once the CCOPF-L model is adopted, the objective value should be the minimum only for the forecasted state and the inequality constraints can be violated for a certain probability. Thus, the IL curtailment schemes for sampling scenarios can be obtained by a slight adjustment around that of the forecasted state. Compared with the POPF-L model, the CCOPF-L model employs fewer ILs with narrower load shedding range, which is more beneficial for managing the ILs against contingencies in practice.
In addition, it should be pointed out that the results of several scenarios are divergent from experiments for the POPF-L model. In other words, the load curtailment scheme cannot satisfy all inequality constraints encountering some extreme sampling scenarios, while the off-limit situations of such severe scenarios using the CCOPF-L model are slight and the results of all the scenarios are convergent. Based on the analysis mentioned above, it can be found that using the CCOPF-L model to depress power shortage after contingencies is relatively reasonable and acceptable in operation and management, which is more feasible and practical. In addition, the performance of the two methods can be further compared in terms of running time as follows.
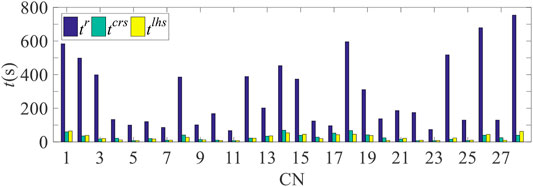
It can be seen evidently from Figure 13 that the running speed of the CCOPF-L model is much faster than that of the POPF-L model for SSSA. This phenomenon can be explained according to the solution processes. The OPF problems should be solved NC times for one contingency using the POPF-L model, which is time consuming. However, the solution of the CCOPF-L model is an iterative process, which requires solving one OPF problem and NC ordinary PF equations for each iteration, and the iterations of most contingencies does not exceed 10 as obtained in Figure 6. Except for several contingencies, the running speed of the CCOPF-L model is 3–10 times faster than that of the POPF-L model; thus, the CCOPF-L model is more efficient and suitable for practical operation. In addition, the total running time of the POPF-L model is 2,127.6 s for all contingencies, while the CCOPF-L method takes 726 s, of which the later one is feasible for day-ahead and even hour-ahead SSSA. If parallel computing is adopted, it can be also applied to the security assessment of a larger system within an acceptable time.
Combined with the SSSA methods mentioned above, it is revealed that the CCOPF-L model can achieve excellent performances in operation, management, and running speed for SSSA with generator outage. In addition, it is worth highlighting that the CCOPF-L method can also well balance the operation security and economy after contingency through the chance constraints. Therefore, the CCOPF-L model proposed in this article is the best option, which is an effective and credible model, for stochastic SSSA accounting for generator outage and various uncertainties. To get a better understanding on the CCOPF-L model for SSSA, other related properties are presented in the following.
4.4 Other Properties of Stochastic SSSA Method Based on CCOPF-L
In order to verify that the pricing method of IL introduced in Section 3.1 is conducive to improving the system security, the unit price of ILs determined according to load capacity and randomly generated is also adopted to solve the CCOPF-L model, and the corresponding
As shown in Figure 14, when the “unit price” defined in Section 3.1 is adopted, the
To prove the controllability of the off-limit probability of chance constraints for the CCOPF-L model, the bus voltage or branch active power with different acceptable violation probabilities should be analyzed. Since the off-limit amplitude of bus voltage is less than 1% of the standard value, its impact on the system security can be ignored. While the off-limit amplitude of branch active power is mostly between 2 and 10% of the tranmission line capacity, the analysis only focuses on the branch power. Taking congtingency 24 as an example, the allowable off-limit probability of branch power is set as 0.01, 0.02, 0.03, 0.04, and 0.05, individually, with remaining conditions unchanged, and the results are shown in Figure 15.
The results of Figure 15 indicate that the off-limit probability is within the set confidence range, which verifies that the proposed CCOPF-L model for SSSA can effectively control the off-limit probability of branch active power. It is worth noting that the lower the allowable off-limit probability is, the more the branches may undergo off-limit, and vice versa. This can be explained as that the reduction of the preset off-limit probability will inevitably make the overload power of the branches with higher off-limit probability to be shared by the remaining branches with lower off-limit probability.
5 Conclusion
In this article, a novel load shedding-based AC-CCOPF model is presented for stochastic SSSA, which can give a comprehensive consideration of conventional generator outage, uncertainty of system operation, and load shedding of ILs. Besides, extensive study results verify that the preprocess of unit price for ILs developed by this paper can indeed enhance the steady-state security level after contingency. Moreover, the generator outage severity can be quantified much more accurately through the contingency ranking index in terms of the cost, and it can be used to improve the balance power shortage and overload situation after contingency established in this article.
The load shedding of ILs makes the overload situation about branch active flow/bus voltage magnitude after contingency much more slight. In addition, the overload probability of these parameters can be controlled by the use of chance constraints. Compared to the three other models for stochastic SSSA as introduced in this article, the security level of the proposed CCOPF-L model after contingency is much higher than that of the PPF-G model and PPF-L model, and the quantity and range of ILs are both smaller than those in the POPF-L model. Meanwhile, the CCOPF-L model-based stochastic SSSA which employs the LHS sampling method can meet the need of computation speed requirement in practical application, which is much faster than the POPF-L model. In summary, CCOPF-L model-based stochastic SSSA proposed in this article can hold a great balance amongst security, economy, controllability, and maneuverability.
Data Availability Statement
The raw data supporting the conclusion of this article will be made available by the authors, without undue reservation.
Author Contributions
XZ, YJ, and JT contributed to conception and design of the study. XZ, YJ, and CY performed the case analysis. XZ and YJ wrote the first draft of the manuscript. CY, DX, JT, and KX wrote sections of the article. All authors contributed to article revision and read and approved the submitted version.
Funding
This research work was majorly supported by the National Natural Science Foundation of China (Project No. 52177071). Additional funding was received from the National Science Fund for Distinguished Young Scholars of China (Project No. 51725701).
Conflict of Interest
Author YJ was employed by State Grid Deyang Electric Power Supply Company and State Grid Sichuan Electric Power Company.
The other authors declare that the research was conducted in the absence of any commercial or financial relationships that could be construed as a potential conflict of interest.
Publisher’s Note
All claims expressed in this article are solely those of the authors and do not necessarily represent those of their affiliated organizations, or those of the publisher, the editors, and the reviewers. Any product that may be evaluated in this article, or claim that may be made by its manufacturer, is not guaranteed or endorsed by the publisher.
Acknowledgments
The authors gratefully acknowledge these supports.
Footnotes
1https://www.nrel.gov/docs/fy17osti/66591.pdf
References
Ahmad, A., Amjady, N., and Conejo, A. J. (2018). Adaptive Robust AC Optimal Power Flow Considering Load and Wind Power Uncertainties. Int. J. Electr. Power Energ. Syst 96, 132–142. doi:10.1016/j.ijepes.2017.09.037
Álvaro, D., Arranz, R., and Aguado, J. A. (2019). Sizing and Operation of Hybrid Energy Storage Systems to Perform Ramp-Rate Control in PV Power Plants. Int. J. Electr. Power Energ. Syst 107, 589–596. doi:10.1016/j.ijepes.2018.12.009
Cai, D., Shi, D., and Chen, J. (2013). Probabilistic Load Flow Computation with Polynomial normal Transformation and Latin Hypercube Sampling. IET Generation, Transm. Distribution 7 (5), 474–482. doi:10.1049/iet-gtd.2012.0405
Duan, Y., and Zhang, B. (2014). Security Risk Assessment Using Fast Probabilistic Power Flow Considering Static Power-Frequency Characteristics of Power Systems. Int. J. Electr. Power Energ. Syst. 60, 53–58. doi:10.1016/j.ijepes.2014.02.030
Eygelaar, J., Lötter, D. P., and van Vuuren, J. H. (2018). Generator Maintenance Scheduling Based on the Risk of Power Generating Unit Failure. Int. J. Electr. Power Energ. Syst. 95, 83–95. doi:10.1016/j.ijepes.2017.08.013
Hatziargyriou, N. D., Contaxis, G. C., and Sideris, N. C. (1994). A Decision Tree Method for On-Line Steady State Security Assessment. IEEE Trans. Power Syst. 9 (2), 1052–1061. doi:10.1109/59.317626
Huang, Y., Xu, Q., Abedi, S., Zhang, T., Jiang, X., and Lin, G. (2019). Stochastic Security Assessment for Power Systems with High Renewable Energy Penetration Considering Frequency Regulation. IEEE Access 7, 6450–6460. doi:10.1109/access.2018.2880010
Jia, C., and Zheng, Y. (2017). Probabilistic Optimal Power Flow Considering Dependences of Wind Speed Among Wind Farms by Pair-Copula Method. Int. J. Electr. Power Energ. Syst 84, 296–307. doi:10.1016/j.ijepes.2016.06.008
Khodadoost Arani, A. A., Gharehpetian, G. B., and Abedi, M. (2019). Review on Energy Storage Systems Control Methods in Microgrids. Int. J. Electr. Power Energ. Syst. 107, 745–757. doi:10.1016/j.ijepes.2018.12.040
Lin, X., Jiang, Y., Peng, S., Chen, H., Tang, J., and Li, W. (2020). An Efficient Nataf Transformation Based Probabilistic Power Flow for High-Dimensional Correlated Uncertainty Sources in Operation. Int. J. Electr. Power Energ. Syst 116, 1–13. doi:10.1016/j.ijepes.2019.105543
Negnevitsky, M., Nguyen, D. H., and Piekutowski, M. (2015). Risk Assessment for Power System Operation Planning with High Wind Power Penetration. IEEE Trans. Power Syst. 30 (3), 1359–1368. doi:10.1109/tpwrs.2014.2339358
Owen, A. B. (1994). Controlling Correlations in Latin Hypercube Samples. J. Amer. Statist. Assoc. 89 (425), 1517–1522. doi:10.1080/01621459.1994.10476891
Polymeneas, E. (2015). Optimal Operation and Security Analysis of Power Systems with Flexible Resources. Ph.D. Dissertation. America: Electrical and Computer Engineering, Georgia Institute of Technology.
Pudjianto, D., Aunedi, M., Djapic, P., and Strbac, G. (2014). Whole-Systems Assessment of the Value of Energy Storage in Low-Carbon Electricity Systems. IEEE Trans. Smart Grid 5 (2), 1098–1109. doi:10.1109/tsg.2013.2282039
Roald, L., and Andersson, G. (2018). Chance-Constrained AC Optimal Power Flow: Reformulations and Efficient Algorithms. IEEE Trans. on Power Syst. 33 (3), 2906–2918. doi:10.1109/TPWRS.2017.2745410
Roald, L., Vrakopoulou, M., Oldewurtel, F., and Andersson, G. (2015). Risk-based Optimal Power Flow with Probabilistic Guarantees. Int. J. Electr. Power Energ. Syst. 72, 66–74. doi:10.1016/j.ijepes.2015.02.012
Rocchetta, R., and Patelli, E. (2018). Assessment of Power Grid Vulnerabilities Accounting for Stochastic Loads and Model Imprecision. Int. J. Electr. Power Energ. Syst. 98, 219–232. doi:10.1016/j.ijepes.2017.11.047
Seyed Javan, D., Rajabi Mashhadi, H., and Rouhani, M. (2013). A Fast Static Security Assessment Method Based on Radial Basis Function Neural Networks Using Enhanced Clustering. Int. J. Electr. Power Energ. Syst 44 (1), 988–996. doi:10.1016/j.ijepes.2012.08.014
Varshney, S., Srivastava, L., and Pandit, M. (2016). A Parallel Computing Approach for Integrated Security Assessment of Power System. Int. J. Electr. Power Energ. Syst. 78, 591–599. doi:10.1016/j.ijepes.2015.11.098
Xu, Q., Yang, Y., Liu, Y., and Wang, X. (2017). An Improved Latin Hypercube Sampling Method to Enhance Numerical Stability Considering the Correlation of Input Variables. IEEE Access 5, 15197–15205. doi:10.1109/access.2017.2731992
Yang, S., Yang, J., Bai, Y., and Ni, G. (2016). A New Methodology for Robust Optimizations of Optimal Design Problems under Interval Uncertainty. IEEE Trans. Magn. 52 (3), 1–4. doi:10.1109/tmag.2015.2483526
Zhu, J., Zhang, Y., and Chen, H. (2018). Probabilistic Load Flow with Wind FarmsUsing a Frequency and Duration Method. IEEE Access 6, 74812–74826. doi:10.1109/ACCESS.2018.2878636
Keywords: stochastic steady-state security assessment, uncertainties, chance constrained optimal power flow, generator outage, load shedding
Citation: Zhou X, Jiang Y, Yang C, Xu D, Tang J and Xie K (2022) Stochastic Steady-State Security Assessment for Power System Operation by Chance Constrained Optimal Power Flow-Based Load Shedding. Front. Energy Res. 10:770213. doi: 10.3389/fenrg.2022.770213
Received: 03 September 2021; Accepted: 09 February 2022;
Published: 31 March 2022.
Edited by:
Fengji Luo, The University of Sydney, AustraliaReviewed by:
Rui Wang, Northeastern University, ChinaYongxi Zhang, Changsha University of Science and Technology, China
Gaoqi Liang, Nanyang Technological University, Singapore
Copyright © 2022 Zhou, Jiang, Yang, Xu, Tang and Xie. This is an open-access article distributed under the terms of the Creative Commons Attribution License (CC BY). The use, distribution or reproduction in other forums is permitted, provided the original author(s) and the copyright owner(s) are credited and that the original publication in this journal is cited, in accordance with accepted academic practice. No use, distribution or reproduction is permitted which does not comply with these terms.
*Correspondence: Junjie Tang, dGFuZ2p1bmppZUBjcXUuZWR1LmNu
 Xinyu Zhou
 Yingying Jiang2
 Junjie Tang


