 Ying Wang1,2*
 Jiajun Liu1*
- 1School of Electrical Engineering, Xi’an University of Technology, Xi’an, China
- 2School of Electric Power, Yinchuan University of Energy, Yinchuan, China
As a basic industry for national economic development, the power industry is closely related to the overall economic and environmental development of China. At present, China is still dominated by thermal power generation. In order to reduce carbon emissions, promote the realization of the “double carbon” goal, and improve the level of clean energy utilization and the operating efficiency of the power system, a wind-light-water storage complementary power generation system is built, and a mathematical model of multi energy complementation is established. The minimum economic cost and the minimum battery capacity are proposed as the objective functions of system capacity configuration. Then a multi-objective evolutionary algorithm based on Pareto optimal space of the NDWA-GA and the PCA is proposed for optimal capacity allocation of multi energy complementary systems in this paper. Compared with the traditional multi-objective optimization algorithm, the correctness and effectiveness of the proposed method are verified. In addition, according to the actual research object, the optimal capacity configuration of the multi energy complementary system is given, which can guide the production and has an important promotion significance for energy saving and emission reduction.
1 Introduction
At present, because of the energy shortage, serious environmental pollution increasingly and climate change in the world, the issue of energy development has become a hot topic of interest. Therefore, improving the rational utilization of energy can provide support for the sustainable development of social economy (Li et al., 2017). The electric power industry is one of the basic industries supporting the national production, and its power generation process has also brought serious problems such as energy consumption and excessive pollutant emissions. Therefore, improving the energy utilization efficiency and power generation efficiency on the power generation side, while minimizing pollutant emissions, is the key work on the power generation side.
At present, thermal power generation accounts for the largest proportion of installed capacity in Chinese power industry and its power mainly comes from burning coal, which results in the emission of pollutants and low efficiency. Therefore, compared with energy conservation, the thermal power industry should first consider the carbon emission reduction goal (Wang et al., 2013). In the past few years, the proportion of coal consumption has decreased by 8.4%, and the proportion of non-fossil energy consumption has increased to 14.3%, of which the proportion of electricity in terminal energy consumption has increased to 25.5%. In order to achieve the “dual carbon” goal, a clean, low-carbon, safe and efficient energy system should be built to improve the utilization level of clean energy and the operating efficiency of the power system, and better play the role of multi energy complementation in ensuring energy security. In the 13th Five-Year Plan for Energy Development (National Development and Reform Commission and National Energy Board, 2016), it was pointed out clearly that centering on the “low-carbon” energy system, industrial reform was promoted and comprehensive energy utilization was promoted through continuous improvement of energy utilization efficiency. The state will accelerate the development of non-fossil energy, vigorously increase the scale of wind power and photovoltaic power generation, build a number of clean energy bases with multiple and complementary energy sources, and raise the share of non-fossil energy in total energy consumption to about 20 percent (State Council of the People’s Republic of China, 2021). The National Development and Reform Commission and the National Energy Administration have also issued relevant policy document (National Development and Reform Commission and National Energy Board, 2021) clearly proposing “promoting multi energy complementation and improving the consumption level of renewable energy".
In order to reduce carbon emissions and improve the energy pattern dominated by thermal power plants in China, and also improve the application rate of clean energy represented by wind, light and hydropower, a wind-light-water storage complementary power generation system by clean energy is constructed, to establish a mathematical model of multi energy complementation, which can propose the minimum economic cost and the minimum battery capacity as the objective function of system capacity configuration. A multi-objective evolutionary algorithm based on Pareto optimal space of the NDWA-GA and the PCA is proposed for optimal capacity allocation of multi energy complementary systems in this paper. Compared with the traditional multi-objective algorithm, the results show that the proposed algorithm has better convergence and distribution. In addition, compared with the light-water storage model and the wind-water storage model, it is proved that the wind-light-water storage model proposed in this paper has the lowest economic cost under the premise of accurate prediction of hydropower station output. The capacity configuration results show that in February to March each year, the wind power generation can meet the load demand, light and water will be stored in the form of energy storage battery. When the system output cannot meet the load, the energy storage unit is used to supplement.
The rest of the paper is organized as follows: The second section introduces the research status of multi energy complementary system, capacity allocation of multi energy complementary generation system and multi-objective evolutionary algorithm. The third section introduces the topology of the wind-light-water storage multi-energy complementary system, and analyzes the wind-light-water complementary situation. The mathematical model of the multi energy complementary system is given in this section. In the fourth section, a multi-objective evolutionary algorithm based on the Pareto optimal space of the NDWA-GA and the PCA is proposed to carry out the optimal capacity allocation for the multi energy complementary system. In order to verify the feasibility of the wind-light-water storage model in practical application, this section constructs the light-water storage model and the wind-water storage model, and compares the economy of their capacity configuration and the capacity of the battery. According to the actual case, the optimal capacity allocation for the multi energy complementary system in this case is given. The fifth section is the conclusion.
2 Literature review
Multi-energy complementarity is generally based on the characteristics of a variety of energy sources, it is a way to integrate them and use them effectively. The random and intermittent nature of wind, light and water resources as well as their complementary characteristics in space and time make it possible to establish a wind-light-water multi-energy complementary power generation system. Heide et al. believed that renewable energy generation across Europe, it shows that strong seasonality and will dominate in the future (Heide et al., 2010). Combining with the existing characteristics of various energy sources in northwest China, Zhang analyzed the necessity, feasibility and rationality of multi-energy complementary development (Zhang, 2012). At present, the more mature development are the photovoltaic and wind power complementary system. The reference (Deetjen et al., 2018) developed a model for calculating optimal transmission, wind and photovoltaic capacity for a region in Germany. However, photovoltaic and wind power are complementary, and the output fluctuation is still large, so it is necessary to configure a certain energy storage system on this basis. The research object of the reference (Parastegari et al., 2015) was the optimal scheduling of the complementary optical storage energy. The optimal economic scheduling mathematical model was established by taking the optimal economic efficiency of the system as the objective function and integrating various power conditions and balance states, and the particle swarm optimization algorithm was applied to solve the problem, the reference (Yahyaoui et al., 2017) designed an independent photovoltaic energy storage system and successfully provided electricity for an irrigation system. A multi-objective optimization model of wind energy storage was proposed in the reference (Xu et al., 2018), which can be applied in wind farms to adjust output fluctuations and reduce wind abandonment phenomenon.
The cost of energy storage system is relatively high, and it is difficult to apply in large-scale production. Hydropower, as the leader of clean energy, has large storage capacity and strong regulation capacity. It is the current development trend to use it in the multi-energy complementary system. Because of the economic underdevelopment in Ethiopia, the total power supply is insufficient, the reference (Bekele and Tadesse, 2012) studied a small wind-light-water system to make up for the shortage of power supply in rural areas. Spain’s Canary island climate is conducive to the development and utilization of wind and water energy, so a new wind-hydro system was proposed in the reference (Portero et al., 2015), and the results showed that its performance was significantly better than that of independent wind power systems. The research object of the reference (Liu et al., 2017) was the optimal scheduling of the three complementary energy sources of water, light and wind, on this basis, the system optimization model was established and the solution method was determined. The reference (Mahmoudimehr and Shabani, 2018) designed a PV/hydro hybrid power station for the energy system in the northern and southern coastal areas of Iran and configured its capacity. Small hydropower stations in Guizhou province is taken as the research object in the reference (Zhang et al., 2018), and wind and photovoltaic power generation systems are combined to build a wind-light-water storage complementary power generation system. The configuration scheme of the system is discussed in remote mountainous rural areas with electricity (off-grid mode) and with grid-connected conditions (grid-connected mode) based on HOMER.
The economy of the power generation system is the basis for allocating the capacity of each power source, which is of great practical significance for ensuring the economy and reliability of the complementary power generation system. Therefore, domestic and foreign scholars have established capacity allocation models with the minimum total investment cost or the maximum investment income as the objective function (Chang, 2020). Based on the minimum system cost and considered the seasonal load variation, a capacity optimization configuration model of the wind-solar storage system was established (Sanajaoba and Fernandez, 2016). The results showed that wind-solar complementarity can reduce the energy storage requirements of the system. In reference (Dou et al., 2016), the evaluation indexes of distributed capacitor configuration scheme and energy storage system configuration scheme is discussed, that is, the former is evaluated from economy, reliability and environmental protection, and the latter is evaluated from functionality and economy. Taking Longyangxia Hydropower Station in China as an example, a capacity configuration model of water-light complementary system was proposed to maximize the net income in the whole life cycle, considering the short and long term decisions of hydropower operation (Ming et al., 2017). In reference (Abdin and Merida, 2019), a wind-light multi-energy complementary model was constructed based on HOMER Pro solving for the lowest economic cost of energy and capacity configuration for each in five different locations around the world. The results showed that hydrogen energy is more economically advantageous than battery storage in off-grid energy systems. A wind/light/storage grid connected microgrid was built (Li et al., 2020). Based on considering the life-cycle cost economy, it compared four energy storage modes: single battery energy storage, hydrogen storage hybrid battery energy storage, single lithium battery energy storage, and single liquid flow battery energy storage. The results showed that the hybrid energy storage system composed of hydrogen storage and battery had more significant advantages in energy utilization efficiency and the economy of the microgrid. In reference (Alghussain et al., 2020), scholars set the lowest energy cost and maximized the proportion of renewable energy use as the objective function, comparing the capacity configuration of the power grid system under four different energy storage scenarios, which were without energy storage modules, pumped storage, hydrogen fuel cells, and pumped storage hybrid hydrogen fuel cells. The results showed that the proportion of supply and demand increased from 46.5% to 89.4%, and the proportion of renewable energy increased from 62.6% to 91.8% when the hybrid energy storage system with pumped storage and hydrogen fuel cell was used.
The hybrid energy storage of batteries and super capacitors were applied in a grid-connected wind-light complementary power generation system with a two-step capacity configuration (Hu et al., 2016), and its capacity configuration is divided into two steps. First, the HOMER software is used to obtain preliminary results with the minimum system cost as the optimization objective function, and then genetic algorithm is used to further optimize the hybrid energy storage system. In reference (Sheng and Zhang, 2017), an improved binary bat algorithm with the continuous optimization algorithm was directly applied in the local optimization problem generated by the wind photovoltaic diesel battery microgrid capacity configuration optimization model. The comparison with genetic algorithm and particle swarm optimization showed that the proposed algorithm achieved better results in solving effect and convergence speed. In the reference (Yu et al., 2019), a grid-connected wind-light complementary system was constructed using pumped storage power plants as energy storage devices, and a variable-step cyclic discrete algorithm was proposed in which the number of wind turbines and photovoltaic arrays were discrete integers and the pumped storage capacity was considered as a discrete of a certain step size. In reference (Liu et al., 2020), photovoltaic energy storage diesel micro grid was taken as the research object in southwest of China, the state of charge of the energy storage system and the reliability of the self-power supply of the system were taken as constraints, and the particle swarm optimization (PSO) algorithm was used to solve capacity allocation. The relationship between the theoretical output of wind farms and retired energy storage batteries was comprehensively considered (Wang et al., 2020), and the charging and discharging threshold range of ideal retired batteries with a piecewise probability distribution function were set, which reduced the recovery cost of retired batteries. At the same time, the cycle life consumed by the hierarchical control strategy was reduced by 27.7% compared with the overall energy storage control strategy. The actual village coal to electricity project in Qinhuangdao area was taken as the research object (Zhao et al., 2021), considering the complementary system composed of thermal storage heating and photovoltaic, proposed a joint configuration method based on PSO algorithm. The results showed that the investment and operation costs of photovoltaic and thermal storage heating equipment were the least. In reference (Chen et al., 2021), researchers introduced the incentive demand side response in the optimal configuration of wind light hydrogen multi energy complementary microgrid, optimized the load curve using mixed integer programming, and solved the optimal configuration based on the PSO algorithm. The configuration results showed that with the reduction of photovoltaic and wind turbine construction costs, the equivalent annual cost of the system could be significantly reduced. In addition, the planning method, enumeration method and hybrid method can also be used to solve the optimal capacity of each source in the complementary generation system.
There are multiple objective functions in the mathematical model of capacity allocation of multi energy complementary systems, which is a typical multi-objective optimization problem that can be solved based on multi-objective evolutionary algorithms. In recent years, multi-objective evolutionary algorithms have been developed rapidly. The multi-objective evolutionary algorithm based on Pareto dominance uses the non-dominated sorting and diversity maintenance mechanism to guide the population to the Pareto front. Typical algorithms include non-dominated sorting genetic algorithm II, Pareto envelop-based selection algorithm-II (PESA-II) (Corne et al., 2001) and Strength Pareto evolutionary algorithm II (SPEAII). Although the above algorithms can solve many multi-objective optimization problems, when the objective function increases or Pareto front characteristics are complex, the solving efficiency of multi-objective evolutionary algorithm based on dominance relationship becomes low. With the increase of objective function, the selection pressure of individuals on Pareto front drops sharply. When the objective function is more than a certain threshold, almost all individuals of the same generation are non-dominated, which makes it difficult for evolutionary algorithms based on Pareto dominance to distinguish these individuals. In order to solve the multi-objective optimization problem of Pareto frontier with complex characteristics, many improved algorithms have been proposed including fuzzy Pareto dominant algorithm (He et al., 2014), Vector angle-based evolutionary algorithm (Xiang et al., 2017) and Many-objective evolutionary algorithm based on a rotation of grid (Zou et al., 2018). The common feature of these above methods is that the preference for a specific area of the Pareto front is introduced, so that the population can converge to a certain part of the Pareto front. However, it is difficult for these above methods to find the entire Pareto front.
Through the decomposition multi-target evolution algorithm transforming multi-target optimization problems into a series of single target optimization sub-problems, the evolution algorithm is used to optimize these sub-problems based on a certain number of adjacent problems. Representative algorithms include non-dominated sorting genetic algorithm III (NSGA-III) (Deb and Jain, 2014), and modified particle swarm optimization based on decomposition with different ideal points (MPSO/DD) (Qin et al., 2020).
In order to make full use of the complementary characteristics of each power source, weaken the impact of the instability of new energy output on the power grid, improve the application rate of clean energy represented by wind, light and hydropower, and improve the energy pattern dominated by thermal power plants in China, a complementary wind-light-water storage power generation system is constructed and a multi-objective evolutionary algorithm based on the NDWA-GA and the PCA with Pareto optimal space is proposed for the optimal capacity allocation of the multi-energy complementary system in this paper. Through the above method the dependence on thermal power generation and carbon emissions can be reduced, which is of great significance for the implementation of the national energy conservation and emission reduction and the “double carbon” policy.
3 Wind, light, water and storage multi-energy complementary model
3.1 Multi-energy complementary system topology design
Because wind power and photovoltaic power generation are characterized by randomness, intermittency, and volatility, especially the daily output characteristics of wind power are just opposite to the load, it is difficult to directly connect them to the large power grid for users. The units in the hydropower station have the ability to start and stop quickly, which can be well used to supplement the photovoltaic and wind output characteristics and can effectively solve the problem of new energy grid connection consumption. The structure of the wind-light-water storage coupling system is shown in Figure 1, which mainly includes power generation module, energy storage module, energy conversion module and user module. The power generation module consists of wind turbine, photovoltaic turbine and hydroelectric turbine, which is a power generation system composed entirely of clean energy without carbon emission. The energy conversion module includes rectifier and inverter. The rectifier converts the alternating current generated by the wind turbine into direct current, and the direct current generated by the photovoltaic power is transmitted through the direct current transmission line. The energy is transferred in both directions between the battery in the storage module and the DC transmission line, and the DC power is inverted and sent to the customer through the AC transmission line. The AC power from the hydropower station is transmitted through the AC transmission line.
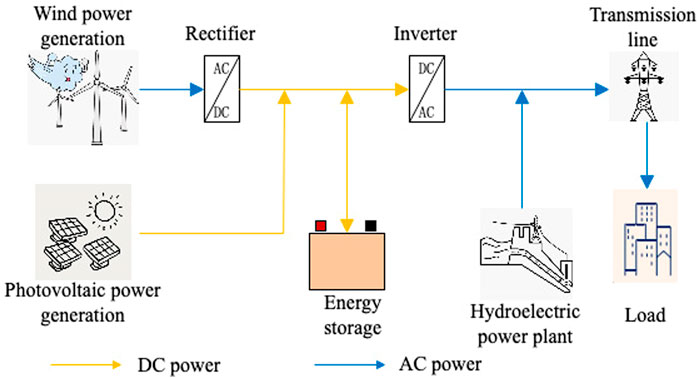
FIGURE 1. Structure diagram of wind/PV/hydropower/storage coupling system.
3.2 Water-wind-light complementarity analysis
According to the mechanism of wind and photovoltaic power generation, its output is influenced by the natural environment (such as wind power level, light intensity, and temperature.) and is highly volatile. Wind power generation relies on wind generating units, which converts wind kinetic energy into electric energy by rotating windmill blades driven by wind. Its power generation is mainly affected by uncertain environmental factors such as wind speed, sunshine, terrain and air pressure. Photovoltaic power generation uses photovoltaic effect to convert solar energy into electricity. Its power output is non-linear and mainly depends on the external environment such as light intensity and temperature, which makes photovoltaic power generation has significant weather sensitivity. In clear weather, photovoltaic output is generally consistent with the changing trend of light intensity and temperature, showing a parabolic shape. However, under the condition of cloudy or rainy weather, photovoltaic output shows an obvious decline.
The Hanzhong area in southern Shaanxi Province is taken as the research object in this paper. This region is the subtropical climate with abundant rainfall and sufficient power output from hydropower plants. Due to its location at the southern foot of the Qinling Mountains, the wind power rises along the mountains, resulting in increased wind power and sufficient wind energy. According to the distribution of wind speed and air density during the year, the local wind turbine output is maximum in winter and spring, and minimum in summer. The climate is humid and mild, with four distinct seasons, long frost-free period, warm and dry spring, cool and wet autumn, and abundant light energy. The average annual flat source temperature is about 15°C, the sunshine hours are between 1495.6 h and 1836.2 h, and the frost-free period is more than 8 months on average, so there are more superior conditions for photovoltaic wind turbine power generation.
For the wind-light-water storage complementary power generation system, the battery capacity configuration is relatively small, mainly for smoothing the fluctuation of the short-time wind-light power, which can avoid the phenomenon of frequent start and stop of the hydropower unit due to the fluctuation of the total wind-light power. However, the hydropower unit is mainly used to maintain the balance of the system power supply, the power balance between the power supply system and the load can be expressed by the following formula.
where, PL(t)–load power; PPV(t)–photovoltaic power output; PW(t)–wind turbine power output; PHP(t)–hydroelectric power output; PB(t)–battery discharge power.
In terms of system power complementarity, according to the analysis of the natural complementary characteristics of water-wind-light in the region, the local hydropower resources are very unevenly distributed in time, with sufficient water resources in the rainy season and scarce in the dry season, which makes the power grid in the dry period having a huge risk of energy supply shortage. The wind power and photovoltaic energy supply and demand are in line with hydropower’s dry season and flood season, which can provide considerable power support for the dry season when hydropower is insufficient, effectively alleviating the contradiction of seasonal supply and demand balance, which is a useful complement to hydropower on a long-term scale. In terms of capacity complementary characteristics, hydropower with certain regulation capacity can use the reservoir storage capacity to smooth out the natural water changes to achieve rapid and accurate control of power output, which has good capacity characteristics. Wind power photovoltaic is affected by natural factors with strong uncertainty, wind power daytime low night high power characteristics make it having a significantly anti-peak characteristics, large-scale wind power access often increase the pressure of grid peaking at the same time also bring greater fluctuations in system power. However, the complementary operation of wind power and photovoltaic can not only effectively alleviate the intensification of peak load regulation during the day, but also effectively make hydropower transfer its low power to peak load during the low load period, converting the power benefit into capacity benefit. So that hydropower in the peak load period has sufficient capacity space for full peaking operation, to improve the hydropower peaking capacity at the same time also effectively suppress the short-term volatility of wind power photovoltaic. When the wind-light output can meet the load demand, hydropower units do not carry out power generation operations, the use of reservoirs to store natural water. When the wind-light output does not meet the load demand, the use of hydropower devices to supplement the missing power, and when the full generation of hydropower still cannot meet the load demand, load cutting operations should be carried out.
In summary, the wind-light-water resources in the region have strong complementary characteristics throughout the year, so it is suitable to add wind-light storage power generation devices on the basis of existing hydropower plants. Not only the extraction of fossil energy can be reduced, but also the utilization rate of clean renewable energy can be effectively increased. The combined operation of wind, light and water mainly uses the energy storage characteristics of the hydropower plant itself and the flexible start-stop feature to calm the sharp fluctuations of wind power and photovoltaic, hydropower and wind-light combined operation can improve the impact of wind power and photovoltaic volatility on the power system, reduce wind power abandonment. On the other hand, it can also make up for the lack of seasonal characteristics of hydropower to a certain extent by using the complementarity between the two, which provides an important support for future research on multi-energy complementary coordination.
3.3 Mathematical model of multi-energy complementary system
In this paper, wind-light-water storage is used as the research object to configure the optimal wind-light storage power supply capacity for existing hydropower plants to meet the regional power supply demand. According to the characteristics of each power source within the power supply system, a capacity configuration model is established, which takes power system investment cost and battery capacity minimization as the target and power balance, SOC, and hydropower unit as the constraints. The calculation results are also evaluated and analyzed in terms of load shortage rate, battery charging and discharging times and the number of starts and stops of hydropower units.
3.3.1 Systematic investment model
The prerequisite for capacity configuration of the system is to calculate the investment cost of the system. The system investment mainly includes wind turbines, photovoltaic installations, and battery storage systems. Wind turbines and PV installations have a long service life (generally considered to be up to 20–25 years for wind turbines and 25 years for PV installations), so the time value of the fund needs to be considered. In addition, when PV installations exceed their useful life, the power generated is only about 80% of their rated power, which affects the power generation revenue. The investment costs of PV systems, wind power systems and energy storage systems are described in turn in the following section.
1) Photovoltaic systems
In the construction of a PV system, its initial construction cost needs to be considered and equated to years (i.e., the average annual initial investment cost). In addition, PV power is DC power, and in order to convert it into AC power that can be used directly by the system, a converter matching the power generation capacity needs to be purchased, which likewise needs to be equated to years (i.e., the annual equivalent cost of the PV converter). During the working of the system, its implementation of strict maintenance measures is needed, so the operation and maintenance costs of the system also need to be considered. In summary, the investment cost of PV system mainly considers the average annual initial investment cost Cpv of PV system, the operation and maintenance cost CPVOM of PV system and the annual equivalent cost CPVCON of PV converter.
The average annual initial investment cost of a PV system can be expressed as follows.
where, PPV–Total PV capacity; Upv–Installed cost of PV unit capacity; γ–Interest rate; lpv–Life of PV installation.
The annual operation and maintenance (O&M) cost of a PV system can be expressed as the product of the PV capacity and the O&M cost per unit of capacity.
where, Mpv–unit capacity PV O&M costs.
The annual equivalent cost of a PV converter is related to the equipped PV capacity and can be expressed as the following.
where, UPVCON–PV converter unit power cost; LPVCON–PV converter lifetime.
2) Blower system
Consistent with the PV system, the investment cost of the wind turbine power generation system is mainly the average annual initial investment cost Cw of the wind turbine system, the operation and maintenance cost CWOM of the wind turbine system and the annual equivalent cost CWCON of the wind turbine converter.
The average annual initial investment cost of the wind turbine system can be expressed as the following.
where, PW–total capacity of the wind turbine system; UW–installed cost per unit capacity of the wind turbine system; lw–life of the wind turbine.
The annual operation and maintenance cost of the wind turbine system can be expressed as the product of the capacity of the wind turbine system and the operation and maintenance cost per unit capacity.
where, MW–unit capacity wind turbine operation and maintenance costs.
The wind turbine should be installed with the same power converter device, so the equivalent annual cost of the converter should also be included in the primary investment in the wind turbine system.
where, UPVCON–PV converter unit power cost; LPVCON–PV converter lifetime.
3) Energy Storage Systems
Consistent with PV and wind turbine systems, the investment cost of the energy storage systems are mainly the average annual initial investment cost CB for energy storage systems, the operation and maintenance cost CBOM for energy storage systems, and the annual equivalent cost CBCON for converters.
Remaining useful life (RUL) of the battery in energy storage system is closely related to its own operating conditions and external ambient temperature. Overcharging and discharging of the battery, overvoltage, and high temperature of the external environment will reduce the RUL of the battery, and even require frequent battery replacement, which will inevitably increase the expenses and impact on the investment. Battery performance degradation is a complex multidisciplinary coupled problem of electrochemistry and electro-physics, and it is difficult to establish a unified RUL prediction model with universal applicability. In order to simplify the calculation, multiple overcharging and discharging will shorten the life of the battery in this paper, so the RUL of the battery is simplified to the number of times with the battery being charged and discharged to equivalently describe the life of the battery. At this time, the average annual investment cost of the battery can be calculated based on the average number of cycles per year.
where, NE–battery annual average charge and discharge times, UBP -battery unit power cost, PB -battery rated power, UBE–battery unit energy cost, EB–battery rated capacity and NB–battery cycle life.
The annual O&M cost of an energy storage system can be expressed as the product of the capacity of the energy storage system and the O&M cost per unit of capacity.
where, MB–unit power battery O&M cost.
The installation of the energy storage device should be configured with a converter device with the same total power, so the equivalent annual cost of the converter should also be included in the primary investment of the energy storage system.
where, UBCON - battery converter unit power cost; LBCON - battery converter life.
3.3.2 Capacity optimal allocation model
In this section, the capacity optimization allocation model of the wind-light-water storage system will be studied, mainly including the objective function, constraint function and evaluation index of the system.
1) Objective function
In this section, the objective function is defined as the minimum total system investment cost and the minimum battery capacity. The total system investment cost C minimization can be expressed as:
where, CA - total annual initial investment cost of wind-light storage power, COM - annual operation and maintenance cost of wind-light storage power, and CCON - annual equivalent cost of wind-light storage converter.
When configuring the system capacity, wind power, photoelectricity and hydropower should be made to meet the load power demand as much as possible to avoid repeated charging and discharging of the battery which affects the battery life and system investment cost. In the constraint of minimum battery capacity, it is first necessary to define the power mismatch ratio.
where, γ - new energy relative load ratio, Ppv(t), PW(t), Php(t), - photovoltaic, wind power, hydropower output power at each moment, Pbat - battery charging and discharging power, and PL(t) - load power.
The energy stored in the battery is not constant, the size of the energy changes from time to time with the process of storing or releasing energy, so the size of its energy is a function of time. The maximum energy that can be stored in the storage system is related to the size of its own capacity, which can be expressed in the ideal case as the following.
where, H_store(t)–relation of energy with time in the ideal case.
When wind, light and water power generation meet the consumption of energy storage devices and load demand, there is still a surplus will be stored in the battery, and the capacity of the battery increases with time.
Then the objective function to ensure the minimum capacity of the battery is the following.
2) Constraints
In this section, three constraints including instantaneous power constraint, state of charge (SOC) constraint and supply reliability constraint are set.
The instantaneous power constraint defines the daily energy inequality measure Wi as:
where, EB(i-1) - the previous day’s battery surplus power, ηin - battery charging efficiency, EW(i), EPV(i), EHP(i) - the total power generation of wind, light and water power sources on that day, and QL(i) - the total load on that day.
The energy storage system charge state constraint SOC can be expressed as the following.
where, Hc(t) - the actual capacity of the battery storage device can store.
The reliability of power supply can be expressed as the following.
where, Pout(t) - the total output of the wind-light-water system at the moment t, and PL(t) - the load demand at the moment.
3) Assessment indicators
In this paper, two objective functions are established as the minimum economic cost and the minimum battery capacity, so the Pareto optimal solution set is approximated as a curve on a two-dimensional plane or uniformly distributed around a curve. In order to select the optimal solution from the optimal solution set as the solution result of this problem, the evaluation scheme is developed as following. In the two-dimensional right-angle coordinate system, the horizontal axis is the economic cost and the vertical axis is the battery capacity, at this time each solution in the optimal solution set can correspond to a point on the two-dimensional plane. Then all the candidate solutions are put on the two-dimensional plane and the Euclidean distance to the origin is calculated. Finally, the solution with the smallest distance is the optimal solution. The distance is calculated by Eq. 23.
where, di - the distance of the ith solution from the origin, f1,i - The ith solution corresponds to the value of objective function one, and f2,i - The ith solution corresponds to the value of objective function two.
4 Analysis of algorithms based on multi-objective evolutionary algorithms
In this section, the capacity of wind-light-water storage units are configured to make full use of the complementary characteristics of each power source and weaken the impact of the instability of new energy output on the grid. Based on the wind-light-water storage mathematical model established in the previous paper, the most economical storage units of wind-light are configured for existing hydropower plants based on an improved multi-objective evolutionary algorithm and compared with the traditional multi-objective optimization algorithm.
4.1 Improved multi-objective evolutionary algorithm
In this paper, an improved multi-objective optimization algorithm is proposed, which mainly consists of non-dominated dynamic weight aggregation by using a genetic algorithm (NDWA-GA) and PCA-based Pareto optimal space. The proposed NDWA-GA algorithm is used to search for a given set of Pareto optimal solutions and learn the Pareto optimal space from the found Pareto optimal solutions.
1) Non-dominated dynamic weight aggregation by using a genetic algorithm
Individuals with good suitability in single objective optimization have difficulty in convergence in the search space of the corresponding multi-objective optimization problem. The NDWA-GA proposed in this paper adopts the non-dominated sorting method, which is the most commonly used method in multi-objective optimization to solve this problem.
The NDWA-GA uses non-dominated sorting for solution selection, that is, before the selection operation is executed, the populations are sorted according to the dominant and non-dominated relationships, which can be outlined as the following steps. First, the individuals in the parent and replacement populations are combined, and all individuals are sorted according to the Pareto dominance relationship. The non-dominated solutions are selected with the marker order of 1. Then, based on the individuals in the first non-dominated front, the non-dominated solutions are selected among the remaining individuals with the marker order of 2 (that is the second non-dominated front), and so on until every individual is marked to form multiple dominance front arrays. The individuals in each non-dominated front after sorting are considered to be non-dominated by each other. The individuals on the first non-dominated front are considered to be the best, and the former non-dominated front dominate the latter non-dominated frontier.
The NDWA-GA algorithm search process can be summarized as follows. Given the objective function f(x) to be optimized and initialize the maximum number of iterations T and the population size L. Subsequently, the weight vector is randomly generated and the population is initialized. After the iteration, the non-dominated solution is selected from the file as the result of the algorithm search. Each iteration of the NDWA-GA algorithm consists of four parts.
Step 1. periodically transform f(x) into a single-objective optimization problem using the weight vector ind and encode it.
Step 2. calculate individual fitness based on the encoding results and classify individuals according to their dominance relationships. Then generate offspring using the genetic operator.
Step 3. count the non-dominated solutions into the file.
Step 4. perform iterations and select individuals with good convergence performance from the population as parents to participate in the next iteration.
2) Pareto optimal space based on the PCA
Unlike traditional PCA which uses the mean to populate the non-dominant components, the median value is used to populate the non-dominant components in this paper. The reason is that non-all non-dominated solutions happen to lie in the Pareto optimal front surface. In dimensionality reduction, these non-dominated solutions that do not lie in the Pareto optimal front plane are called outliers. Removing outliers from the entire dataset is not an easy task, and outliers usually affect the results. In summary, using the median will generate a more accurate Pareto optimal space than using the mean.
The basic process of the PCA-based Pareto optimal space algorithm can be outlined as follows.
First, the matrix representation of the Pareto optimal solution takes the form of
Second, the eigenvalues of the covariance matrix of M are calculated, and the principal components are found according to the given threshold.
Third, the median of each column of M is calculated, and then the lower and upper limits of x are set to the corresponding medians. Finally the Pareto optimal subspace is generated by sampling all points in the updated M.
The overall flow chart of the algorithm is shown in Figure 2.
The Pareto optimal solution set can be found based on the NDWA-GA. The convergence of the solution set can be promoted by dimensionality reduction of the optimal space. Then, the diversity problem of the solution set is dealt with by solving a set of single-objective optimization problems in the optimal Pareto subspace. Finally, the stability of the optimal solution is guaranteed not to be eliminated in the iterative process.
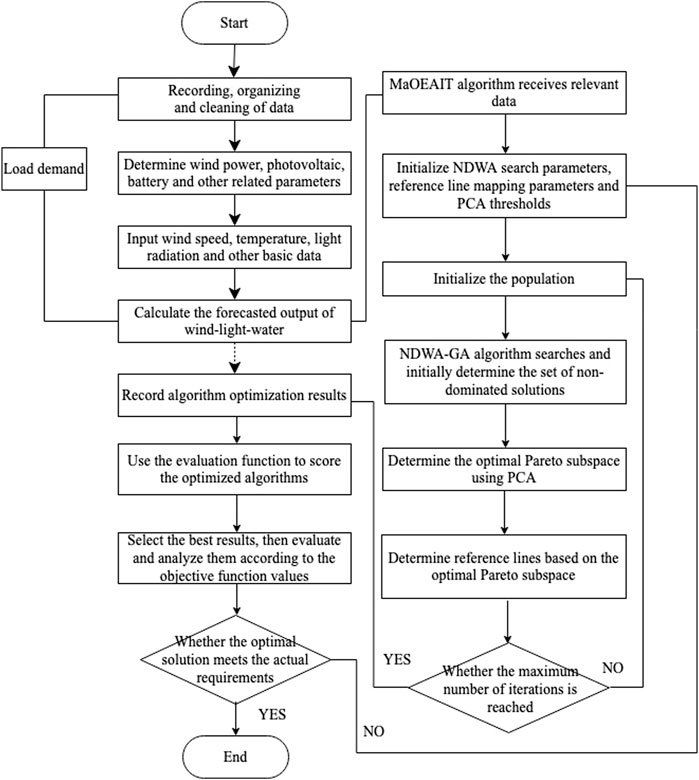
FIGURE 2. Flow chart of independent two-stage multi-objective evolutionary algorithm.
4.2 Capacity configurations
The load data of the region in recent years show that the monthly average load curve in a year has certain fluctuations, with the peak value of monthly average load being about 1084021 MW and the lowest value of daily average load being 518037.8 MW. The electricity load mainly includes industrial electricity, urban transportation, agriculture/forestry/pastoralism/fishery/water conservancy, lighting, and household appliances. The load change curves of two consecutive typical years is shown in Figure 3.
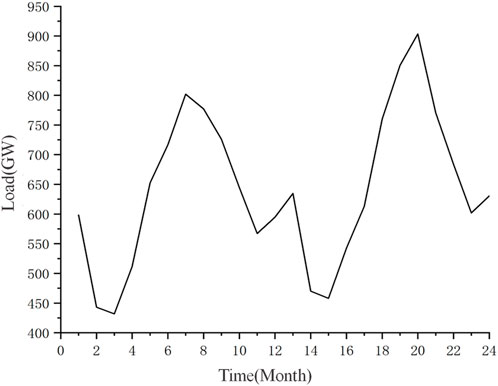
FIGURE 3. Annual load change curve.
In this paper, the parameters related to each power source of wind-light-water storage in the complementary power generation system are set as summarized in Table 1.
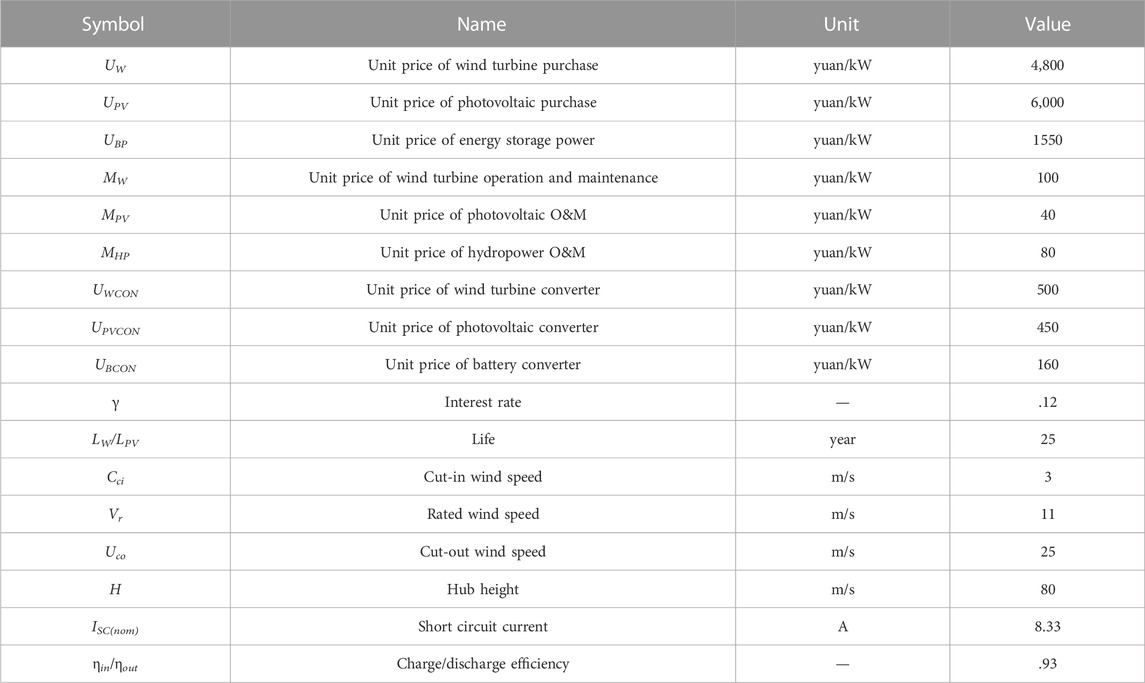
TABLE 1. The cost of each power supply and related parameters.
According to the capacity optimization configuration model, the output power of wind power and photovoltaic is solved by using monthly climate data, and the capacity configuration of four power sources of wind, light, water and storage is optimized according to the load demand in each time period based on the multi-objective evolutionary algorithm proposed in the previous paper. Considering the energy consumption characteristics of the battery device when charging and discharging, it is assumed that the charging and discharging efficiency of the battery ηin = ηout = .93. In the algorithm, the initial number of individuals is set to 100, the reference mapping line is set to 6,000, the non-dominated dynamic weight aggregation is set to 20000, the maximum number of iterations is set to 20000, and the crossover rate and variation rate are set to 1.0 and 1/3, respectively. The simulated binary crossover (SBX) and polynomial mutation (PM) are used as the crossover and mutation operators, respectively.
Setting the new energy relative load generation ratio γ = 1.1 in the region, the optimal configuration of the capacity of the four power sources in the complementary power generation system in the current time scale is shown in Table 2, and the corresponding specific capacity and investment cost values of the wind-light storage are shown in Table 3.
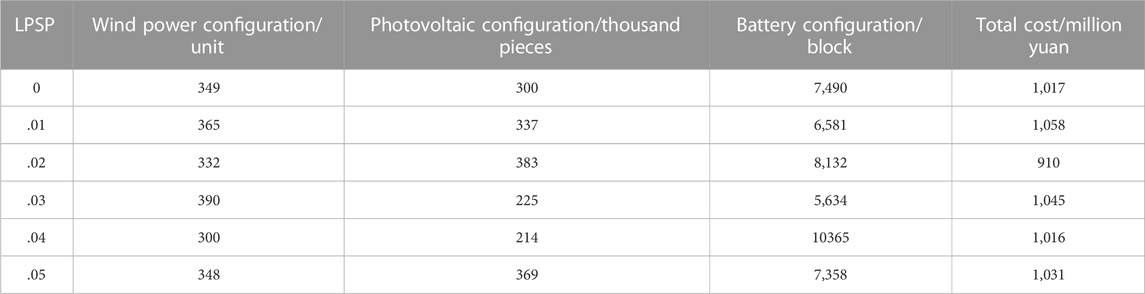
TABLE 2. Optimal allocation of unit quantity.
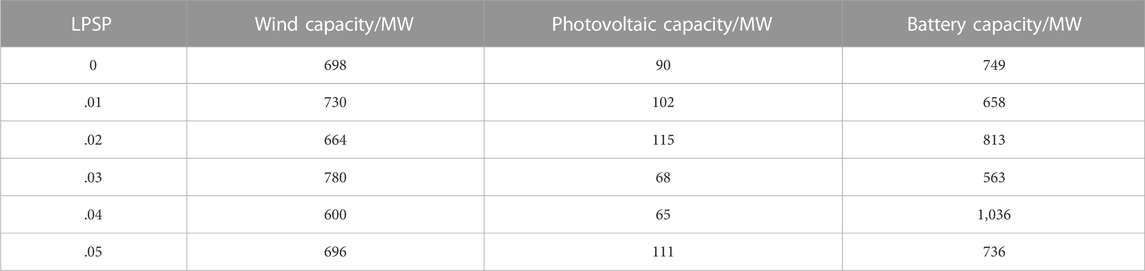
TABLE 3. Optimal allocation of unit capacity.
The loss of power supply probability (LPSP) is an important index to evaluate the reliability of distributed complementary power generation system. To improve the reliability of power supply of the system means reducing the rate of load outages.
4.3 Algorithm comparison
Unlike single-objective optimization problems, solving multi-objective optimization problems often yields a set of approximate Pareto optimal solution sets rather than individual solutions. Therefore, it is not possible to determine the performance of the algorithms directly by comparing the magnitude of the function values of the solutions obtained by the algorithms. In order to compare different algorithms, the Inverted Generational Distance (IGD) evaluation metric is introduced. The convergence performance and distribution performance of the algorithm are evaluated by calculating the minimum distance sum between each point on the real Pareto front surface and the set of individuals obtained by the algorithm. The smaller the value, the better the overall performance of the algorithm, including convergence and distribution performance. IGD can be expressed as the following.
where, P is the set of points uniformly distributed on the real Pareto surface, |P| is the number of individuals in the set of points distributed on the real Pareto surface, Q is the optimal Pareto optimal solution set obtained by the algorithm. d (v,Q) is the minimum Euclidean distance from the individuals v in P to the population Q. Therefore, IGD is used to evaluate the comprehensive performance of the algorithm by calculating the average of the minimum distances from the real Pareto surface set to the obtained population. Meanwhile, it can be seen that if the convergence performance of the algorithm is relatively good, the d (v,Q) is relatively small, so that the convergence performance of the algorithm can be evaluated. However, when the distribution performance of the algorithm is poor and most of the individuals in the population are concentrated in a narrow area, the d (v,Q) of many individuals will be large.
In order to better demonstrate the accuracy and applicability of the methods used in this paper, the reference-point based non-dominated sorting approach (NSGA-III) (Deb and Jain, 2014), adaptive reference vector-guided evolutionary algorithm using growing neural gas (RVEA-iGNG) (Liu et al., 2022), multiple single objective Pareto sampling (MSOPSII) (Hughes, 2007) are compared, and the parameters of each algorithm are selected as shown in Table 4.

TABLE 4. Hyper parameters selected by different algorithms.
The convergence of the new multi-objective algorithm proposed is compared with other algorithms though the mean and standard deviation values of IGD of different multi-objective algorithms for solving wind-light-water storage capacity allocation optimization problems. The IGD indicators of each multi-objective algorithm are shown in Figure 4.
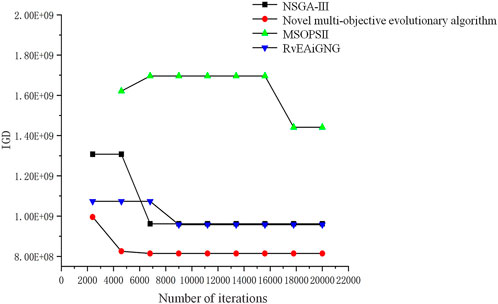
FIGURE 4. Comparison of IGD of different algorithms.
From the characteristics of IGD indicator, it can be concluded that the smaller the IGD value, the better the convergence of the algorithm for the problem. As shown in Figure 4, the IGD value of MSOPSII is higher than other algorithms in the current iteration interval, so it is considered to have the worst performance in solving the wind-light-water storage capacity configuration model proposed in this paper. The IGD value of NSGA-III is higher than that of RvEA-iGNG when the number of iterations are 2,400 and 4,600. However, when the number of iterations is 6,800, it is lower than that of RvEA-iGNG. When the number of iterations is higher than 9,000, the IGD values of NSGA-III and RvEA-iGNG are consistent. The IGD value of the improved multi-objective evolutionary algorithm proposed in this paper is always the minimum in the current iteration interval, which is the best comprehensive performance compared with other algorithms. Therefore, the proposed algorithm has a greater advantage in dealing with the wind-light storage capacity allocation problem, which provides algorithmic support for the solution of the wind-light-water storage capacity allocation problem. Usage of this algorithm for solving such planning problems can effectively speed up the bi-objective solution speed as well as the accuracy requirements and avoid the phenomenon of premature convergence of the algorithm.
4.4 Multi-energy complementary model comparison
In order to verify the feasibility of the wind-light-water storage model in practical application, this section constructs the light-water storage model and the wind-water storage model, and compares the economy of their capacity configuration and the capacity of the battery. Based on the improved multi-objective optimization algorithm proposed in this paper, the optimal capacity of the light-water storage model and the wind-water storage model are configured.
This paper selects LPSP = .02 to analyze the capacity configuration of each system. The comparison results are shown in Table 5: wind-water storage model is model I, light-water storage model is model II, and wind-light-water storage model is model III.
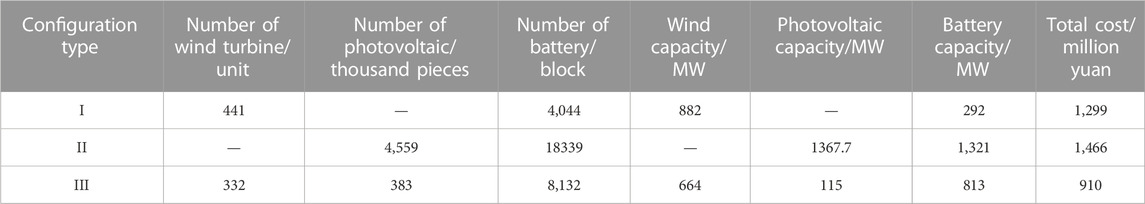
TABLE 5. Optimal allocation of different energy system.
As shown in Table 5, the part of the hydropower station with insufficient output in the wind-water storage model is provided by wind turbines and batteries, so the number of wind turbines are higher than that of the wind-light-water storage system. In the light-water storage model, the insufficient output of the hydropower station is provided by photovoltaic panels and batteries, so the number of photovoltaic systems are higher than that of the wind-light-water storage system.
By comparing the total cost of different energy structures, the wind-light-water storage system is the lowest, the wind-water storage system is the second, and the light-water storage system is the highest. The comparison of storage battery capacity configuration under different energy structures show that wind-water storage is the lowest, wind-light-water storage is the second, and light-water storage is the highest. In conclusion, the wind-light-water storage system established in this paper has the lowest total cost by compared with wind-water storage system and light-water storage system.
4.5 Analysis of monthly outputs
Wind, photoelectric power station output fluctuates frequently, in different seasons and time presents randomness, fluctuation, intermittent and other characteristics, and different areas by wind speed, light and other meteorological factors also have a large difference. The output size of wind and solar power plants is related to numerous factors, including wind speed, wind direction, air pressure, temperature, light intensity, light duration, topography, unit parameters, transmission channels, and grid regulation requirements.
To better illustrate the configuration results and guide production, the output of the wind-light-water load is calculated for a load shortage rate of .02, as shown in Figure 5.
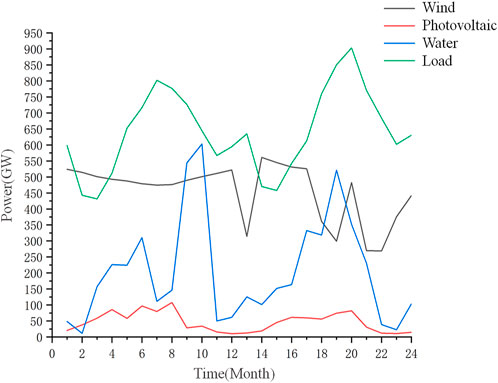
FIGURE 5. Monthly output of wind/PV/hydropower/storage system.
As can be seen from the Figure 5, PV is more out between April and August. According to the local illumination data, the illumination time during the period is about 140 h per month, and the total daily radiation curve is 17000 kJ/m2/d for the whole year, which is higher than other months year-on-year. At the same time, considering the influence of temperature on photovoltaic power generation devices, the local area is in spring and summer season, with little temperature change, which has less influence on photovoltaic power generation devices and can generate power at a higher level. Wind power generation in the following January and June to December has less power output and fluctuates sharply. From the data, it can be seen that the wind speed is low and the air density is lower than the rest of the months in the same period, so the wind power generation plant produces less power. The hydroelectric power generation fluctuates throughout the year, and the maximum output is from September to October, because the reservoir level increases in the early rainy season, resulting in an increase in water storage and the output capacity fluctuating greatly. Considering the normal operation of reservoirs and downstream safety issues, reservoirs have to be released to reduce risks, and reservoirs will only be released when a certain amount of water is accumulated. Local power generation water consumption increases, and reservoir output increases, but the season brings a high fluctuation of reservoir output due to abundant and dry seasons. The load shows cyclical fluctuations, with low in spring and autumn and high in summer and winter. Considering the increase in electricity consumption of general users by the seasons, industries such as agriculture and industry also face high electricity consumption for irrigation and equipment maintenance. The load is higher than wind and water output in the same period for a long time existing in the form of power shortage.
Considering the demand of wind-light-water and load, in February-March every year, wind power generation meets the load demand and light and water will be stored in the form of energy in the battery. In the rest months, the output of wind-light-water is lower than the load demand, and the accumulated sum is also lower than the load end demand. At this time the battery output is enough to make up for the load demand, to make up for the shortage caused by the lack of local wind-light-water output. Through the battery discharge to meet the shortage, the utilization rate of wind-light-water can be improved, effectively avoiding the waste of resources caused by the volatility of wind-light-water.
5 Conclusion
In this paper, a multi-objective evolutionary algorithm based on the NDWA-GA and the PCA with Pareto optimal space is proposed for the optimal capacity allocation of the multi-energy complementary system. The wind-light-water storage complementary power generation system is constructed, which mainly includes wind turbine, photovoltaic battery array, hydroelectric power station and energy storage part. Then the wind-light-water storage power supply is added to the current hydropower station, and the wind-light-water storage capacity optimization configuration model satisfying various constraints is established with the objective of minimizing the total investment cost and battery capacity of the system. Finally, the proposed novel multi-objective evolutionary algorithm is used to optimize the capacity configuration of each power supply in the complementary power generation system with the load shortage rate as the evaluation index. The configuration results show that the value of LPSP has a direct impact on the number of individual units to be configured. When the load shortage rate is .02, the optimal capacity configurations of wind, light, and storage are 664 MW, 115 MW, and 813 MW, respectively. Moreover, compared with the traditional multi-objective evolutionary algorithm, the results show that the proposed algorithm has better convergence, which verifies the effectiveness and accuracy. At the same time, compared with the light-water storage model and the wind-water storage model, it is proved that the wind-light-water storage model proposed in this paper has the lowest economic cost under the premise of accurate prediction of hydropower station output. The proposed model improves the application rate of clean energy, typically represented by wind-light, on the premise of achieving accurate prediction of hydro power plant output, which helps to improve the energy pattern of Chinese mainly thermal power plants and is of great significance for energy conservation and emission reduction.
The wind-light power output characteristics are closely related to the climatic conditions, with frequent fluctuations in power output, showing random, fluctuating and intermittent characteristics in different seasons and diurnal time sequences. There are also large differences in different regions affected by wind speed, light and other meteorological factors. However, there is no accurate description of the spatial and temporal output law of the wind-light power plant yet, and the capacity allocation of the multi-energy complementary model can only be done by historical data, which has certain limitations, and this will be further studied in our future work.
Data availability statement
The raw data supporting the conclusions of this article will be made available by the authors, without undue reservation.
Author contributions
YW: Data curation, Methodology, Resources, Software, Writing—original draft, Writing—review and editing. JL: Methodology, Project administration, Resources, Software, Writing—review and editing.
Acknowledgments
Special thanks to colleagues who provided help and guidance on this article.
Conflict of interest
The authors declare that the research was conducted in the absence of any commercial or financial relationships that could be construed as a potential conflict of interest.
Publisher’s note
All claims expressed in this article are solely those of the authors and do not necessarily represent those of their affiliated organizations, or those of the publisher, the editors and the reviewers. Any product that may be evaluated in this article, or claim that may be made by its manufacturer, is not guaranteed or endorsed by the publisher.
References
Abdin, Z., and Merida, W. (2019). Hybrid energy systems for off-grid power supply and hydrogen production based on renewable energy: A techno-economic analysis. Energy Convers. Manag. 196, 1068–1079. doi:10.1016/j.enconman.2019.06.068
Alghussain, L., Samu, R., Taylan, O., and Fahrioglu, M. (2020). Sizing renewable energy systems with energy storage systems in microgrids for maximum cost-efficient utilization of renewable energy resources. Sustain. Cities Soc. 55, 102059. doi:10.1016/j.scs.2020.102059
Bekele, G., and Tadesse, G. (2012). Feasibility study of small hydro/PV/wind hybrid system for off-grid rural electrification in Ethiopia. Appl. Energy 97, 5–15. doi:10.1016/j.apenergy.2011.11.059
Chang, R. L. (2020). Research on optimal allocation of capacity for wind-solar-water-storage complementary power generation system. Xi'an, China: Xi’an University of Technology. [master's thesis]. [Xi’an].
Chen, W. R., Fu, W. Q., Han, Y., Li, Q., Huang, L. J., and Xu, C. P. (2021). Optimal configuration of wind-solar-hydrogen multi-energy complementary microgrid with demand side. J. Southwest Jiaot. Univ. 56 (03), 640–649. doi:10.3969/j.issn.0258-2724.20200163
Corne, D. W., Jerram, N. R., Knowles, J. D., and Oates, M. J. (2001). PESA-II: Region-based selection in evolutionary multi-objective optimization proceedings of the genetic and evolutionary computation conference. San Francisco: Morgan Kaufmann Publishers, 283–290.
Deb, K., and Jain, H. (2014). An evolutionary many-objective optimization algorithm using reference-point based non-dominated sorting approach, part I: Solving problems with box constraints. IEEE Trans. Evol. Comput. 18 (4), 577–601. doi:10.1109/tevc.2013.2281535
Deetjen, T. A., Martin, H., Rhodes, J. D., and Webber, M. E. (2018). Modeling the optimal mix and location of wind and solar with transmission and carbon pricing considerations. Renew. Energy 120, 35–50. doi:10.1016/j.renene.2017.12.059
Dou, X. B., Yuan, J., Wu, Z. J., Ni, Y. M., Fan, C., and Xiao, Y. (2016). Improved configuration optimization of PV-wind-storage capacities for grid-connected microgrid. Electr. Power Autom. Equip. 36 (3), 26–32. doi:10.16081/j.issn.1006-6047.2016.03.005
He, Z. N., Yen, G. G., and Zhang, J. (2014). Fuzzy-based Pareto optimality for many-objective evolutionary algorithms. IEEE Trans. Evol. Comput. 18 (2), 269–285. doi:10.1109/tevc.2013.2258025
Heide, D., Von, B. L., Greiner, M., Hoffmann, C., Speckmann, M., and Bofinger, S. (2010). Seasonal optimal mix of wind and solar power in a future, highly renewable Europe. Renew. Energy 35 (11), 2483–2489. doi:10.1016/j.renene.2010.03.012
Hu, L. X., Gu, Y. Y., and Yao, Y. S. (2016). Optimal capacity configuration method for grid-connected wind-solar complementary power system. Power Syst. Clean Energy 32 (03), 120–126.
Hughes, E. J. (2007). “MSOPS-II: A general-purpose many-objective optimiser,” in Proceedings of the IEEE Congress on Evolutionary Computation, Singapore, 25-28 September 2007.
Li, G. F., Bie, Z. H., Wang, R. H., Jiang, J. F., and Kou, Y. (2017). Research status and prospects on reliability evaluation of integrated energy system. High. Volt. Eng. 43 (1), 114–121. doi:10.13336/j.1003-6520.hve.20161227016
Li, Y. Z., Guo, X. J., Dong, H. Y., and Gao, Z. (2020). Optimal capacity configuration of wind/PV/storage hybrid energy storage system in microgrid. Proc. CSU-EPSA 32 (06), 123–128. doi:10.19635/j.cnki.csu-epsa.000322
Liu, Q. Q., Jin, Y. C., Heiderich, M., Rodemann, T., and Yu, G. (2022). “An adaptive reference vector-guided evolutionary algorithm using growing neural gas for Many-Objective optimization of irregular problems,” in IEEE Transactions on Cybernetics 52 (5), 2698–2711.
Liu, Q., Wei, M. K., Zhou, Q., Cai, S. R., Jiang, L., Zhou, H., et al. (2020). Research on capacity optimization configuration of the Southwestern China microgrid considering electricity cost and system self-power supply reliability. Power Syst. Prot. Control 48 (10), 139–145. doi:10.19783/j.cnki.pspc.190782
Liu, Y., Tan, S., and Jiang, C. (2017). Interval optimal scheduling of hydro-PV-wind hybrid system considering firm generation coordination. Iet Renew. Power Gener. 11 (1), 63–72. doi:10.1049/iet-rpg.2016.0152
Mahmoudimehr, J., and Shabani, M. (2018). Optimal design of hybrid photovoltaic-hydroelectric standalone energy system for north and south of Iran. Renew. energy 115, 238–251. doi:10.1016/j.renene.2017.08.054
Ming, B., Liu, P., Guo, S. L., Zhang, X. Q., Feng, M. Y., and Wang, X. X. (2017). Optimizing utility-scale photovoltaic power generation for integration into a hydropower reservoir by incorporating long-and short-term operational decisions. Appl. Energy 204, 432–445. doi:10.1016/j.apenergy.2017.07.046
National Development, Reform Commission, National Energy Board (2021). Guidelines on promoting the integration of charge and storage of power sources and networks and the complementary development of multiple energies. Beijing: National Development and Reform Commission of China ,National Energy Board of China.
National Development, Reform Commission, National Energy Board (2016). The 13th five-year plan for. Beijing: Hydropower Development.
Parastegari, P., Hooshm, R. A., Khodabakhshian, A., and Zare, A. H. (2015). Joint operation of wind, farm, photovoltaic, pump-storage and energy storage devices in energy and reserve markets. Electr. Power & Energy Syst. 64, 275–284. doi:10.1016/j.ijepes.2014.06.074
Portero, U., Velázquez, S., and Carta, J. A. (2015). Sizing of a wind-hydro system using a reversible hydraulic facility with seawater: A case study in the canary islands. Energy Convers. Manag. 106, 1251–1263. doi:10.1016/j.enconman.2015.10.054
Qin, S. F., Sun, C. L., Zhang, G. C., He, X. J., and Tan, Y. (2020). A modified particle swarm optimization based on decomposition with different ideal points for many-objective optimization problems. Complex Intelligent Syst. 6 (6), 263–274. doi:10.1007/s40747-020-00134-7
Sanajaoba, S., and Fernander, E. (2016). Maiden application of cuckoo search algorithm for optimal sizing of a remote hybrid renewable energy system. Renew. Energy 96, 1–10. doi:10.1016/j.renene.2016.04.069
Sheng, S., and Zhang, J. (2017). Capacity configuration optimisation for stand-alone micro-grid based on an improved binary bat algorithm. J. Eng. 13, 2083–2087. doi:10.1049/joe.2017.0696
State Council of the People's Republic of China (2021). The 14th five-year plan for national economic and social development of the People's Republic of China and the outline of the long-range goals to 2035. Beijing: State Council of the People's Republic of China.
Wang, K. F., Xie, L. R., Qiao, Y., Wang, X. F., and Bao, H. Y. (2020). Curtailed wind consumption mode based on threshold setting and hierarchical control of retired batteries. Electr. Power Autom. Equip. 40 (10), 92–98. doi:10.16081/j.epae.202008033
Wang, X. P., Tian, D. D., Meng, M., Liu, J., and Jiang, L. (2013). Total-factor energy efficiency of coal-fired power plants considering environmental constraints. East China Electr. Power 41 (6), 1317–1323.
Xiang, Y., Zhou, Y. R., Li, M. Q., and Chen, Z. F. (2017). A vector angle-based evolutionary algorithm for unconstrained many-objective optimization. IEEE Trans. Evol. Comput. 21 (1), 131–152. doi:10.1109/tevc.2016.2587808
Xu, F. Q., Liu, J. C., Lin, S. S., Dai, Q. J., and Li, C. B. (2018). A multi-objective optimization model of hybrid energy storage system for non-grid-connected wind power: A case study in China. Energy 163, 585–603. doi:10.1016/j.energy.2018.08.152
Yahyaoui, I., Atieh, A., Serna, A., and Tadeo, F. (2017). Sensitivity analysis for photovoltaic water pumping systems: Energetic and economic studies. Energy Convers. Manag. 135, 402–415. doi:10.1016/j.enconman.2016.12.096
Yu, D. X., Zhang, J. H., Wang, X. Y., and Gao, Y. (2019). Optimal capacity configuration of grid-connected wind-PV-storage hybrid power generation system. Proc. CSU-EPSA 31 (10), 59–65. doi:10.19635/j.cnki.csu-epsa.000127
Zhang, L. P. (2012). Multiple energy complementations-An effective approach to promote renewable energy development. Northwest Hydropower (1), 7–12.
Zhang, Z. W., Fan, W., Liu, T., Zhou, J., and Shi, J. K. (2018). Optimal capacity configuration of wind-solar-water-battery complementary power generation system in remote mountainous areas. J. Power Supply 16 (05), 138–146. doi:10.13234/j.issn.2095-2805.2018.5.138
Zhao, T. J., Meng, Q., Wang, J., Ren, M. M., and Zhang, M. C. (2021). Optimal allocation strategy for photovoltaic and electric heating thermal storage capacities in interactive mode. Proc. CSU-EPSA. 33 (05), 9–15. doi:10.19635/j.cnki.csu-epsa.000514
Keywords: multi energy complementary model, multi-objective evolutionary algorithm, capacity configuration, conserve energy, reduce emissions, production guidance
Citation: Wang Y and Liu J (2023) Optimal capacity allocation of wind-light-water multi-energy complementary capacity based on improved multi-objective optimization algorithm. Front. Energy Res. 10:1115769. doi: 10.3389/fenrg.2022.1115769
Received: 04 December 2022; Accepted: 23 December 2022;
Published: 19 January 2023.
Edited by:
Zhiqiang Geng, Beijing University of Chemical Technology, ChinaReviewed by:
Xianning Meng, Daegu University, South KoreaYan Guo, Laboratory of Nuclear Energy Chemistry (CAS), China
Yingying Jiang, University for the Creative Arts, United Kingdom
Copyright © 2023 Wang and Liu. This is an open-access article distributed under the terms of the Creative Commons Attribution License (CC BY). The use, distribution or reproduction in other forums is permitted, provided the original author(s) and the copyright owner(s) are credited and that the original publication in this journal is cited, in accordance with accepted academic practice. No use, distribution or reproduction is permitted which does not comply with these terms.
*Correspondence: Ying Wang, RE5IQkxXVEdAMTYzLmNvbQ==; Jiajun Liu, eGlhbmxpZ29uZ184OEAxNjMuY29t