
94% of researchers rate our articles as excellent or good
Learn more about the work of our research integrity team to safeguard the quality of each article we publish.
Find out more
ORIGINAL RESEARCH article
Front. Energy Res., 13 January 2023
Sec. Process and Energy Systems Engineering
Volume 10 - 2022 | https://doi.org/10.3389/fenrg.2022.1097729
This article is part of the Research TopicOptimal Design and Efficiency Improvement of Fluid Machinery and SystemsView all 18 articles
 Jing Xu1
 Yixuan Lu1,2*
The inventory and delivery rate of water pump are affected largely by the production mode. In order to improve the operation optimization of water pump production model, the simulation test method and system dynamics model were selected in the manuscript. Three different production modes, namely traditional make-to-order (MTO) model, make-to-stock (MTS) mode, and MTO & MTS model, were compared in terms of the indicators such as the inventory, productivity and delivery rate of water pump. Moreover, the three above production modes were also assessed by using the fuzzy comprehensive evaluation method. The results show that it is not well adapted in practical applications for the MTS production model with an intermediate level of inventory and customer demand satisfaction. The MTO production model is appropriate when it’s easy to predict the customer demand that fluctuates scarcely. The MTO & MTS production model should be selected when it’s difficult to predict the customer demand that fluctuates sharply. After comprehensive evaluation, the MTO & MTS production model is the best choice for pump.
Water pumps are a kind of general machine with many types and extremely wide applications. It can be said that wherever the liquid flows, there is almost always a pump at work. According to the statistics of different countries, the power consumption of pumps is about 20% of the total power generation, so pumps are, of course, big energy consumers. Therefore, it’s important to reduce the energy consumption of pumps to achieve a low-carbon economy. As the largest consumer of pump products in the world, China accounts for 61% of the Asian region and nearly 25% of the world’s market. As a powerful manufacturing country, China has globally advanced manufacturing technology and product development capability. Due to bottleneck limitation of pump design level and production capacity, it’s rather difficult to significantly optimize the pump by developing new products, improving production processes and saving materials. Therefore, from the perspective of management, it’s of positive significance to explore the scientific pump production models to improve pump productivity and reduce pump cost.
In 1984, Spencer (Smith, 1984) published Make-to-stock (MTS) and its combination mode of assembly problems in the Journal of Operations Management. Immediately afterwards, a number of studies were carried out by numerous scholars around the issue (Auberger and Ramsauer, 2020). Li et al. (2008) proposed a revenue management model for make-to-order (MTO) production in manufacturing. This is a useful guide for companies with random demand and fixed capacity. Modrak and Soltysova (2020) put forward the MTO mode optimization method in order to reduce cost and shorten the delivery time as much as possible. Subsequently, the mixed production mode of MTS and MTO became increasingly mature in management research. Scholars generally thought that the combination of the two modes could achieve good results in shortening delivery time and reducing production cost. However, the correlation analysis was still mainly focused on the theoretical level. Zhang et al. (2008) compared the application of MTO and MTO & MTS production organization modes in iron and steel enterprises. The results demonstrated that the MTO & MTS organizational model is able to hedge the risk of inaccurate demand forecasts. Not only is the conflict between fast delivery and reduced stock reconciled, but the trend towards more variety and smaller batches of customer demand can also be accommodated. Specifically in the pump industry, despite the wide range and usefulness of pump products. However, there has been very little research on the production management of pumps. Pump design and manufacturing technology is the main area of research focused on by academics (Xu, 2017; Ye et al., 2019). Only a small number of issues are related to pump operation cost-effectiveness (Muszynski and AndrzejczykJakubowska, 2019; Wang et al., 2019; Salakhov et al., 2020); total efficiency of a pump assembly line (Alvarado et al., 2020), design and improvement of pump model (Ji et al., 2021; Xi et al., 2022; Zhu et al., 2022), pump accessory market analysis (Wang et al., 2013); and supply chain management of pump enterprises, such as the discussion on the purchase of multi-variety and small-batch castings (Zhu, 2017), selection and evaluation of the pump suppliers (Liu, 2017; Bi, 2018), optimization of the regional logistics center system (Xu, 2015), and evaluation of the supply chain response ability of the pump valve industry (Zhang et al., 2012). In response to the many product categories, high demand and wide range of applications, as well as the vulnerability of the pump market to seasonal and climatic changes, and other characteristics. In addition, the requirement of supply chain is relatively high. Therefore, there is an urgent need to expand the production management research content of MTO, MTS and MTO & MTS hybrid models in pump manufacturing companies. The refinement of pump industry production management is the future development trend (Sun, 2018). Based on this context, this paper discusses the production organization mode of pump order and its management optimization scheme from the angle of management. And system dynamics simulations were carried out to investigate the effects of different production organization models on the inventory and customer delivery rates of pump companies. In order to better guide the production practices of pump enterprises.
Pumps are classified according to the fluid medium and include different types such as oil pumps, water pumps and vacuum pumps (air pumps). Water pumps are the most common and most widely used type of pump. It includes both the large pumps used in pumping stations and the small pumps commonly found in agricultural irrigation. Among them, the former products have high unit value, most of which are make-to-order (MTO) in the actual operation, represented by the axial flow pumps produced by Jushen Pumps Industry. Whereas the latter products have low unit value, most of which are make-to-stock (MTS) in the actual operation, represented by the small agricultural pumps produced by Shimge Pumps Industry. The different production models vary considerably in terms of customer responsiveness and level of capital employed. This also makes a clear difference to the requirements of corporate supply chain management.
Manufacturing on an MTO basis, a pump manufacturer starts organizing the production after receiving the customer’s order. At the same time, the company purchases raw materials from upstream suppliers and organizes delivery after production is complete. Inventory costs have been significantly reduced, and orders required by the government can be customized. However, water pump enterprises that produce MTO are mostly in a relatively traditional hand-workshop management state due to their small production batches. They have a low level of production automation and a high dependence on key technicians for production.
Manufacturing on an MTS basis, a pump manufacturer checks the inventory after receiving the customer’s order. If the inventory is sufficient, the goods can be delivered immediately. When stocks fall below the desired level, the company starts to organize production to replenish stocks and order response times are significantly reduced. However, owing to the need for maintenance of a certain amount of inventory, the capital and the actual operating costs of enterprises will increase.
To compare the two different production modes, the symbols of this pump manufacturing system are described as follows. DR, Delivery rate; IRF, Inventory rate of pump finished products; OR, Order rate; PPR, Planned production rate; OPR, Order production rate; PC, Production capacity; IDP, Inventory deviation of pump products; EI, Expected inventory; ARID, Adjustment rate of inventory deviation; IQF, Inventory quantity of finished pump; IDAT, Inventory deviation adjustment time; SDHS, Standard deviation of historical sales quantity; CSI, Coefficient of safety inventory; MDT, Minimum delivery time; WIPI, Work-in-process inventory; PCR, Production completion rate; PD, Production delay.
Depending on the different characteristics of MTO and MTS, the corresponding SD model is constructed. On the basis of the enterprises management practice obtained from the field investigation, two different modes of order production management mechanism are designed.
Production management mechanism on an MTO basis: DR = IF THEN ELSE (IRF > OR, OR, 0); PPR = IF THEN ELSE (IRF > OR, OR, 0, OR-IRF); OPR = IF THEN ELSE (PPR < PC, PPR, 0). Production management mechanism on an MTS basis: DR = IF THEN ELSE (IRF > OR, O); IDP = IF THEN ELSE (EI > IRF, EI-IRF, 0), that is, when IRF is lower than EI, IDP is equal to EI deducted inventory rate of pump products; otherwise, the inventory level will not be adjusted, unit: set/week); OPR = IF THEN ELSE (ARID < PC, ARID, 0).
Considering manufacturing on an MTO basis, in the event of a sudden, high-volume emergency order, companies may be overwhelmed. Thereby necessitating an appropriate amount of buffer inventory. The MTS model, on the other hand, requires consistently high stock levels and temporary stock-outs are also difficult to avoid. Therefore, on the basis of MTO and MTS, an order production organization mode of combining MTO and MTS is designed. Figure 1 shows the system dynamics (SD) chart based on the above mode. The order production management mechanism is DR = IF THEN ELSE (IRF > OR, OR, 0). If the stock is greater than the current order quantity, immediate dispatch will be arranged, otherwise no dispatch will be made. Delays in delivery are negotiated with the company depending on the volume of the specific order, unit: set/week; PPR = IF THEN ELSE (IRF–EI>OR, 0, OR + EI–IRF), that is, if the IQF deducting the expected (safety) inventory is more than the order rate, then, the order production will not be prepared, and the products are delivered immediately. Otherwise, the order production is organized according to the order rate; plus, the expected inventory deducts the quantity of finished pump inventory. Unit: set/week; OPR = IF THEN ELSE (PPR + ARID < PC, PPR + ARID, 0), unit: set/week.
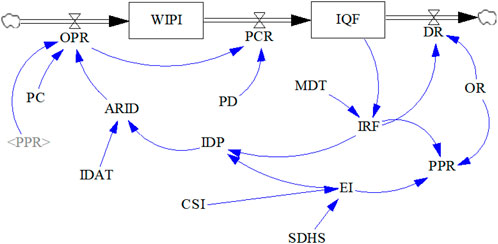
FIGURE 1. SD chart based on the combined MTO and MTS.
The system simulates the initial time as 1, the end time as 100, and the time step as 1. The basic variables and descriptions are explained as follows. The SDHS = 52, which is calculated according to the historical sales data of a certain type of pump from January to November in 2019 of JS pump company, unit: set/week; Customer service level can be reflected by the CSI, the supply satisfaction of enterprises can reach nearly 98% when CSI is two; IDAT = 1, unit: set/week, that is, when the inventory is lower than the safety inventory, 1 week is required to recover to the safety inventory. ARID = DELAY FIXED (IDP, IDAT, 0), and it reflects the level of inventory deviation that requires adjustment, unit: set/week; MDT = 1, unit: set/week; EI = SDHS * CSI, which is a buffer inventory for enterprises to deal with demand uncertainty, which is synonymous with safety inventory, unit: set/week; WIPI = INTEG (OPR-PCR, 28), unit: set/week; IQF = INTEG (PCR–DR, 118), the initial value of inventory is 118, unit: set/week; IRF = IQF/MDT, unit: set/week; PCR = DELAY FIXED (OPR, PD, 0), some production delay from order to finished product is reflected, unit: set/week; Production delay = 1, unit: weeks; Production capacity = 200, unit: weeks.
The test in the SD model includes theoretical test and historical tests. Of which, the theoretical test includes three aspects: the consistency test of model structure and actual system, the consistency test of equation and dimension, and robustness test of model structure. As this paper was actually communicated with the company prior to the modelling. The feedback structure and equations are fitted to the main characteristics of the actual system and the relevant data are derived from the actual data of the enterprise. Therefore, the model is consistent with the actual production management theoretical model of the enterprise. The equation and magnitude check functions that come with the Vensim software are used. The results all passed, indicating that the model is valid.
In order to simulate the variation in order production at JS Pumps, the order rate = INTEGER [RANDOM NORMAL (0, 200, 24, 52, 20)] is set. Which reflects the transformation of each variable in the case of random change in customer demand. Where 24 is the mean, 52 is the standard deviation, 0 is the minimum and 200 is the maximum. Notably, these data are calculated on the bases of the data of JS Pump Company from January to November 2019. The noise was set as a function of a random normal distribution of 20 as the customer order rate, due to the highly volatile demand, unit: unit/week.
Variations of a pump company’s inventory over time. Figure 2 depicts the change in the WIP inventory of a pump company under three different production organization modes. Obviously, the MTO inventory is the smallest. The combined MTO & MTS model has a relatively larger inventory, but the overall difference is not significant.
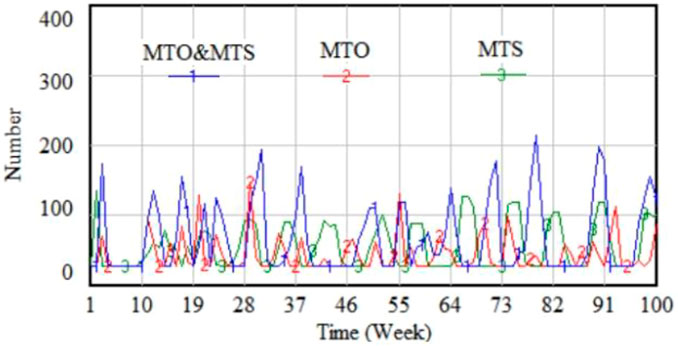
FIGURE 2. Changes in WIPI of pump enterprises.
Variations in a pump company’s order productivity and delivery rate over time. As can be observed from Figure 3, companies with a combined MTO and MTS type order management model have higher shipment rates. This indicates a higher level of order delivery for pump customers under this model. Through further inspection of the data, the number of out-of-stock orders under the MTO, MTS, and MTO & MTS order management modes are respectively found to be 48, 25, and 11 during the 100 simulation periods. Evidently, the enterprise production organization and customer service level of the MTO & MTS combined order production organization mode are more optimal.
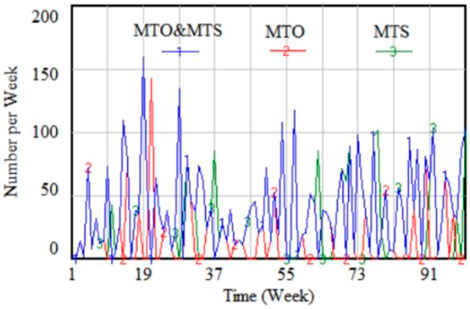
FIGURE 3. Changes in order delivery.
The influence of the CSI on delivery rate under the MTO & MTS combined order production organization mode. Figure 4 compares the changes in the pump companies’ delivery rates of pump companies when the CSIs are 0, 2, and 3. It is clear that as safety has improved, so has the satisfaction rate of pump companies ordering services. The numbers of out-of-stocks in 100 periods respectively are 48, 11, and 2. The validity of the model is further validated in terms of the correspondence between safety stock factors and service levels.
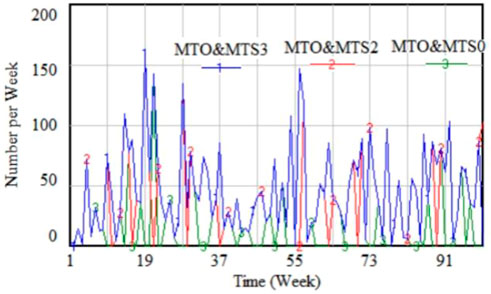
FIGURE 4. Influence of CSI on DR in the case of the MTO & MTS combined mode.
The fuzzy comprehensive evaluation method (FCE) is an evaluation method based on fuzzy mathematics. In this paper, FCE is used to compare and evaluate the MTO, MTS, and MTO & MTS combined production management mode and to verify the accuracy of the previous numerical simulation results.
According to expert consultation and literature review, the FCE method is used to first set up the evaluation index set. Build the index set U = {U1, U2, U3, U4, U5} = {Inventory (IN), Order response time (ORT), Equipment utilization (EU), Total cost (TC), Customer satisfaction with diversified demand (CSD)}, then, build the evaluation set V = {V1, V2, V3, V4, V5} = {Huge advantage, Slight advantage, General, Slight disadvantage, Huge disadvantage}, and the grading level set F = (1, 0.8, 0.6, 0.4, 0.2)T.
In order to determine the weights of each evaluation indicator of the production management model using the hierarchical analysis method (AHP). First, the judgment matrix is constructed, and the corresponding importance level of the two schemes is expressed in the form of the ratio of two importance levels. Table 1 shows the proportional scale.
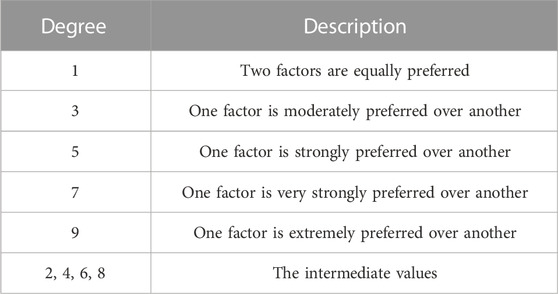
TABLE 1. Proportional scale.
Afterwards, experts in the relevant fields are invited and consulted on the actual operation of the companies using the three models. The importance of the indicators is assigned for comparison, so the weighting judgment matrix is constructed. Table 2 presents the judgment matrix.
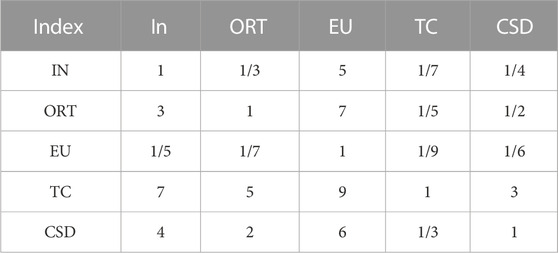
TABLE 2. Judgment matrix of production management mode in pump manufacturing enterprises.
With the help of SPSSAU18.0, weight set of the indexes can be calculated: W = [IN, ORT, EU, TC, CSD] = [0.08,0.16,0.03,0.51,0.22]. When CR < 0.1, the consistency of the judgment matrix is generally believed to be acceptable; otherwise, the judgment matrix is considered to have not met the requirements, thereby requiring rectification. In this paper, the maximum eigenvalue of judgment matrix λmax = 5.345, and the consistency index CI = 0.086. The random consistency index RI = 1.12, and the consistency ratio CR = 0.077 < 0.1. Thus, the result passes the consistency test of the judgment matrix.
A panel of experts judged each of the five evaluation factors in the three production organization models. The affiliation degrees of each indicator were obtained, as depicted in Table 3. The results of the weighting calculations for the three production organization models were calculated using SPSS 18.0 and are depicted in Table 4.

TABLE 3. Degree of membership.
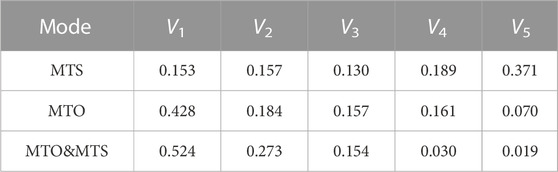
TABLE 4. Weight calculation results.
Finally, the final composite score was obtained according to the points corresponding to the rubric levels (V1 = 1, V2 = 0.8, V3 = 0.6, V4 = 0.4, V5 = 0.2), as depicted in Table 5. According to the table, the order of comprehensive scores is MTS<MTO<MTO & MTS. Therefore, the MTO & MTS mode is the best choice of production mode for pump.

TABLE 5. Scores of the evaluation factor sets.
The comparison reveals that the MTO model has the lowest inventory levels, but a higher number of stock-outs. This indicates an uneven production pattern and low production efficiency. Customer service requirements are often difficult to meet when demand is volatile. The optimized MTO & MTS combined order management model not only improves inventory, but also presents a better customer demand response to huge changes in demand and higher production utilization. Therefore, the MTO model is suitable for use when the pump company’s customer demand is relatively smooth and predictable. The combined MTO & MTS production organization model is used when customer demand is volatile and unpredictable. Under MTS order management mode, the inventory level and customer demand satisfaction level are in the middle, which can cope with certain demand disturbance, but the adaptability is poor in practical application. The combined MTO & MTS production organization model is a superior order management model as the pump market is sensitive to seasonal factors and natural climate change being taken into account. A fuzzy comprehensive evaluation of the three production organization models was found by combining expert references and practical application in enterprises. The combined MTO and MTS production management model is a better improvement on the MTO and MTS models. It effectively reduces the total cost of ownership, balancing reduced inventory management pressure with shorter order response times. In this way the total cost of doing business is reduced while meeting the needs of the customer, and pump manufacturers can have more funds to control pollutant emissions.
The original contributions presented in the study are included in the article/supplementary material, further inquiries can be directed to the corresponding author.
Conceptualization, JX; methodology, JX; software, YL; formal analysis, YL; investigation, JX; resources, JX; writing—original draft preparation, JX; writing—review and editing, JX; funding acquisition, JX. All authors have read and agreed to the published version of the manuscript.
This research was funded by the National Natural Science Foundation of China (51779215). This research was funded by the Jiangsu Provincial Social Science Foundation Project (19EYB020).
Author YL was employed by the company Ningbo Jushen Pumps Industry Co., Ltd.
The remaining author declares that the research was conducted in the absence of any commercial or financial relationships that could be construed as a potential conflict of interest.
All claims expressed in this article are solely those of the authors and do not necessarily represent those of their affiliated organizations, or those of the publisher, the editors and the reviewers. Any product that may be evaluated in this article, or claim that may be made by its manufacturer, is not guaranteed or endorsed by the publisher.
Alvarado, L. W., Quijada, J., and Lopez Ontiveros, M. (2020). Analysis of the dynamic behavior of efficiency at the bottleneck station of a water pump assembly line. Dyna (Medellin). 95 (4), 354. doi:10.6036/9753
Auberger, E., and Ramsauer, C. (2020). Integration of tactical aspects into strategic production network planning. Teh. Glas. 14 (3), 281–287. doi:10.31803/tg-20200718171824
Bi, M. (2018). Zhuzhou, China: Hunan University of Technology. MA. Dissertation, Research on supplier selection and eval-uation optimization of X Pump Company
Ji, L., Li, W., Shi, W., Tian, F., and Agarwal, R. (2021). Effect of blade thickness on rotating stall of mixed-flow pump using entropy generation analysis. Energy 236, 121381. doi:10.1016/j.energy.2021.121381
Li, L., Chen, R., and Li, Y. (2008). A revenue management model for MTO manufacturing. Industrial Eng. Manag. 13 (3), 26–28. doi:10.19495/j.cnki.1007-5429.2008.03.008
Liu, J. (2017). Shanghai, China: Shanghai Jiao Tong University. MA. Dissertation, Study on selection of pump company’s supplier based on AHP and fuzzy synthetic evaluation
Modrak, V., and Soltysova, Z. (2020). Batch size optimization of multi-stage flow lines in terms of mass customization. Int. J. Simul. Model. 19 (2), 219–230. doi:10.2507/IJSIMM19-2-511
Muszynski, T. (2019). Andrzejczyk, R., and Jakubowska, B., The impact of environmentally friendly refrigerants on heat pump efficiency. J. Power Technol. 99 (1), 40–48.
Salakhov, R., Ermakov, A., and Gabdulkhakova, E. (2020). Numerical and experimental study of the impeller of a liquid pump of a truck cooling system and the development of a new open-type impeller. Teh. Glas. 14 (2), 135–142. doi:10.31803/tg-20200309115417
Smith, S. B. (1984). The subassemblies problem: Make to stock or combine? J. Operations Manag. 5 (1), 1–17. doi:10.1016/0272-6963(84)90003-2
Sun, W. (2018). On lean management of equipment manufacturing industry. China Nonferrous Met. 35 (1), 189–193.
Wang, B., Liang, Y., and Yuan, M. (2019). Water transport system optimisation in oilfields: Environmental and economic benefits. J. Clean. Prod. 237, 117768. doi:10.1016/j.jclepro.2019.117768
Wang, C., Xu, J., and Shi, W. (2013). Market analysis of plastic impeller manufacturers based on the six-power interactive model. Energy Educ. Sci. Technol. Part B Soc. Educ. Study. 5 (4), 567–575.
Xi, B., Wang, C., Xi, W., Liu, Y., Wang, H., and Yang, Y. (2022). Experimental investigation on the water hammer characteristic of stalling fluid in eccentric casing-tubing annulus. Energy 2022, 124113. doi:10.1016/j.energy.2022.124113
Xu, Y. (2017). Multi-parameter optimizing the impellers in mixing-flow pump. J. Irrigation Drainage. 36 (5), 79–83. doi:10.13522/j.cnki.ggps.2017.05.014
Xu, Z. (2015). Guangzhou, China: South Chi-na University of Technology. MA Dissertation, Area logistic center’s system of optimization for G pump company
Ye, D., Li, H., Ma, Q., Han, Q., and Sun, X. (2019). Opti-mal design of vortex pump using approximate model and the non-dominated sorting genetic algorithm. J. Irrigation Drainage. 38 (7), 76–83. doi:10.13522/j.cnki.ggps.20190018
Zhang, T., Cheng, H., and Zhang, Y. (2008). A method based on MTO-MTS for the order planning of the steel plant. Syst. Engineering-Theory Pract. 28 (11), 85–93.
Zhang, Y. C., Shen, F. P., and Guo, N. (2012). Research on evaluation of supply chain quick response ability in enterprise cluster environment based on grounded theory—taking pump and valve industry in yongjia county, wenzhou as an example. Prod. Res. 26 (12), 211–213.
Zhu, X. (2017). Jiangsu, China,: Nanjing University. MA. Dissertation, Research on the procurement of multi-variety small batch castings of F Pump Company
Keywords: pump, optimization, make to order, make to stock, production model
Citation: Xu J and Lu Y (2023) Operation optimization study of water pump production model based on low-carbon economy concept. Front. Energy Res. 10:1097729. doi: 10.3389/fenrg.2022.1097729
Received: 14 November 2022; Accepted: 28 November 2022;
Published: 13 January 2023.
Edited by:
Leilei Ji, Jiangsu University, ChinaReviewed by:
Xiaojun Li, Zhejiang Sci-Tech University, ChinaCopyright © 2023 Xu and Lu. This is an open-access article distributed under the terms of the Creative Commons Attribution License (CC BY). The use, distribution or reproduction in other forums is permitted, provided the original author(s) and the copyright owner(s) are credited and that the original publication in this journal is cited, in accordance with accepted academic practice. No use, distribution or reproduction is permitted which does not comply with these terms.
*Correspondence: Yixuan Lu, eXhsdXl6dUBvdXRsb29rLmNvbQ==
Disclaimer: All claims expressed in this article are solely those of the authors and do not necessarily represent those of their affiliated organizations, or those of the publisher, the editors and the reviewers. Any product that may be evaluated in this article or claim that may be made by its manufacturer is not guaranteed or endorsed by the publisher.
Research integrity at Frontiers
Learn more about the work of our research integrity team to safeguard the quality of each article we publish.