 Shengwei Huang1
 Yumeng Zhang
95% of researchers rate our articles as excellent or good
Learn more about the work of our research integrity team to safeguard the quality of each article we publish.
Find out more
ORIGINAL RESEARCH article
Front. Energy Res. , 06 January 2023
Sec. Process and Energy Systems Engineering
Volume 10 - 2022 | https://doi.org/10.3389/fenrg.2022.1097325
This article is part of the Research Topic Muti-Energy Integration towards Energy Decarbonization View all 7 articles
This paper evaluates the thermo-economics of power-to-chemicals using solar energy, with the chemicals being methane, methanol, and gasoline. In addition to the optimal technology sizing and heat cascade utilization, this paper also considers the optimal molten-salt solar power tower (MSPT) design, as the MSPT significantly affects the levelized product cost. A bi-level optimization is proposed, employing mixed-integer linear programming at the lower level with heat and mass integration for optimizing sizes and operating strategies of technologies, and with heat cascade utilization and a genetic algorithm at the upper level for optimizing the MSPT design. In the upper level, the full-load storage hours, design direct normal irradiance, solar multiple, and sizes of the MSPT are optimized. The electricity sources considered are the MSPT, photovoltaic (PV) with daily electricity storage, and the electrical grid as a complementary technology to satisfy the targeted daily product demand. Cost-competitiveness of solar-driven chemical synthesis is thoroughly assessed via considering sensitivity analysis on 1) regional solar resource endowments and actual local demands; 2) electricity sources, that is, PV vs. MSPT; and 3) the scale effect represented by different chemicals’ yield. The results show that the levelized methane cost ranges from 4.5 to 8.5 €/kg, depending on the location, plant size, and annual power contribution of concentrated solar power. Due to the larger mass production, the levelized cost of methanol and gasoline is lower: 1.5–2.2 €/kg for methanol and 4–6 €/kg for gasoline. The findings highlight the significance of location choice, that is, natural endowment of solar radiation and carbon sources. Using the syngas co-electrolysis pathway and direct solar radiation 100 kWh/m2 higher, the methane production cost is decreased by 2.4 €/kg. Sensitivity analysis performed on plant scale reveals that a compact, small-scale system is far too expensive. The levelized cost of methane could be decreased by 1.2 €/kg when the plant is scaled up from 4,000 to 20,000 kg/day H2. Due to its expensive electricity storage and limited working hours, PV is typically not chosen as a power source. Overall, solar fuels are unlikely to be cost-competitive in the near future when compared to market prices for all three compounds under consideration.
The scientifically sound energy transition suggests the selection of a technological pathway based on regional resource endowments and actual local demands (Lu, 2015) that is capable of ensuring a sustainable development of the regional economy (Sun et al., 2016). Under this basic idea, the use of local renewable energy sources, especially wind and solar, is of particular interest. However, the temporal and spatial fluctuations of renewable energy sources make the energy storage essential for a high-quality, safe, and realizable power supply (Ma et al., 2021). The power-to-X (PtX) concepts can be utilized to overcome energy storage issues related to renewable energy via directly converting renewable electricity into storable fuels or highly valuable chemicals via electrolysis. Particularly, power-to-gas (PtG) and power-to-liquid (PtL) technologies (Wang et al., 2019) have a clear advantage over pumped-storage hydropower stations in terms of less environmental impact and redox flow batteries in terms of higher technology readiness level (Venkataraman et al., 2019).
The main study directions of PtX technologies during the last decade can be broadly divided into techno-economic analysis (Dahiru et al., 2022) and environmental impact assessments (Choe et al., 2021). Focusing on techno-economic analysis, the synthesis pathway selection (Wang et al., 2019), operating strategies, and system configurations (Bianchi and Bosio, 2021) are crucial in deciding the overall plant efficiency, reliability, and the cost-effectiveness of the systems. For instance, a variety of PtX pathways, with x being hydrogen, syngas, methane, methanol, and ammonia, were compared in terms of thermodynamic performance by Wang et al. (2019), highlighting the advantage of the syngas process with efficiency up to 80% (0.7 A/m2) because the electrical heating for steam generation can be significantly reduced by the heat released from the synthesis reactions. Zhang et al. (2021) further analyzed the economic feasibility of employing reversible solid oxide cell stack for addressing wind power fluctuation and pointed out that coupling four stacks with different thermodynamic performances, that is, different current densities and efficiencies, is able to enhance the cost-effectiveness. For producing sustainable chemicals, H2 and CO (mixture of which is called syngas) are the most commonly used primary chemicals, which can be derived via water and CO2 electrolysis (Garlyyev et al., 2020). A low-temperature (20–70°C) proton exchange membrane electrolyzer and high-temperature (600–850°C) solid oxide oxygen ion exchange membrane electrolyzer (SOE) are two widely discussed technologies (Baldi et al., 2019). Particularly, high-temperature electrolysis-based systems are expected to achieve high efficiencies, compared with those using low-temperature electrolysis due to its significantly reduced electrical demand which, in turn, leads to higher economic potentials of such technology (Habibollahzade et al., 2019).
For the operation of SOE-based PtG or PtL systems, the supply of renewable power and intermediate-/high-grade heat is essential (Wang et al., 2019). Different concepts of coupling SOE with various energy sources, such as geothermal, and renewable heat and power have been analyzed and discussed in the past (Carbone et al., 2021; Zhang et al., 2021). Among these renewable sources, solar energy is one of the ideal renewable sources for SOE-based fuel generation systems as both the electrical and heat demands can be fulfilled via various solar conversion technologies (Lin et al., 2022). Concentrated solar power (CSP) technologies are the most relevant pathways as heat and electricity can be simultaneously supplied via CSP systems (Sanz-Bermejo et al., 2014). In addition, coupling with thermal storage, CSP-driven SOE systems can potentially achieve continuous operation, which is unique for SOE-based PtG/PtL (Monnerie et al., 2017). CSP technologies mainly include solar tower technologies (>500°C) with molten salt, steam, or air as heat transfer fluid, parabolic trough technology (<420°C), and Fresnel technology. Among these, the molten-salt solar tower power plant (MSPT) offers the largest storage capacity, which can potentially drive PtG/PtL systems operating continuously, thereby reducing the specific cost of the final product (Houaijia et al., 2015).
For solar-driven PtX to succeed in a highly competitive chemical market, cost-competitiveness with conventional sources of non-renewable energy (fossil fuel, nuclear) is the decisive factor. At present, evaluation of the hydrogen from concentrated solar power via SOE-based electrolysis is up to 9 $/kg (Zhong et al., 2022). It is much higher than hydrogen from natural gas, which is 0.5–1.7 $/kg. According to a cost analysis of the solar-driven PtX processes, the MSPT plant contributes 50% of the overall cost of chemical production (Joubi et al., 2022). In the optimization of the MSPT plant, for example, the plant configuration and prototype collector designs (Abu-Hamdeh and Alnefaie, 2016) should be carried out in applications for cost reduction. However, in thermo-economic analyses of solar-driven power-to-chemical systems, the optimal size of the MSPT plant is often scaled from a given plant configuration with predetermined heliostat, receiver, and thermal storage unit sizes. There is still a lack of study on optimal matching of the MSPT plant design with the PtG and PtL processes, which could leave room for chemical synthesis cost reduction.
Moreover, the solar-driven PtX technologies suffer from uncertainty about the natural resource endowment of solar radiation as well as the CO2 sources. For example, methane synthesis with CO2 taken from biogas is able to produce 3 €/kg lower than the scenarios with CO2 directly captured from air. Therefore, methane synthesis is in focus in the EU as a carbon source as there are favorable biogas policies (Peters et al., 2019). Further research on the impacts of scale, different solar power technologies, and endowments of natural resources on the techno-economics of solar-driven electrolytic hydrogen production is required.
Accordingly, thermo-economic evaluation of solar-driven SOE-based power-to-methane, methanol, and gasoline processes is carried out in this paper in a comprehensive manner, via considering 1) different regional solar resource endowments; 2) different electricity sources, that is, PV vs. MSPT; and 3) the scale effect represented by different chemicals’ yield (4,000 or 20,000 kg/day H2). Both steam electrolysis and co-electrolysis of steam and CO2 are considered for SOE operation. The optimal design of solar-driven PtG/PtL plants is performed with respect to two objective functions: minimizing the levelized product cost (LCO) and maximizing the share of MSPT power in total power consumption. Based on a review of pertinent research about the thermo-economic evaluation of solar-driven power-to-chemical systems, the main contributions of this study are mainly focused on the following two aspects:
• A bi-level optimization method is proposed to couple optimization of MSPT plant design, optimal sizes and operating strategies of system components, and heat cascade use. Such approaches may save chemical synthesis costs by optimally matching the design of a MSPT plant with specified applications.
• The thermo-economic effects of solar-driven SOE-based PtX processes are thoroughly assessed via taking various chemical yields, solar power systems, and endowments of solar radiation into account.
This paper is organized as follows: in Section 2, the concept and simulation of solar-driven SOE-based power-to-chemical systems are first introduced. In Section 3, the bi-level optimization method for optimal system configuration and MSPT design is illustrated. Case studies are carried out to verify the optimization method with case specification and results shown in Section 4 and Section 5, respectively. The investigation is concluded in Section 6.
There are two ways of combing the SOE with fuel synthesis: 1) the SOE running with steam electrolysis produces hydrogen, which could react with CO2 for synthesizing fuels; 2) the SOE running with co-electrolysis of CO2 and H2O produces syngas, which can be further converted to fuels, as shown in Figure 1. Integrating with intermittent solar energy, the SOE-based power-to-chemical systems should use sufficient electricity and thermal storage and possibly gas storage for continuous operation. When there is enough solar radiation, the power generated by PV and/or MSPT will directly power the SOE subsystem and simultaneously charge the electrical and thermal storage. When the solar irradiation is insufficient, the SOE subsystem will make use of the electricity both stored and generated by the thermal storage. In comparison to electricity storage, intermediate hydrogen storage for steam electrolysis or syngas storage for co-electrolysis may be preferable. Therefore, by choosing a particular SOE mode and effectively sizing and running various subsystems and storage, there should be a minimum levelized cost of fuels produced, depending on the local conditions of solar irradiation and the technology specifications.
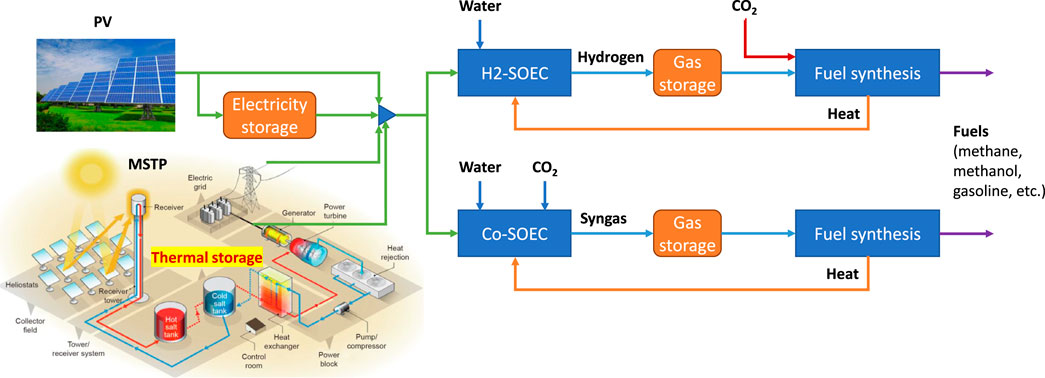
FIGURE 1. Integration of the SOE with renewable power and the downstream chemical synthesis process with the SOE operating at the steam electrolysis (H2-SOE) or co-electrolysis (Co-SOE) mode.
The SOE can be operated in endothermic, thermo-neutral, or endothermic modes, depending on its operating point, which also affects the system-level heat integration, particularly, its integration with the downstream chemical synthesis subprocesses. The building and validation of the SOE model and the synergy between the SOE and the chemical synthesis have been provided in a series of publications from the authors (Wang et al., 2019). Coupling of the complete PtX process with solar energy will be further discussed in this paper. Simulations of methane, methanol, and gasoline synthesis processes are carried out in Aspen Plus. A detailed description of the chemical processes is given in the Supplementary Material.
In this paper, two objective functions are employed in the thermo-economic evaluation and optimization: maximization of the annual power contribution of MSPT and minimization of the levelized product cost. The aim is to find the trade-off between the two objectives, since, in general, increasing the annual share of MSPT power tends to increase MSPT capacity, leading to a larger levelized product cost.
A bi-level optimization method is proposed in this paper for coupling optimal design of the molten-salt solar power tower plant (lower level) and optimal configuration of system components and utilities (upper level). The overall bi-level optimization method is illustrated in Figure 2, with the optimization in upper level for MSPT plant design extended in Figure 3.
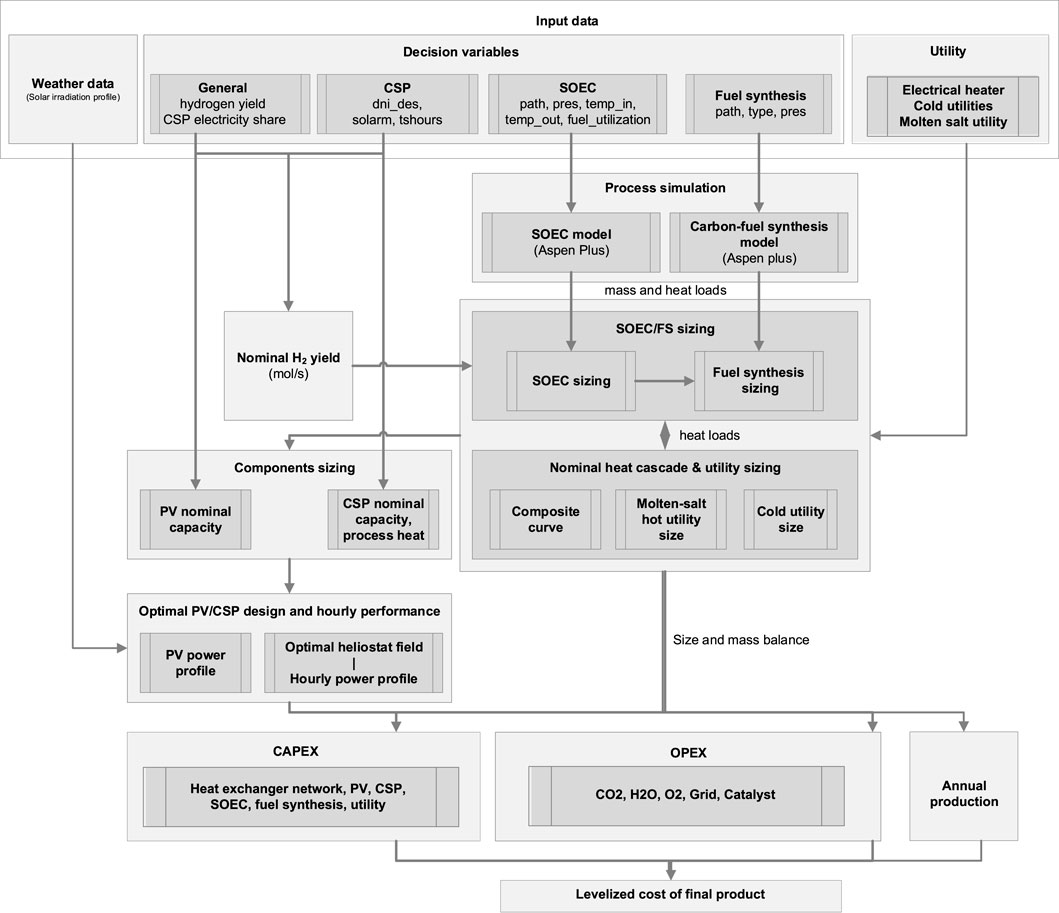
FIGURE 2. Bi-level optimization method and economic evaluation.
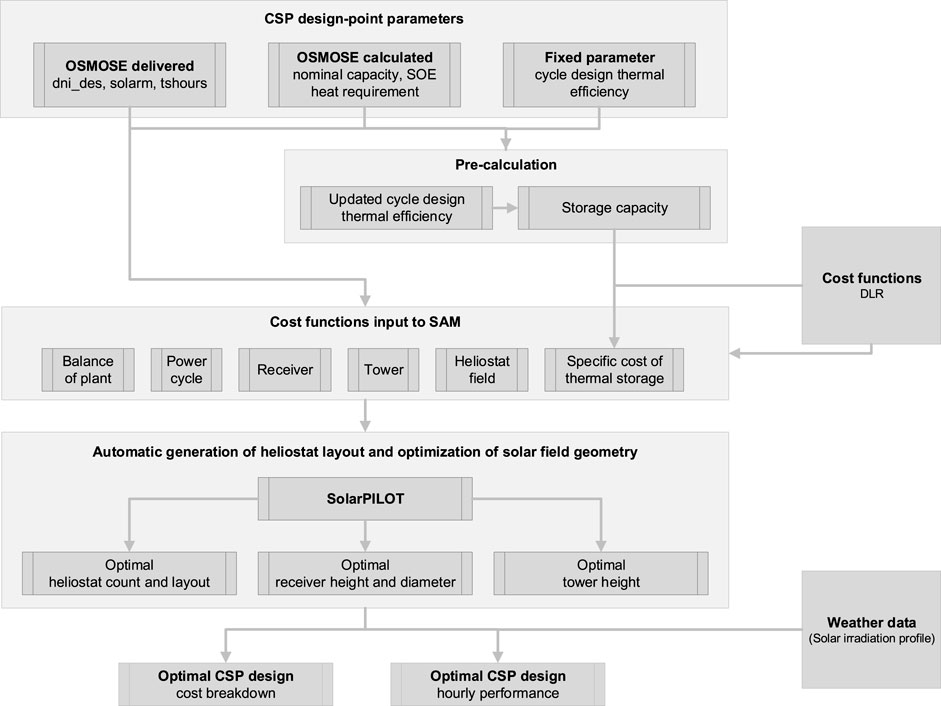
FIGURE 3. MSPT optimization and evaluation of hourly performance of the derived optimal plant design.
The LCO calculation procedure illustrated in Figure 2 is employed. The LCO of chemicals is determined in Eq. 1, which requires the knowledge of the capital cost of main components (CAPEXs, €) and the annual operating cost (OPEX, €/year) for the considered plant and the production of the product per year expressed in kg for hydrogen Pr. τ is the discount rate and is set at 8%, and the economic lifetime t of the project is set at 20 years.
The components involved in CAPEX calculation are MSPT, PV plant, SOE, heat exchanger network, electrical heaters, compressor/pump, and pressure vessel (reactor/flash drum/column) in chemical synthesis. More specifically, evaluation of the MSPT capital cost involves heliostat field, tower, receiver, power block, balance of plant, thermal storage, and indirect capital cost considering land cost, EPC and owner cost, construction cost, and tax. The CAPEX for the high-temperature electrolyzer is based on data representative for 2025 provided by CEA. It includes stacks, piping, enclosure, and DC converter. The OPEX is contributed by each separate piece of equipment, as well as the resource use and waste/pollutant mission of the whole system. For most equipment, the fixed OPEX per year is treated to be simply proportional to its total capital cost. Detailed methods and specified economic parameters to calculate the CAPEX and OPEX are given in the Supplementary Material.
The minimum LCO under different power contribution of MSPT is achieved via optimizing 1) the CSP plant, including MSPT full-load storage hours, MSPT design DNI, MSPT solar multiple, and the oversizing factor; 2) sizes and hourly operating strategies of components (SOE, CSP, PV, and the thermal, chemical, and electricity storage units); 3) heat cascade utilization to calculate the minimal process heat required. Energy balance and mass balance should be satisfied in the optimization. Optimization of those decision variables is obtained by mixed-integer linear programming with the objective of minimum LCO of chemical production. The decision variables are given in Table 1. Moreover, optimization of MSPT is carried out by a genetic algorithm in upper-level optimization as shown in Figure 3, which will be explained in the next section.
The input technical data for the calculation include SOE nominal operating point (steam electrolysis/co-electrolysis, operating pressure, cell inlet and outlet temperatures, and fuel utilization), fuel synthesis design (product type, system type, and operating pressure), and the utility and weather information. The operating conditions of the SOE are unchanged for all solution evaluations at thermo-neutral operation. Technical specifications of major components SOE and MSPT are listed in Table 2. Technical specifications of the chemical synthesis processes are provided in the Supplementary Material.
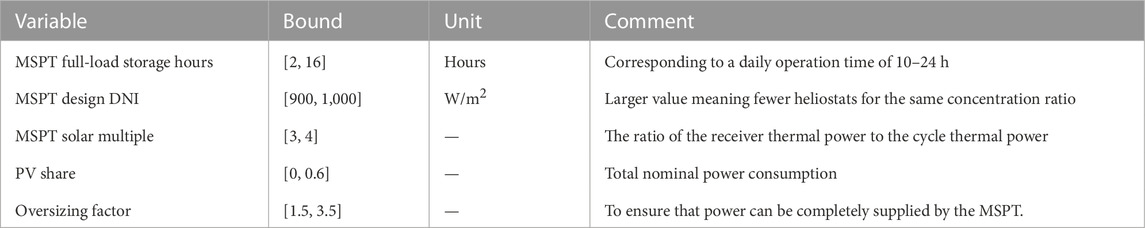
TABLE 1. Decision variables for the bi-objective optimization problem.
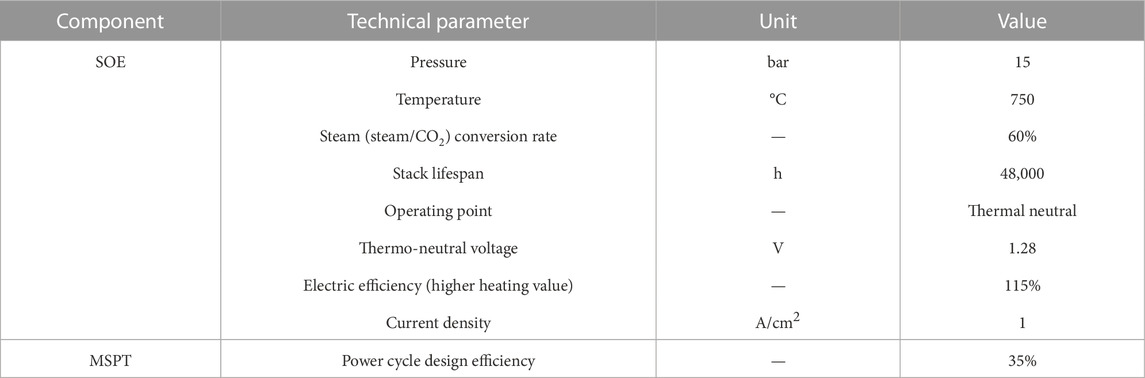
TABLE 2. Specifications of technical parameters in optimization.
The input data for the calculation include general system specifications (hydrogen daily production rate and share of MSPT nominal power of the total nominal power), MSPT design variables (design DNI, solar multiple, and full-load hours of storage), SOE nominal operating point (steam electrolysis/co-electrolysis, operating pressure, cell inlet and outlet temperatures, and fuel utilization), fuel synthesis design (product type, system, type and operating pressure), and the utility and weather information. The nominal hydrogen molar production rate per second (mol/s) is first calculated as follows:
where
When employing the solid oxide electrolyzer (SOE), one difficulty of the system design is to meet the heat demand for water vaporization. The amount of electrical heating and process heat is minimized by a heat cascade calculation, where the electrical heating and the process heat are considered as hot utilities with certain limitations. For example, when a MSPT is involved as an electricity supplier, a molten-salt hot utility with an inlet/outlet temperature of 574/290°C is added to the heat cascade calculation. Once the heat cascade problem is solved, the nominal electricity capacity
so that the input energy of Rankine cycle is properly scaled to provide both the nominal electricity and process heat. The thermal storage, tower, and heliostat field are then automatically sized and optimized by the SAM. Particularly, this trick does not affect the cost of the power cycle, as the nominal power output of the Rankine cycle does not change. It should be noted that the cost of heat exchangers related to the molten-salt hot utility is not included in the cost of the solar power tower plant but is separately calculated via an effective heat exchanger network estimation.
For calculating the CAPEX, the reasonable estimation of the MSPT part (given in Section 3.2) is of great importance. This is because when the plant size varies, the specific cost of key components, the heliostat field, tower, storage, and power cycle varies as well. Thus, before optimizing the heliostat field, the specific cost or the cost function is first calculated or adapted depending on the plant size. Then, the heliostat field is optimized to minimize the cost of the whole solar power tower plant. The details of the CAPEX calculation of all involved subsystems are given in the Supplementary Material with the formulations of calculating the levelized product cost.
For calculating the CAPEX, the reasonable estimation of the MSPT part (given in Section 3.2) is of great importance. This is because when the plant size varies, the specific cost of key components, the heliostat field, tower, storage, and power cycle varies as well. MSPT plant design parameters should be in certain ranges as listed in and will be tuned by a genetic algorithm for each evaluation.
The System Advisor Model (SAM) developed by the National Renewable Energy Laboratory is integrated into our calculation platform. The SAM offers fast and precise simulation of renewable power generation, for example, (concentrated) PV, various concentrated solar thermal power (tower/trough/dish/linear Fresnel), and wind and geothermal power. Particularly, for the solar tower technology, the functionality of SolarPILOT in the SAM allows generating the heliostat field layouts, characterizing the optical performance of the solar field using an analytical technique derived from the Hermite polynomial approach used in DELSOL3, and more importantly, optimizing the heliostat field in terms of the capital cost. Heliostat field optimization is critical for thermo-economic evaluation and optimization of PtG/PtL technologies, since the heliostat field is typically the most cost-intensive component.
The detailed optimization procedure for the MSPT design presented in Figure 2 is further elaborated in Figure 3. For each design of the whole system, the nominal capacity and heat requirement of the SOE subsystem are obtained by simultaneous utility sizing and heat cascade calculation in OSMOSE (an analysis and optimization tool developed in the Group of Industrial Process and Energy Systems Engineering of Swiss Federal University of Technology in Lausanne). Then, given the design DNI, solar multiple, full-load storage hours, and the cycle design thermal efficiency, the capacity of thermal storage is determined together with an updated cycle design thermal efficiency by considering the process heat supply for the SOE subsystem. Then, for the given plant capacity, the cost data are updated and put into the SAM platform, based on cost functions provided by DLR (Dieckmann et al., 2016) for each involved component. Afterward, with respect to the reduction in the total cost, automatic generation of the heliostat layout and optimization of the solar field geometry is performed by SolarPILOT to obtain the optimal heliostat number and layout, receiver height and diameter, and tower height. Eventually, the cost breakdown and hourly performance of the optimal MSPT design can be obtained. The employed cost functions predicted for 2025 by DLR are summarized in Dieckmann et al. (2016).
The definition of case studies (Table 3) is selected based on the location, capacity, operating time, pathway, and end product. The European regions with a DNI value above 1800–1900 kWh/m2 are identified. The preferred regions for the operation of the MSPT are southeast of France, Italy (west and south coast, Sardinia, and Sicily), Spain (except north), Portugal, Greece, Malta, and Cyprus. However, considering the economics, energy contexts, and market opportunities in the various countries for value-added products, only Spain, Italy, and France are selected. The location selection is further constrained by the amount of rejected CO2 for the co-electrolysis pathway or hydrocarbon production (oil refinery (Spain), glass industry (Italy), iron and steel industry (France), and the consumers of the added value product (O2 consumer). The final products (methane, methanol, gasoline, etc.) are also identified for different locations selected in terms of flow rate, purity, and pressure. The grid electricity consumed was evaluated using the average electricity spot price and taxes for industries.
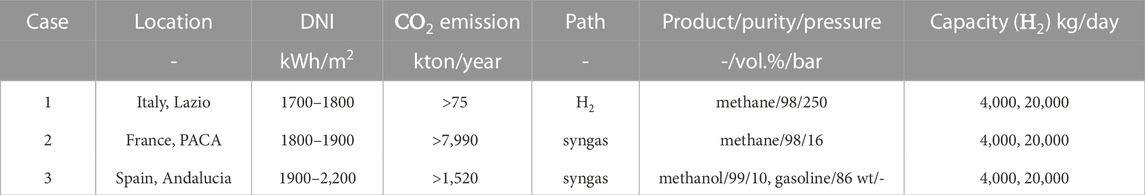
Table 3. Overview of the defined case studies.
In Italy, methane for mobility is promising due to the widespread use of compressed natural gas (35% of the transport consumption in Europe contributed by Italy). In total, the country counts 880,000 vehicles powered by natural gas on roads, and around 80% of Europe’s entire car fleet is on gas. Around 1,060 stations with 1,010 public are available for natural gas refueling. The regions with high DNI are Sardinia and Sicily (above 1900 kWh/m2), south coasts of Calabria and Puglia (1800–1900 kWh/m2), and the west coast of Lazio (close to 1700–1800 kWh/m2). However, as the targeted application is methane for mobility, injection into the gas grid for the methane transportation and distribution to various fueling stations is required; thus, the islands Sicily and Sardinia, with a high potential for MSPT, are excluded. Considering the CO2 supply potential by a hub of industries (over 50 kton/year), the Lazio region is chosen for this case study. The emission of CO2 is mainly from the glass industry, whose oxygen supply is usually with a purity of 90–99.5%. The methane pressure for mobility is 200–250 bar.
In France, Fos-sur-Mer (PACA region) is selected due to high DNI of around 1800–1900 kWh/m2 and a hub of carbon-emitting industries. The region has become the largest CO2 emitter (over 50 kton/year) ahead of Nord Pas de Calais and Lorraine regions. The company highlighted is world-leading steel and iron company, ArcelorMittal, located in Fos-sur-Mer (PACA), which emits around 7,990 kton/year. Approximately, 60–100 Nm3 of O2 per ton of steel is necessary with a purity between 90% and 99.5% (depending on the relevant manufacturing steps). The quality of methane produced for grid injection is defined by the French standards of a higher heating value, Wobbe index, and purity level. The methane pressure varies between 4 and 16 bar for the distribution grid and 40–70 bar for the national grid.
Methanol or gasoline (via methanol-to-gasoline process) is a promising value-added product for mobility in Spain. Oil industries utilize methanol directly to blend gasoline or to produce methyl tertbutyl ether, the most widely used octane booster for reformulated gasoline. Except for northern regions such as Galicia, Asturias, Cantabria, Basque country, Navarra, and the coast of Catalonia, the minimum required rate of 1900 kWh/m2 for CSP is reached in Spain. Considering the large-scale carbon-emitting oil-refining company, Compañía Española de Petróleos, S.A., emitting around 1,520 kt/year CO2, Andalucia is chosen for this case study. The choice of a refinery can establish a circular economy for this oil industry: CO2 emitted by the refinery is used to produce methanol or gasoline, which can be used, in turn, by the refinery. According to fuel blending regulations in Europe, the maximum allowed methanol volume is 3%vol./vol. of gasoline and 10%vol./vol. of diesel. Methanol used should have a minimum purity of 99.7%wt (and water content <0.1%wt). If used in methyl tertbutyl ether synthesis, methanol should have a minimum purity of 99% and may require to be compressed to 10–15 bar (operating conditions of MTBE synthesis). Gasoline yield produced by the methanol-to-gasoline process is high, and usually, gasoline purity (around 86%wt.) meets or exceeds existing gasoline specifications.
Key information provided from the thermo-economic optimization is the trade-off between the annual power contribution of CSP and the levelized product cost. The cost breakdown and the key variables leading to such trade-off are discussed.
The trade-off between the annual power contribution of CSP and LCO of methane for cases 1 and 2 is illustrated in Figure 4. Each scattered line stands for the minimum levelized cost of methane for a given annual power contribution of CSP. The area above each scattered line is the feasible design region for each specific case study. Overall, the trade-off tends to be in a linear trend, indicating that improving the annual power share of CSP will not significantly increase the levelized methane cost. For case 1 (Italy, methane for mobility), the levelized methane cost increases from 7 €/kg with 70% CSP power contribution to 9 €/kg with approximately 100% CSP power contribution.
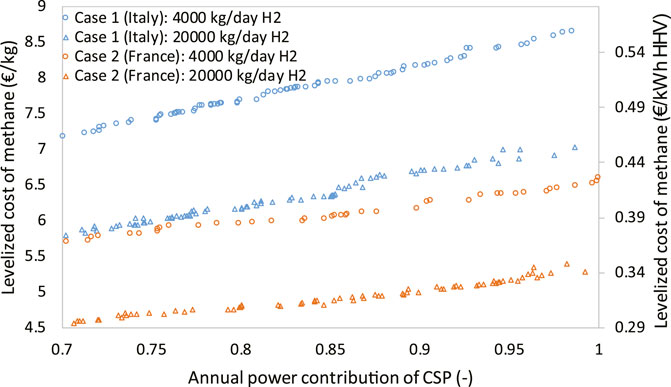
FIGURE 4. Trade-off between the annual power contribution of CSP and LCO of methane.
The plant size has a significant impact on the levelized methane cost. For case 1, the levelized methane cost at 4,000 and 20,000 kg/day H2 are 7.2–8.7 and 5.7–6.7 €/kg, respectively. For case 2, the values are 4.5–5.3 and 5.8–6.4 €/kg. By increasing the plant size from 4,000 to 20,000 kg/day H2, the levelized cost significantly drops by around 1.2 €/kg under the same CSP power contribution in both cases 1 and 2.
Moreover, the levelized methane cost is highly dependent on the location, that is, natural resource endowment of solar radiation. For a location with a larger annual capacity factor, the MSPT size can be smaller for a specified application. This can be revealed by Figure 5: for case 2, by the syngas pathway, with the same amount of hydrogen produced, the total power consumption, in fact, should be significantly higher than that of case 1. However, the fact that the CSP annual capacity factor (Figure 5A) in the PACA region (France) is much larger than that in the chosen location in Italy leads to a significant difference in the MSPT capacity, as illustrated in Figure 5B. As a result, compared with case 1, case 2 with a smaller MSPT size and MSPT CAPEX produced a larger amount of methane, leading to a significantly lower levelized methane cost.
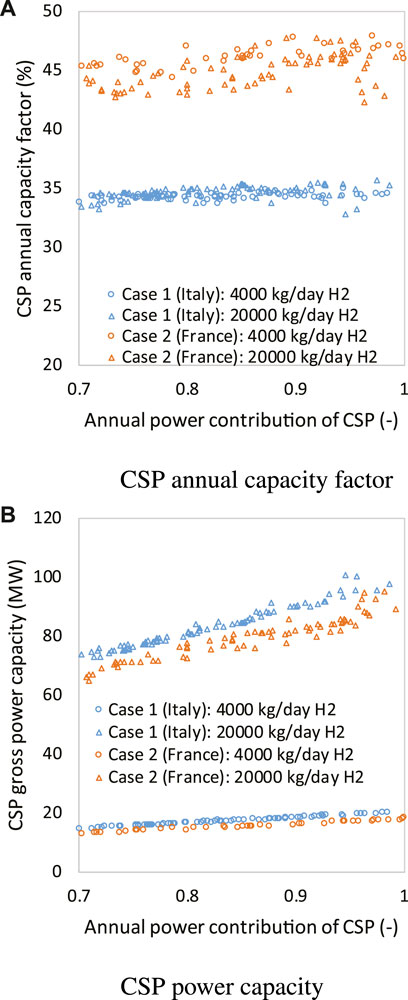
FIGURE 5. Influence of location on the annual capacity factor of CSP, with CSP annual power factor shown in (A) and CSP gross power capacity shown in (B).
The gap between the daily product from MSPT/PV and the daily demand is illustrated in (Figures 6A,B) for case 1 (a) and case 2 (b). Seasonal product storage is always necessary due to the excess product in summer time. It should be noted that the time and magnitude of the grid use have not been optimized, which, to some extent, may affect the operating cost and the seasonal storage capacity. However, since the constant grid price is employed in this analysis, the arbitrary decision on using grid power will have no impact on the operating cost but only a small influence on the product storage capacity. In addition, when increasing the annual contribution of CSP by further enlarging the MSPT plant, the capacity of seasonal storage becomes much larger, as illustrated in Figures 6C, D. The comparison between Figures 6C, D also shows that the seasonal storage capacity does not increase with the better solar irradiation profile, which is due to the facts that 1) the MSPT size of case 2 is smaller, and 2) the solar profile in France is more even all over the year.
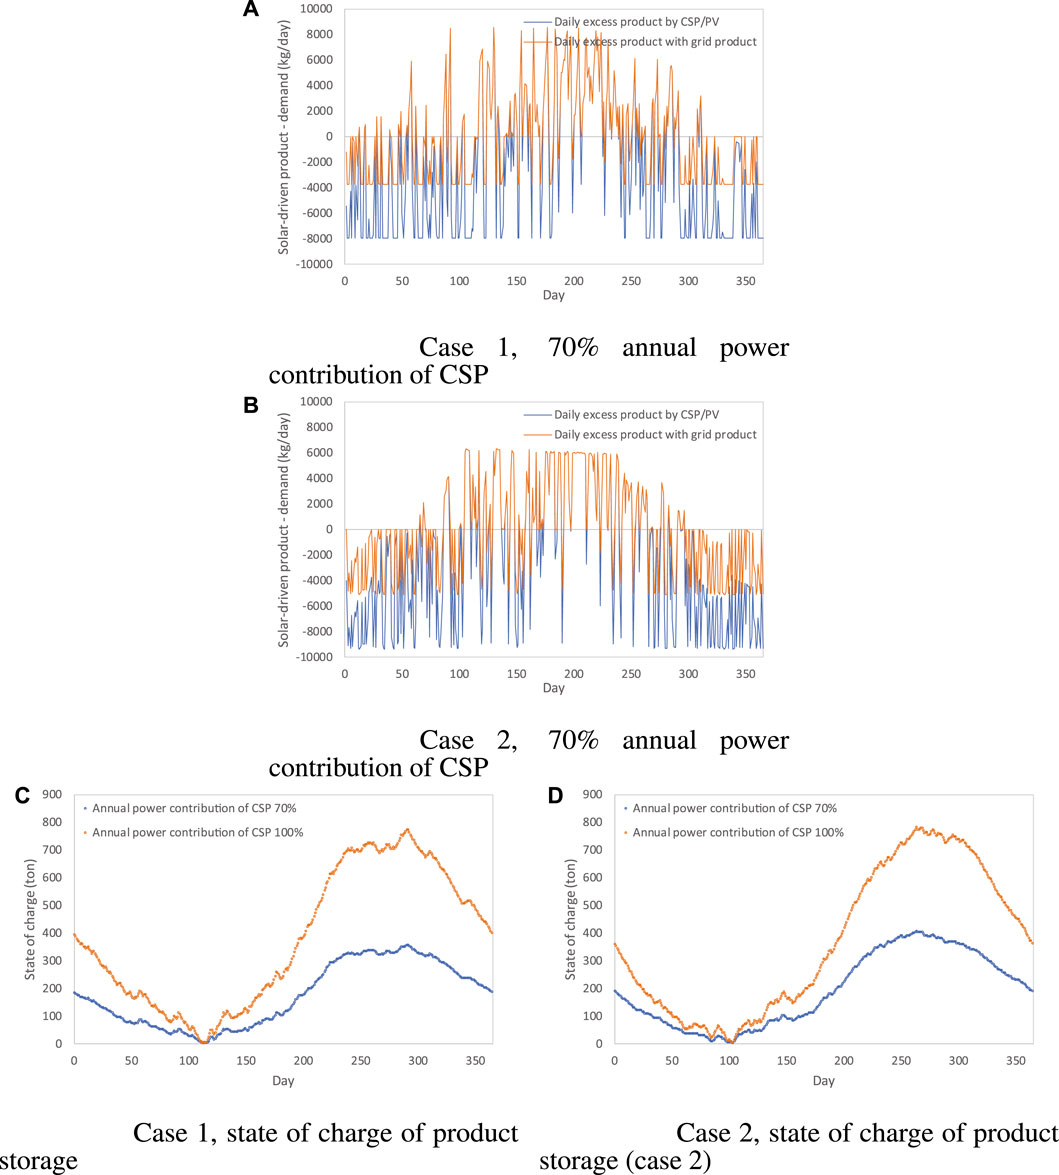
FIGURE 6. Daily gap between production from MSPT/PV and demand and state of charge of product storage (4,000 kg/day H2 cases). The hourly solar driven product-demand in case 1 and case 2 when CSP contributing 70% power are shown respectively in (A) and (B). The state of charge of product storage in case 1 and case 2 are shown respectively in (C, D).
The thermo-economic optimization can provide a possible cluster (range) of decision-variable values of a set of sub-optimal solutions. Thus, instead of providing a single optimal daily full-load operating hour for a specific solution, a range of optimal daily operating hour (8 daytime hours + full-load storage hours) is provided. Apparently, large thermal storage capacity for long daily operating hours is generally preferred. For case 1, the plant with a size of 20,000 kg/day H2 prefers 23–24 daily operating hours, while the plant with a size of 4,000 kg/day H2 tends to have slightly shorter operating time of 21.5–23.5 h. For both sizes of case 2, the optimal operating time lies in the range of 22–23.5 h. The MSPT hourly operation is rather the same for all solutions at the same location but only the thermal and electrical power scales are different for different MSPT sizes. France (PACA region) is a much better choice from the solar radiation viewpoint. The daily MSPT operating hours in France (PACA region) are much longer than those in the Roma area all over the year, which offers, for case 2, a higher annual capacity factor of CSP and thus a lower levelized methane cost.
It has been found that, for all the optimal solutions in Figure 4, the PV capacity share is much lower than the MSPT power capacity, as illustrated in Figure 7: for case 1, the share of PV capacity is below 6% and when the use of CSP is expected to be increased, the PV capacity share reduces gradually to 0. The same trend is observed for case 2; however, since for case 2, the annual capacity factor of PV is much higher, larger PV capacity can be allowed when the annual power contribution of CSP is lower than 80%, even reaching as high as 17% for 70% annual power contribution of CSP. Since MSPT generally operates much longer than PV by employing large-scale and cost-effective thermal storage, the annual contribution of PV is much lower than its capacity share. Particularly, for the solutions with large PV capacity share of over 6%, the annual power share of PV is only 4–6%. Thus, it can be simply concluded that PV generally is not preferred as the electricity supplier for power-to-fuel energy storage. This is mainly due to the following two reasons:
• Without electricity storage, the annual capacity factor of PV is rather small compared with that of MSPT with thermal storage. To satisfy the daily demand of methane, the PV system must be largely oversized, which makes the combination of PV and electrolysis not economically beneficial.
• With electricity storage, the oversizing factor of PV can be small; however, the electricity storage is far too expensive and generally not feasible for large-scale applications.
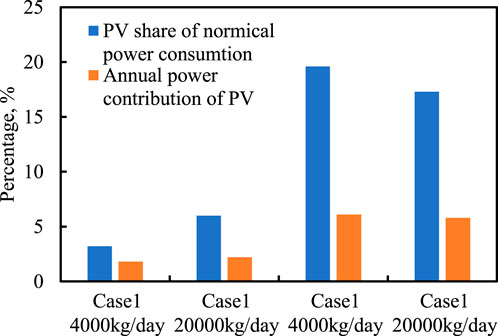
FIGURE 7. Share of PV capacity in the total nominal power consumption and annual power contribution of PV.
The contribution of the CAPEX on the total methane production cost in all cases is shown in Figure 8A), which is within the range of 76–86% and is increased accordingly as improving the annual power share of CSP, since 1) the grid electricity use is decreasing, thus leading to a smaller OPEX, and 2) the MSPT plant, whose electricity production is more expensive than the grid, must be further oversized. Particularly, for the same location, the smaller the plant size, the larger the CAPEX contribution will be, as the specific capital cost of all involved components increases with decreased size. The CAPEX breakdown is similar among optimal solutions identified for all cases, and is illustrated in Figure 8B. The MSPT dominates the total CAPEX with a contribution of around 75%, followed by the electrolyzer subsystem contribution and the heat exchanger network, with each contributing around 10%. Pumps, fans, and compressors (CONN) make up the remaining 5%. Although large seasonal storage of products is needed when increasing the CSP annual power contribution close to 100%, the cost of methane storage (PDST) can still be neglected, due to the low specific cost of methane storage. Contributions from MSPT make up the majority of operating expenses, accounting for 45% of OPEX when CSP annual power contribution is 70%, and 75% when it is 100%. The other two sources for OPEX are water and CO2 use, accounting each for almost 10% of the OPEX, respectively.
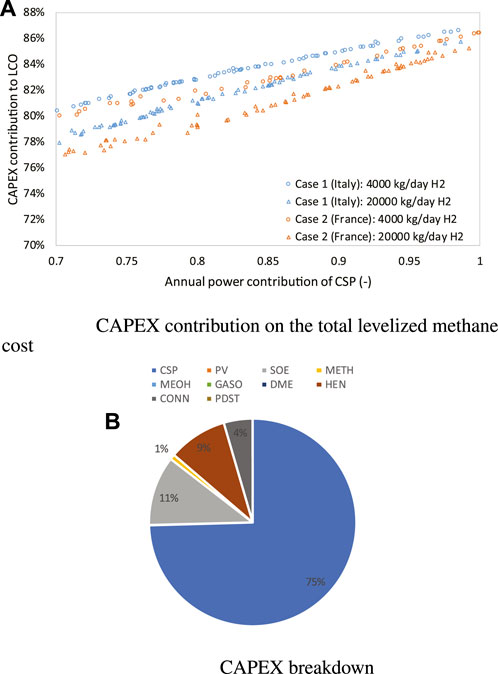
FIGURE 8. CAPEX contribution on the total methane production cost in case 1 and 2 (A) and the CAPEX breakdown (B). HEN, CONN, and PDST refer to heat exchangers, CONN-pumps/compressors, and PDST product storage, respectively.
Figure 9 illustrates the changes in MSPT cost breakdown at various annual power contributions of CSP. Only the results of case 1 are displayed because the results of cases 1 and 2 are similar. The MSPT cost breakdown is generally distributed as the heliostat field (25–37%) > power block (17–19%) > receiver (13–20%) > thermal storage (10–15%) > tower and site improvement cost.
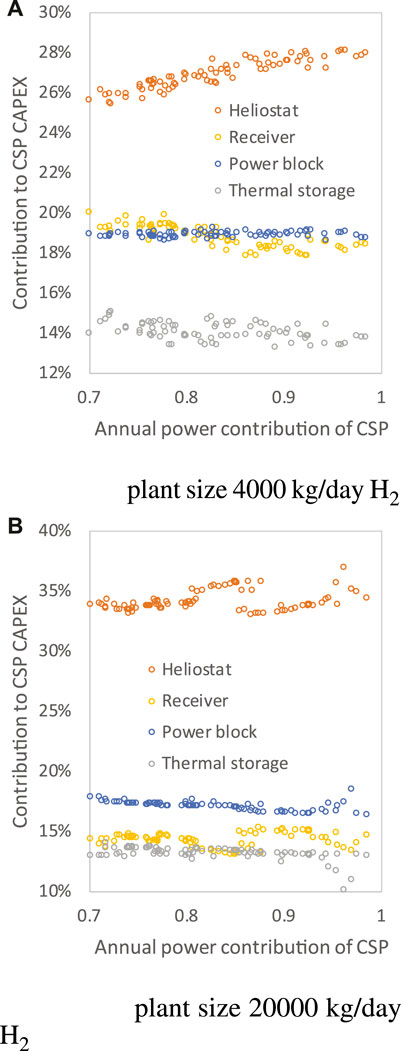
FIGURE 9. MSPT cost breakdown of case 1 under different annual power contributions of CSP at plant size 4,000 kg/day H2 (A) and 20,000 kg/day H2 (B).
By increasing the CSP power contribution, the major variations of cost contributors come from the heliostat and the receiver. When the MSPT size is larger, the contribution of the heliostat field to the capital cost tends to be larger. This is basically why the heliostat contribution for 20,000 kg/day H2 cases reaches 37% (Figure 9B), much larger than those of 4,000 kg/day H2 cases (Figure 9A), while the contribution of the receiver decreases to 15% for the 20,000 kg/day cases.
The trade-off between annual power contribution of CSP and the levelized cost of methanol and gasoline is shown in Figure 10. Overall, the effect of CSP annual power contribution on the levelized methanol cost is much weaker than that on the levelized gasoline cost. In general, the levelized methanol cost is within the range of 1.5–2 €/kg, while for gasoline, the levelized cost is around 4–6 €/kg. This is because methanol is produced in larger amounts than gasoline using the same amount of H2 for the synthesis (simply because of the molecule formulation). In order to produce gasoline, methanol is first dehydrated to create DME, and then DME should be transformed into gasoline, which ultimately results in the considerable difference in mass production. The yield of the chemical influences the variation of the levelized cost under different annual power contribution, that is, the slope of the levelized cost with regard to annual power contribution.
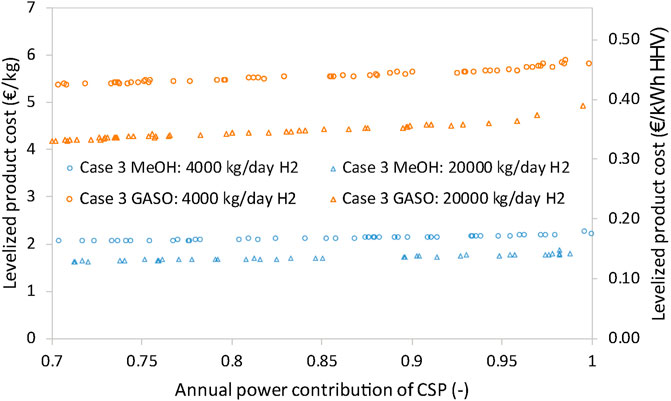
FIGURE 10. Trade-off between the annual power contribution of CSP and levelized methanol and gasoline cost.
Compared with the chosen locations in France and Italy, the solar profile and CSP in Spain are much more even and at high levels all over the year, which also indicates a more even production across over the year. Thus, to satisfy a given daily demand, the MSPT does not need to be oversized too much, and seasonal product storage can be less. The even and high solar profile leads to high average daily operating hours. For the chosen locations in France and Italy, the average operating hours are around 12 h, while those of Spain are simply higher than 15 h (Figure 11A).
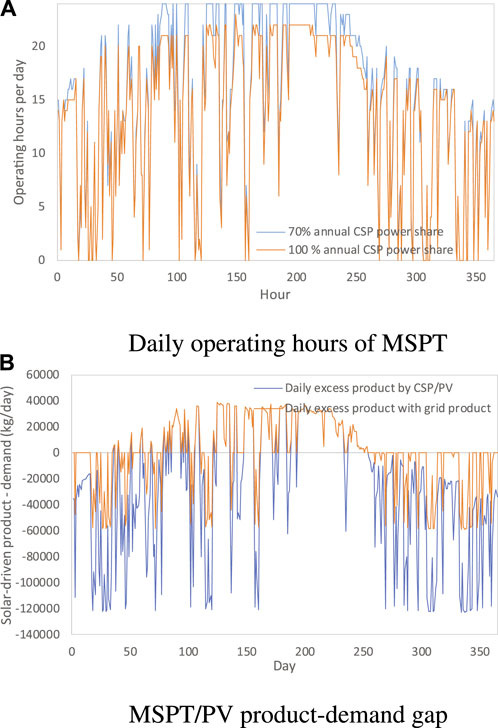
FIGURE 11. Daily operating hours of MSPT (A) and the gap between MSPT/PV product and demand (B) when the plant size is 4,000 kg/day H2 cases and the annual power contribution of CSP is 70%.
The gap between the daily product from MSPT/PV and daily demand of the solution with 70% annual power contribution CSP is illustrated in Figure 11B), showing that the summer production does not significantly exceed the daily demand. The state of charge of the seasonal product is similar to that for methane production, with the storage becomes empty around 100 days, and afterward, the storage is in charge process until 260 days.
The MSPT full-load operating hours at design points for the 4,000 kg/day H2 cases are optimized highly up to 23–24 h as stated in Section 5.1.1. However, different from case 1 and case 2, the 20,000 kg/day H2 cases of case 3 tend to have lower operating hours below 21 h, when the annual power contribution of CSP reaches as high as 90%. The full-load operating hours are related to the solar multiple. When the MSPT sizes vary, the shares of the heliostat field and receiver costs are changing, which is the reason that a smaller solar multiple is preferred for the MSPT scale of around 80–100 MW for the solar profile in Spain.
Given the high and even solar irradiation profile in Spain, the annual capacity factors of PV and the PV share of nominal power consumption are able to reach 22.2% and 40%, respectively, as shown in Figure 12, which is much higher than the values of cases in France and Italy. PV is competitive with grid power only when its annual capacity factor is in a high value due to its poor storage ability.
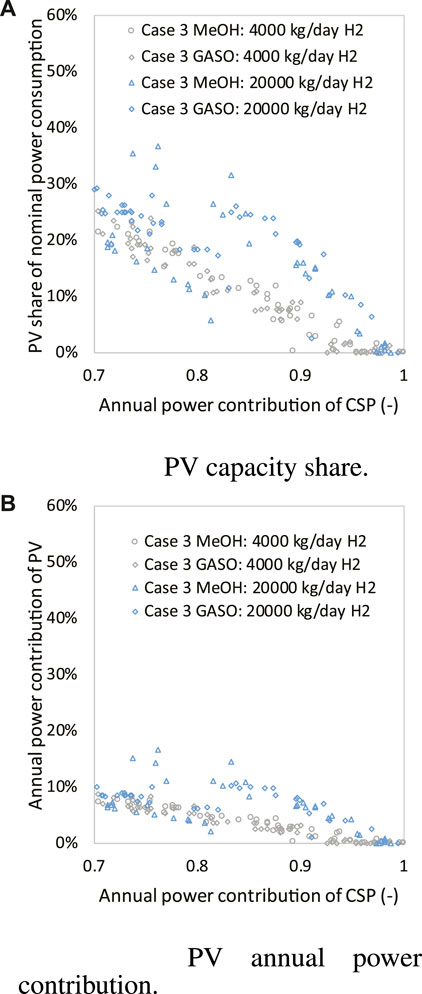
FIGURE 12. PV share in total nominal power capacity (A) and the annual PV contribution (B) in case 3.
Percentages of the CAPEX on total chemical production costs under different CSP annual power contribution are displayed in Figure 13. Similar to cases 1 and 2, the CAPEX makes up the largest portion in all optimal solutions and ranges from 74 to 86%. As power contribution of CSP increases, the proportion of CAPEX on total cost is improved accordingly due to the further oversizing of MSPT.
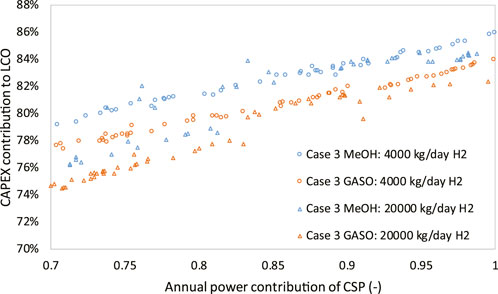
FIGURE 13. Total CAPEX contribution to the levelized methanol and gasoline cost.
The CAPEX distribution of methanol and gasoline synthesis processes are illustrated, respectively, in Figure 14 and Figure 15 when annual power contribution of CSP are 70% and 100%. For both cases, the CSP contribution is within the range of 63 to 70%, slightly lower than that of methane production. The second largest CAPEX comes from the SOE, around 15%, followed by the heat exchanger network (around 10%) and pressurizers (pumps/fans/compressors, 4%). Even when the PV capacity share in the total nominal capacity reaches around 20–40% (70% annual power contribution of CSP), PV only contributes around 3% of total CAPEX. The chemical processes, methanol and gasoline production, are much more expensive than a methanation system; however, compared with the SOE and MSPT systems, the CAPEX of these synthesis processes is rather low. The OPEX contribution is still mainly from the equipment maintenance and grid electricity and the trends of both contributions are also similar to that of methane production. The major differences are as follows: 1) methanol and gasoline synthesis require a smaller H/C ratio, thus leading to a higher OPEX of CO2 consumption; 2) the total catalyst OPEX (including initial and replacement OPEX) of gasoline production is much higher than that of methane and methanol production, since a zeolite catalyst is more expensive than Ni-based and Al2O3-based catalysts. Detailed information of OPEX is provided in the Supplementary Profile.
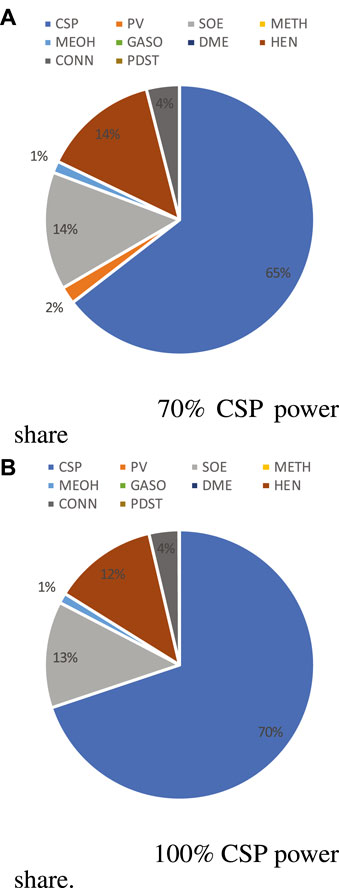
FIGURE 14. CAPEX breakdown for methanol production (HEN, heat exchangers when CSP power share is 70% (A) and 100% (B); CONN, pumps/compressors; and PDST, product storage) at plant size 4,000 kg/day H2.
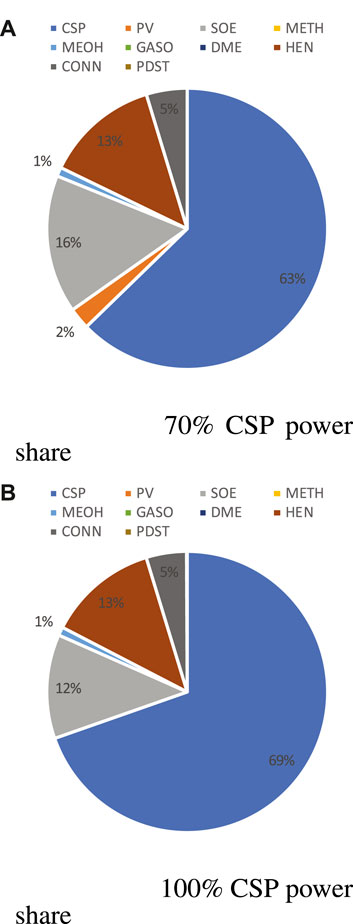
FIGURE 15. CAPEX/OPEX breakdown for gasoline production when CSP power share is 70% (A) and 100% (B) (HEN, heat exchangers; CONN, pumps/compressors; and PDST, product storage) at plant size 4,000 kg/day H2.
The MSPT cost breakdown calculated for case 3 (Figure 16) is rather different from that of cases 1 and 2 (Figure 9), taking the methanol synthesis process as an example. For the solar profile of Spain, the cost contribution from the heliostat field is smaller (22–25%) but higher than the receiver (22–19%). The explanation is that, with higher average solar irradiation, fewer heliostats are needed to gather the same amount of solar energy and deliver it to the receiver, which lowers their cost contribution. As well as the main variance caused by the shift in the annual power contribution of CSP, the contributions from the remaining components are quite comparable to those of cases 1 and 2. The heliostat field and receiver still account for the majority of the fluctuation; and as the MSPT size increases, the heliostat field’s contribution increases, while the receiver’s contribution decreases in tandem.
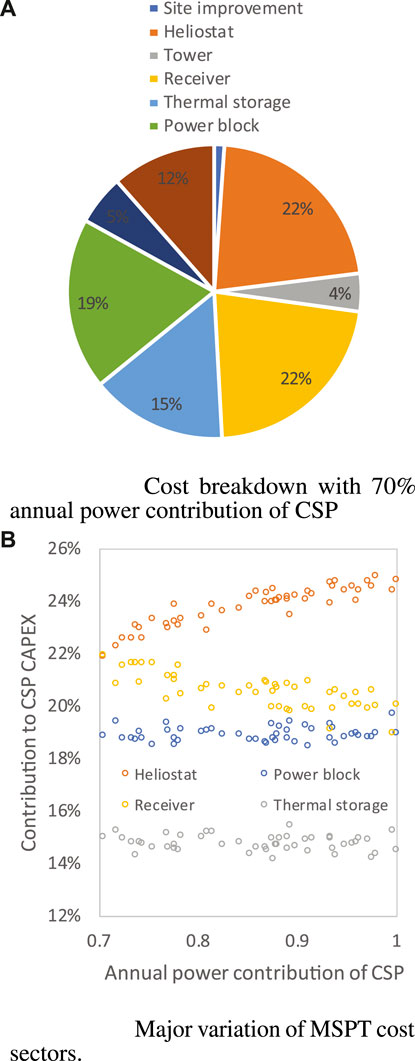
FIGURE 16. MSPT cost breakdown for methanol production when power contribute of CSP is 70% (A) and ranges in 0.7-1 (B).
The thermo-economics of solar-driven power-to-chemicals using solar energy, with the chemicals being methane, methanol, and gasoline, are evaluated in this paper. Thermal, chemical, and electricity storage units are involved to enhance the economic feasibility when associated with intermittent solar energy. A bi-level optimization is proposed, employing mixed-integer linear programming at the lower level for optimal sizes and operating strategies of technologies, and heat cascade use, and employing genetic algorithms at the upper level for optimizing the MSPT design. The major conclusions are as follows:
• PV is generally not preferred as a combination with the SOE for chemical production, particularly when its annual capacity factor is below 20%, due to the low annual capacity factor of PV compared with the MSPT. The MSPT takes the advantage of cheap and massive thermal storage.
• To minimize the levelized product cost, the MSPT tends to operate for as long as over 22 h with the aid of cost-effective and efficient molten-salt thermal storage. Increasing the annual power share of CSP, the whole system is oversized for producing more products during summertime, leading to larger seasonal storage and a higher product cost.
• The levelized product cost is dominated by the CAPEX (75–85%), with the remaining OPEX mostly contributed by equipment maintenance and grid power use. Over 60% of CAPEX comes from MSPT, followed by the SOE (around 10–15%) and heat exchanger network (around 10%). PV contributes less than 3%. The CAPEX of MSPT is dominated by the heliostat field and the receiver. Varying the size of MSPT, the shares of the heliostat field and receiver vary accordingly: a larger MSPT tends to have an increased cost contribution from the heliostat field, with a reduced contribution from the receiver.
• The levelized methane cost ranges from 4.5 to 8.5 €/kg, depending on the location, plant size, and annual power contribution of CSP. Due to the larger mass production, the levelized cost of methanol and gasoline is lower: 1.5–2.2 €/kg for methanol and 4–6 €/kg for gasoline.
The original contributions presented in the study are included in the article/Supplementary Material; further inquiries can be directed to the corresponding author.
SH and YuZ contributed to the conceptualization and methodology. SH and XG performed the result analysis. MQ and YoZ validated the results. SH, LL, and XZ contributed to original draft preparation. All authors read and agreed to the published version of the manuscript.
The research leading to the presented work was funded by the European Union’s 7th Framework Programme (FP7/2007-2013) under grant agreement No. 621173 (SOPHIA, topic FCH-JU-2013-1) and European Union’s Horizon 2020 under grant agreement 101007194 (prometeo). The author YuZ also received funding from the National Nature Science Foundation of China (Grant No. 52090062) and Interdisciplinary Innovation Program of North China Electric Power University.
The authors thank the partners involved in the SOPHIA project, particularly M. Maheut (ENGIE), N. Monnerie (DLR), R. Makkus (HyGear), and M. Petit Jean (CEA) for defining the case studies, and M. Jégoux, M. de Saint Jean (ENGIE), and A. Brunot (CEA) for fruitful discussions on the thermoeconomic and lifecycle assessment.
Author LL was employed by Weichai Power Co., Ltd. Author YoZ was employed by PetroChina.
The remaining authors declare that the research was conducted in the absence of any commercial or financial relationships that could be construed as a potential conflict of interest.
All claims expressed in this article are solely those of the authors and do not necessarily represent those of their affiliated organizations, or those of the publisher, the editors, and the reviewers. Any product that may be evaluated in this article, or claim that may be made by its manufacturer, is not guaranteed or endorsed by the publisher.
The Supplementary Material for this article can be found online at: https://www.frontiersin.org/articles/10.3389/fenrg.2022.1097325/full#supplementary-material
Abu-Hamdeh, N. H., and Alnefaie, K. A. (2016). Design considerations and construction of an experimental prototype of concentrating solar power tower system in Saudi Arabia. Energy Convers. Manag. 117, 63–73. doi:10.1016/j.enconman.2016.02.077
Baldi, F., Wang, L., Pérez-Fortes, M., and Maréchal, F. (2019). A cogeneration system based on solid oxide and proton exchange membrane fuel cells with hybrid storage for off-grid applications. Front. Energy Res. 6, 139. doi:10.3389/fenrg.2018.00139
Bianchi, F. R., and Bosio, B. (2021). Operating principles, performance and technology readiness level of reversible solid oxide cells. Sustainability 13, 4777. doi:10.3390/su13094777
Carbone, C., Gracceva, F., Pierro, N., Motola, V., Zong, Y., You, S., et al. (2021). Potential deployment of reversible solid-oxide cell systems to valorise organic waste, balance the power grid and produce renewable methane: A case study in the southern Italian peninsula. Front. Energy Res. 9, 618229. doi:10.3389/fenrg.2021.618229
Choe, C., Lee, B., Kim, A., Cheon, S., and Lim, H. (2021). Comprehensive assessment of co2 methanation: Which h2 production pathway is practicable for green methane production in terms of technical. Econ. Environ. aspects? 23, 9502–9514. doi:10.1039/d1gc02755g
Dahiru, A. R., Vuokila, A., and Huuhtanen, M. (2022). Recent development in power-to-X: Part I - a review on techno-economic analysis. -economic Anal. 56, 105861. doi:10.1016/j.est.2022.105861
Dieckmann, S., Dersch, J., Giuliano, S., Puppe, M., Lüpfert, E., Hennecke, K., et al. (2016).Lcoe reduction potential of parabolic trough and solar tower csp technology until 2025
Garlyyev, B., Xue, S., Fichtner, J., Bandarenka, A. S., and Andronescu, C. (2020). Prospects of value-added chemicals and hydrogen via electrolysis. ChemSusChem 13, 2513–2521. doi:10.1002/cssc.202000339
Habibollahzade, A., Gholamian, E., and Behzadi, A. (2019). Multi-objective optimization and comparative performance analysis of hybrid biomass-based solid oxide fuel cell/solid oxide electrolyzer cell/gas turbine using different gasification agents. Appl. Energy 233-234, 985–1002. doi:10.1016/j.apenergy.2018.10.075
Houaijia, A., Roeb, M., Monnerie, N., and Sattler, C. (2015). Solar power tower as heat and electricity source for a solid oxide electrolyzer: A case study. Int. J. Energy Res. 39, 1120–1130. doi:10.1002/er.3316
Joubi, A., Akimoto, Y., and Okajima, K. (2022). Techno-economic analysis of solar thermal hydrogen production in the united Arab emirates. Techno-economic analysis Sol. Therm. hydrogen Prod. united arab Emir. 3, 389–401. doi:10.3390/hydrogen3040024
Lin, M., Suter, C., Diethelm, S., and Haussener, S. (2022). Integrated solar-driven high-temperature electrolysis operating with concentrated irradiation. Joule 6, 2102–2121. doi:10.1016/j.joule.2022.07.013
Lu, D. (2015). Moderate-speed growth. Sustain. Dev. china’s Econ. 35, 1207–1219. doi:10.13249/j.cnki.sgs.2015.10.001
Ma, S., Lin, M., Lin, T.-E., Lan, T., Liao, X., Maréchal, F., et al. (2021). Fuel cell-battery hybrid systems for mobility and off-grid applications: A review. A Rev. 135, 110119. doi:10.1016/j.rser.2020.110119
Monnerie, N., von Storch, H., Houaijia, A., Roeb, M., and Sattler, C. (2017). Hydrogen production by coupling pressurized high temperature electrolyser with solar tower technology. Int. J. Hydrogen Energy 42, 13498–13509. doi:10.1016/j.ijhydene.2016.11.034
Peters, R., Baltruweit, M., Grube, T., Samsun, R. C., and Stolten, D. (2019). A techno economic analysis of the power to gas route. J. CO2 Util. 34, 616–634. doi:10.1016/j.jcou.2019.07.009
Sanz-Bermejo, J., Muñoz-Antón, J., Gonzalez-Aguilar, J., and Romero, M. (2014). Optimal integration of a solid-oxide electrolyser cell into a direct steam generation solar tower plant for zero-emission hydrogen production. Appl. energy 131, 238–247. doi:10.1016/j.apenergy.2014.06.028
Sun, D., Chen, M., Chen, Y., and Yulkeng, W. (2016). China’s new-type urbanization and investment demand prediction analysis 2015-2030 71, 1025. doi:10.11821/dlxb201606010
Venkataraman, V., Pérez-Fortes, M., Wang, L., Hajimolana, Y. S., Boigues-Muñoz, C., Agostini, A., et al. (2019). Reversible solid oxide systems for energy and chemical applications–review & perspectives. J. Energy Storage 24, 100782. doi:10.1016/j.est.2019.100782
Wang, L., Chen, M., Küngas, R., Lin, T.-E., Diethelm, S., Maréchal, F., et al. (2019). Power-to-fuels via solid-oxide electrolyzer: Operating window and techno-economics. Renew. Sustain. Energy Rev. 110, 174–187. doi:10.1016/j.rser.2019.04.071
Zhang, Y., Wang, N., Tong, X., Duan, L., Lin, T.-E., Maréchal, F., et al. (2021). Reversible solid-oxide cell stack based power-to-x-to-power systems: Economic potential evaluated via plant capital-cost target. Appl. Energy 290, 116700. doi:10.1016/j.apenergy.2021.116700
Zhong, L., Yao, E., Zou, H., and Xi, G. (2022). Thermodynamic and economic analysis of a directly solar-driven power-to-methane system by detailed distributed parameter method. Appl. Energy 312, 118670. doi:10.1016/j.apenergy.2022.118670
CAPEXs capital expenditures
CSP concentrated solar power
DNI direct solar radiation
LCO levelized cost
MSPT molten-salt solar tower power plant
OPEX operating expense
PtG power-to-gas
PtL power-to-L
PtX power-to-X
SAM System Advisor Model
SOE solid oxide electrolyzer
η efficiency
n hours
d day
mshu molten-salt hot utility
rc ranking cycle
s second
ts thermal storage
Keywords: energy storage, power-to-chemical, solid oxide electrolyzer, co-electrolysis, solar energy, concentrated solar
Citation: Huang S, Zhang Y, Guo X, Qian M, Zhao Y, Li L and Zhou X (2023) Thermo-economic evaluation and optimization of solar-driven power-to-chemical systems with thermal, electricity, and chemical storage. Front. Energy Res. 10:1097325. doi: 10.3389/fenrg.2022.1097325
Received: 13 November 2022; Accepted: 16 December 2022;
Published: 06 January 2023.
Edited by:
Rui Jing, Xiamen University, ChinaCopyright © 2023 Huang, Zhang, Guo, Qian, Zhao, Li and Zhou. This is an open-access article distributed under the terms of the Creative Commons Attribution License (CC BY). The use, distribution or reproduction in other forums is permitted, provided the original author(s) and the copyright owner(s) are credited and that the original publication in this journal is cited, in accordance with accepted academic practice. No use, distribution or reproduction is permitted which does not comply with these terms.
*Correspondence: Yumeng Zhang, eXVtZW5nLnpoYW5nQG5jZXB1LmVkdS5jbg==
Disclaimer: All claims expressed in this article are solely those of the authors and do not necessarily represent those of their affiliated organizations, or those of the publisher, the editors and the reviewers. Any product that may be evaluated in this article or claim that may be made by its manufacturer is not guaranteed or endorsed by the publisher.
Research integrity at Frontiers
Learn more about the work of our research integrity team to safeguard the quality of each article we publish.