 Qian Zhang
 Xuyang Jin1
- 1State Key Laboratory of Power Transmission Equipment and System Security and New Technology, Chongqing University, Chongqing, China
- 2State Key Laboratory of HVDC, Electric Power Research Institute CSG, Guangzhou, China
As a low-carbon and environmentally friendly renewable energy source, wind power has been globally recognized as the best solution to achieve energy saving and emission reduction and promote low-carbon economic growth. With the increase of wind power penetration, wind power has a great impact on sub-synchronous state stability and dynamic characteristics of the grid-connected system. Aiming at the fact that the correlation between clustering indexes and sub-synchronous oscillation (SSO) mode and the difference of the contribution to the clustering results are seldom considered in the current equivalent modeling of doubly-fed induction generator (DFIG)-based wind farm, this paper proposes a clustering method based on the index dimension reduction and weighted fuzzy C-means (WFCM) clustering algorithm. Besides, for the SSO study of the grid-connected system without sufficiently considering the coupling effects between controller parameters, a multi-parameter coupling optimization design strategy combining orthogonal experiment method (OEM) and response surface method is proposed. Firstly, the dominant variables of SSO mode of the DFIG-based wind farm connected to weak grid by series compensation system are taken as the initial clustering indexes. After dimension reduction by principal component analysis, the WFCM algorithm is utilized to cluster the wind farm. Then, the proportional and integral coefficients of the grid-side controller, rotor-side controller and phase-locked loop are optimized to achieve the simultaneous optimization of the SSO characteristics and dynamic characteristics of the system. Finally, the interaction between control parameters and the influence degree and trend on the system performance are quantitatively evaluated, and the optimal parameter combination is obtained. The proposed strategy can mitigate SSO more effectively while improving anti-interference than the particle swarm optimization based on OEM.
1 Introduction
Building a new power system with new energy as the main body and non-carbon energy as the carrier, and constructing a low-carbon and high-efficiency energy system are important ways to accelerate the construction of ecological civilization and realize the harmonious coexistence between human and nature (Huang et al., 2022). As a low-carbon and environmentally friendly renewable energy source, wind power has become an effective way to alleviate energy scarcity, combat climate change, and promote low-carbon economic growth worldwide (Xia et al., 2020). Doubly-fed induction generator (DFIG)-based wind farms are generally located in remote areas far from load centers. The strength of the grid is usually classified according to the short-circuit ratio (SCR). Generally, the grid with the value greater than 20 is considered as the strong grid and the value less than six is weak grid (Miao, 2012). As the grid-connected capacity of DFIGs continues to increase, the interaction between grid impedance and the equivalent impedance of DFIG-based wind farm can cause oscillations with weak grid operating condition. In addition, the series compensation capacitor will lead to the risk of sub-synchronous oscillation (SSO) (Liu et al., 2020; Leon et al., 2021). With the increasing penetration of wind power, equivalent modeling of wind farms has attracted attention at home and abroad. If each wind turbine is modeled in detail, it will not only increase the complexity of the power system model, but also be highly prone to the problem of dimensional disaster, which cannot reproduce SSO correctly (Han et al., 2020). Therefore, it is necessary to study dynamic equivalent modeling methods for wind farms to simplify the complexity of the model and reduce the computational effort.
Wind farm dynamic equivalence methods are generally divided into the single-machine equivalence method and the multi-machine equivalence method. The single-machine equivalence method equates all wind turbines into one unit, and the equivalent parameters are usually obtained by the weighted summation method (Pan et al., 2015). However, the actual operating conditions of the units within a large wind farm vary due to factors such as topography, wake effect, and time lag. When studying the dynamic characteristics of wind power grid-connected systems, the accuracy of the single-machine equivalence model cannot meet the actual demand. The multi-machine equivalence method clusters wind farms into multiple groups based on the principle that the operating conditions of wind turbines are the same or similar, and equates the wind turbine parameters of the same cluster, and finally uses several units to characterize the wind farm (Lei et al., 2013). The core idea of the multi-machine equivalence is to find the attribute that characterizes the key features of DFIG and use this attribute for clustering. In (Shabanikia et al., 2021), a weighted dynamic aggregation method is proposed to obtain equivalent turbines for the problem of wind speed variations in different regions and different turbine parameters in wind farm aggregation modeling. A dynamic equivalence method for DFIG-based wind farms based on density-peak clustering algorithm is proposed in (Liu et al., 2019), which performs a two-stage clustering of wind farms based on the protection state of the crowbar and the transient characteristics of each unit under faults. In (Zhou et al., 2019), variables such as steady-state wind speed, slip rate, active power output, and rotor current are selected as indicators and Gaussian density distance clustering algorithm is used for clustering.
However, the current equivalence model does not consider the correlation between clustering indexes and SSO mode. It is inconclusive whether it is applicable to the analysis of SSO characteristics of DFIG-based wind farm connected to weak grid by series compensation systems. Moreover, the data set consisting of multiple DFIGs and clustering indexes may contain strongly correlated variables, making the effect of a particular index magnified and resulting in a bias in clustering results. Because of high dimensionality, the data is complicated and redundant, which leads to a long time spent in clustering. Most of the clustering algorithms currently used focus on the optimization of clustering centers and the determination of the number of clusters, ignoring the differences and correlations between clustering indexes.
The control system of DFIG consists of several PI controllers and the effects of different control parameters on the system performance vary greatly. The SSO can be effectively mitigated by reasonably adjusting control parameters to optimize the overall dynamic performance of the system. The main methods for optimizing DFIG control parameters are engineering tuning (Wanigasekara et al., 2022), small-signal analysis (Hu et al., 2022), and intelligent algorithm (Han et al., 2021). The engineering tuning relies too much on experience and there is “over-adjustment” or “blind adjustment” in the process of parameter adjustment; the small-signal analysis is not universal and is greatly influenced by the system operation state; the intelligent algorithm is difficult to obtain the optimization range and the global optimum cannot be satisfied. In (Bakir et al., 2020), the offline optimization of PI controllers at the rotor side of the DFIG wind energy system is achieved by bacterial foraging algorithm. In (Chen et al., 2019), based on participation factors and small signal model eigenvalues, the system damping is increased by exploring the optimal range of PI parameters. Most of the present studies on the optimization of DFIG parameters adopt intelligent algorithms. There is a lack of analysis of the interaction between parameters, and it is easy to fall into local optimum due to the lack of clear optimization direction.
To address the above problems, the dominant variables of SSO mode of the DFIG-based wind farm connected to weak grid by series compensation system are taken as the initial clustering indexes. Considering the adaptation to dynamic and transient process analysis under multi-disturbance scenarios, a clustering method for DFIG-based wind farm based on the principal component analysis (PCA) and weighted fuzzy C-means (WFCM) clustering algorithm is proposed. The main contributions are as follows:
1) The proposed clustering method solves the problem that the correlation between clustering indexes and SSO mode, the contribution degree of different clustering indexes to the clustering results, and the inaccurate clustering caused by data redundancy are seldom considered in the equivalent modeling of the wind farm in the current study of the DFIG-based wind farm connected to weak grid by series compensation system.
2) A multi-parameter coupling optimization strategy combining orthogonal experiment method (OEM) and response surface method (RSM) is proposed to quantitatively analyze the interaction between each control parameter and the sensitivity and influence trend on the system performance, which solves the problem that the intelligent algorithm is easy to fall into local optimum.
3) Aiming at the simultaneous optimization of the sub-synchronous state stability and dynamic characteristics of the system, the control parameters of the clustered equivalent units are optimized. The optimal parameter combination is obtained, and the effective mitigation of SSO and the improvement of system anti-interference are achieved.
The rest of this paper is organized as follows: Section 2 introduces the DFIG-based wind farm clustering method based on the PCA and WFCM algorithm. The multi-parameter coupling optimization strategy based on the OEM-RSM is explained in Section 3. Section 4 gives the results of equivalence modeling and parameter optimization of the wind farm, and analyzes the interaction between control parameters and the influence degree on the performance of the grid-connected system. Conclusions and outlooks are drawn in Section 5.
2 Sub-synchronous oscillation equivalence of DFIG-based wind farm
2.1 Dimension reduction of clustering indexes based on PCA
2.1.1 Selection of clustering indexes for DFIG-based wind farm
In the DFIG-based wind farm connected to weak grid by series compensation system, the analysis of the SSO mechanism shows that the phase-locked loop (PLL) phase angle may affect the output voltages of grid-side controller (GSC) and rotor-side controller (RSC) and thus the output current of DFIG leading to system destabilization oscillation. And the fluctuation of DC-link voltage may affect the output current of DFIG and thus the grid voltage through GSC and RSC output voltages (Dong et al., 2016). Also, the grid strength, series compensation degree (SCD), DFIG d-axis and q-axis stator current and d-axis and q-axis rotor current are the main influencing factors of SSO (Liu et al., 2017). In order to better analyze SSO characteristics of the system, improve the effectiveness of clustering, and then design more targeted mitigation measures, this paper takes the dominant variables of SSO mode as clustering indexes: grid current angular frequency
The initial operating point of DFIG-based wind farm is an important basis for characterizing its steady-state properties. Different initial operating points affect the dynamic response of the wind turbine during SSO, resulting in differences in the state. Considering the adaptation to the analysis of dynamic and transient processes under multi-disturbance scenarios, this paper selects one time point of data before DFIG-based wind farm is connected to weak grid by series compensation (
2.1.2 Dimension reduction by PCA
The 24 initial clustering indexes may contain strongly correlated variables, which makes the weight and influence of a certain index magnified, resulting in a tendency of clustering results and affecting the accuracy of clustering. Moreover, the dimension of the data set is high and the data are complicated and redundant, so it takes longer time for clustering. Therefore, before using the initial clustering index to cluster DFIGs, it is necessary to process the data to eliminate the strong correlation and redundancy among them and reduce the negative impact on the clustering results caused by the interference of the data itself.
As a dimension reduction method for unsupervised learning, PCA is mainly used to reduce the dimension of dataset by measuring the amount of information through variance to eliminate the interaction between the original data (Sun et al., 2021). The magnitude of carrying the original feature variance information can be characterized by the contribution rate of principal component (PC). A larger contribution rate indicates that the PC is more capable of explaining the original feature information. In this paper, PCA is used to reduce the dimension of 24 initial clustering indexes in five steps (Li et al., 2019):
1) Build the sample matrix of the original data. The initial clustering index data extracted from the wind farm are constructed into a sample matrix
2) Calculate the sample covariance matrix. The data in
Where
3) Calculate the eigenvalues of
4) Calculate the PC contribution rate and cumulative contribution rate.
Where
5) Construct the new sample matrix after dimension reduction. After determining the number of PC, take the first
Compared with the initial data of DFIG-based wind farm, the reliability and validity of the data after dimension reduction by PCA are improved. Taking them as the clustering indexes of DFIG-based wind farm can improve the accuracy of clustering results.
2.2 Clustering of DFIG-based wind farm based on WFCM algorithm
2.2.1 WFCM clustering algorithm
FCM clustering algorithm is a method to describe and partition things with ambiguity or uncertainty (Zhao et al., 2022). When the traditional FCM algorithm is used to cluster wind turbines, the contribution degree of different clustering indexes to the clustering results is ignored, resulting in unreasonable clustering results. According to PCA, the contribution of each index is greatly different. Therefore, this paper proposes an FCM clustering algorithm with fixed weights of indexes by assigning corresponding weights to each index. The weights can be calculated by Eq. 10.
Where
The reduced dimensional PC is taken as the clustering index of the DFIG-based wind farm.
1) Initialize the number of clusters
2) Determine the affiliation matrix
Where
3) Construct the objective function
4) Update the clustering center
2.2.2 Clustering validity test
Clustering validity research is the process of evaluating the quality of clusters and determining the optimal number of clusters by establishing validity indexes (Chen et al., 2018). In order to ensure the accuracy and objectivity of the clustering results, the Xie-Beni(XB) index, which is widely used in fuzzy clustering, is chosen to determine the optimal number of clusters (Geng et al., 2019).
The numerator of
To verify the rationality of the wind farm clustering indexes and further illustrate the effectiveness of WFCM algorithm and the rationality of clustering results, the Silhouette coefficient (SC) index and Calinski-Harabasz index (CHI) are selected for evaluation. The SC index is defined as follows:
Where
The CHI takes into account the inter-class dispersion B and intra-class compactness W. Larger
The flow chart of the proposed WFCM algorithm is demonstrated in Figure 1.
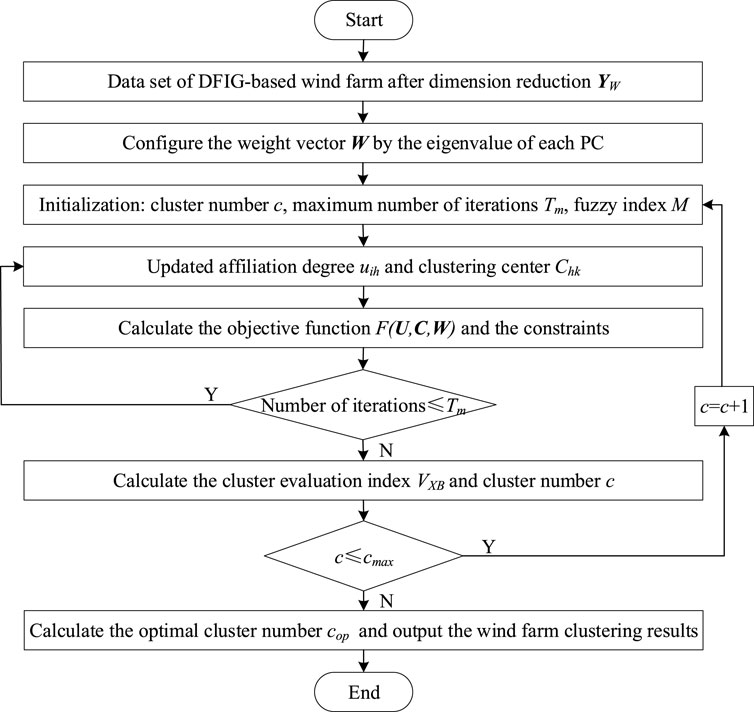
FIGURE 1. Flow chart of the WFCM algorithm.
2.3 Calculation of equivalent parameters for DFIG-based wind farm
According to the principle of constant output characteristics before and after equivalence, all the units in the cluster can be equivalent using the model of one unit. Assuming that there are d DFIGs of the same type in the same cluster after clustering by WFCM algorithm, the equivalent parameters can be calculated as follows:
where the subscript eq is the equivalent parameter; the subscript i is the i-th wind turbine in the same cluster; S, P, Q, H, D, K, Rs, Xs, v, and ZT are the rated capacity, active power, reactive power, inertia time constant, damping coefficient of shafting, stiffness coefficient of shafting, stator resistance, stator reactance, effective input wind speed, and transformer impedance, respectively.
According to the constant voltage difference before and after equivalent, the equivalent impedance of the trunk type collector line of the wind farm
3 Multi-parameter coupling optimization design of DFIG-based wind farm based on OEM-RSM
In (Zhang et al., 2022), we have optimized the proportional and integral coefficients of GSC, RSC and PLL for a single DFIG connected to weak grid by series compensation system. Considering the SSO characteristics and dynamic characteristics of the system, the integrated average value of DC-link voltage overshoot
The single-factor experiment method is to conduct experiments on only one factor while keeping all other factors constant, so as to explore the optimal range of values for each factor. The RSM uses a multiple quadratic regression equation to establish the functional relationship between the influencing factors and the response values based on the data obtained by the experimental design method, and the optimal parameter combination can be found by analyzing the equation (Si et al., 2018). It is generally utilized for experimental designs with few factors (generally 2–4) and few factor levels. In this paper, control parameters of each equivalent wind turbine are changed simultaneously and preliminary optimized by OEM to obtain the three factors that have the most significant influence on SSO and dynamic characteristics of the grid-connected system and seven insignificant factors. The seven insignificant factors can be valued according to the optimization results of OEM. Based on the values of three significant factors and the influence trend of them on OD, the single-factor experiment method is utilized to further determine the appropriate range of values. Set the values of each factor in RSM, a 3-factor, 3-level response surface experiment can be designed by Box-Behnken central combination. The experimental data of OD can be fitted according to the model with the best fit, and the model can be analyzed by analysis of variance (ANOVA) and constructed statistics. When all the indexes of the model meet the criteria, the regression equation between each factor and the evaluation index can be fitted, which can be expressed by Eq. 23. Then, the three-dimensional response surface can be plotted to obtain the interaction between the factors and the optimal OD of the system and the corresponding levels of each factor.
Where
4 Case study
4.1 Parameter setting
A time-domain simulation model of DFIG-based wind farm connected to weak grid by series compensation is built in Matlab/Simulink as shown in Figure 2. The wind farm contains 25 DFIGs of the same type, and the wind farm parameters and DFIG control parameters are shown in Table 1 and Table 2. The distance between each row of DFIGs is 500 m. The DFIG-based wind farm is connected to the 35 kV medium voltage bus through terminal transformers and overhead lines, and then the main transformer is connected to the 220 kV grid through the transmission line. According to the wind speed, wind direction, and wake effect, the wind speed of each unit in the wind farm can be calculated as shown in Table 3.

FIGURE 2. Topology structure of DFIG-based wind farm.
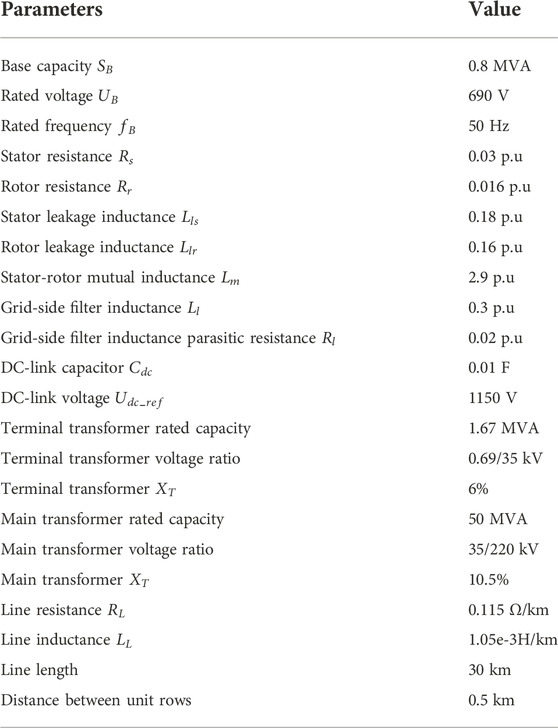
TABLE 1. Parameters of DFIG-based wind farm.
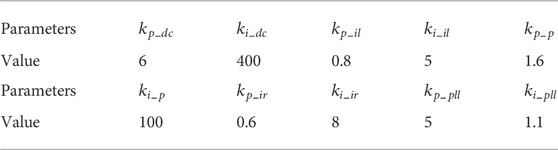
TABLE 2. DFIG control parameters.
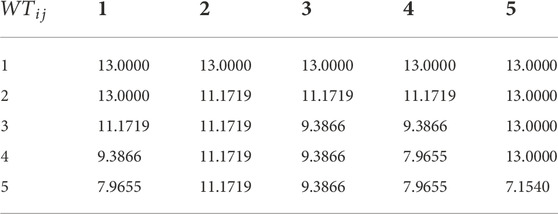
TABLE 3. Wind speed of each unit in DFIG-based wind farm (m/s).
4.2 Equivalent modeling results for DFIG-based wind farm
The initial SCR is set to 3 and SCD is 20%. The SCR is changed to 2 and SCD is changed to 60% at 2.1 s. The SCR and SCD are changed back to initial values at 3.1 s. A three-phase ground short-circuit fault is occurred at 4 s and removed at 4.15 s. The data collected at 2s are
4.2.1 Results of dimension reduction by PCA
The dimension of
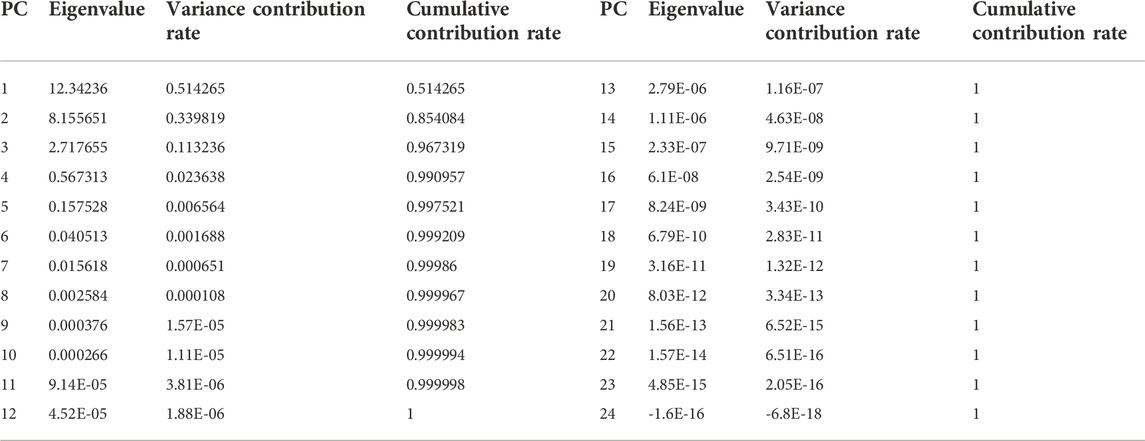
TABLE 4. Contribution rates of PCs.
It can be found that the 24 initial clustering indexes contain strongly correlated indexes, which will cause bias in the clustering results, so the dimension of data need to be reduced. The cumulative contribution rate of the first three PCs has reached 96.7319%, greater than 95%, which meets the requirement for the selection of PCs in PCA, while the remaining indexes have little influence on contribution. The contribution rates of the first three PCs are 51.4265%, 33.9819%, and 11.3236%, respectively. Therefore, the first three PCs can be selected for dimension reduction, i.e., the initial clustering indexes are reduced to 3 dimensions. The component with the eigenvalue of 12.34236 is the first PC, the component with the eigenvalue of 8.155651 is the second PC, and the component with the eigenvalue of 2.717655 is the third PC, which basically retains the information of the original data. The contribution rates of these three PCs are given in Figure 3.
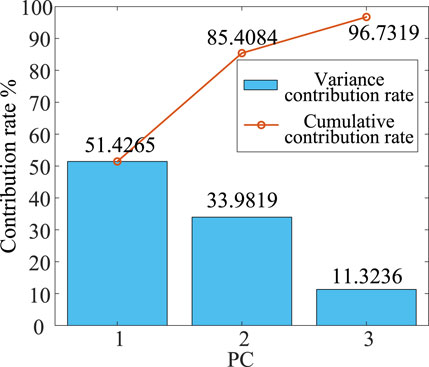
FIGURE 3. Contribution rates of PCs.
So far, the dimension of 24 initial clustering indexes are reduced to obtain 3 PC indexes by PCA, and the new sample matrix after dimension reduction
4.2.2 Clustering results for DFIG-based wind farm
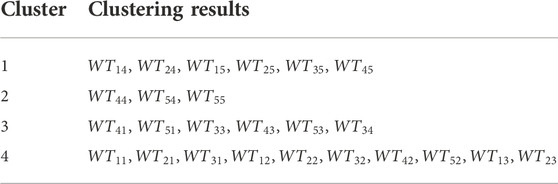
TABLE 5. The clustering results for DFIG-based wind farm by WFCM.
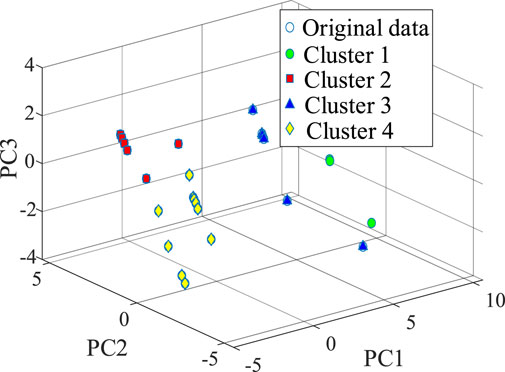
FIGURE 4. The clustering results for DFIG-based wind farm by WFCM.
In order to verify the effectiveness of WFCM algorithm and the reasonableness of clustering results, Figure 5A shows the profile coefficients of 25 DFIGs when the clusters is 4, Figure 5B shows the results of average profile coefficient, and Figure 5C shows the results of CHI.
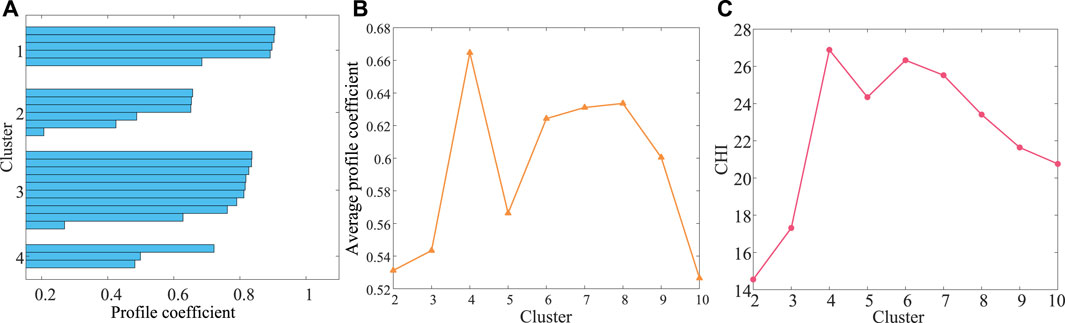
FIGURE 5. Clustering evaluation indexes. (A) Profile coefficient; (B) Average profile coefficient; (C) CHI.
It can be observed from Figure 5A that the profile coefficients of 25 DFIGs are all greater than 0 when the cluster is 4, indicating the clustering is reasonable and effective. From Figure 5B,C, the average profile coefficient and CHI are both maximum at the cluster of 4, which is consistent with XB index. Therefore, the 25 DFIGs built in this paper can be divided into four equivalent clusters.
4.3 Multi-parameter coupling optimization results for DFIG-based wind farm
The equivalent wind farm after clustering are preliminarily optimized by OEM, and the values of each control parameter can be obtained as shown in Table 6. From the results of OEM, the three factors that have the most significant effect on SSO characteristics and dynamic characteristics of DFIG-based wind farm connected to weak grid by series compensation system are GSC DC voltage loop proportional coefficient
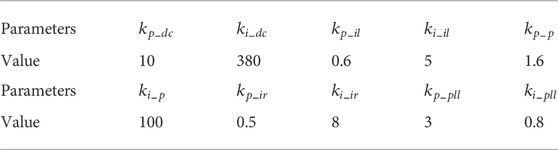
TABLE 6. Optimal parameter combination based on OEM.
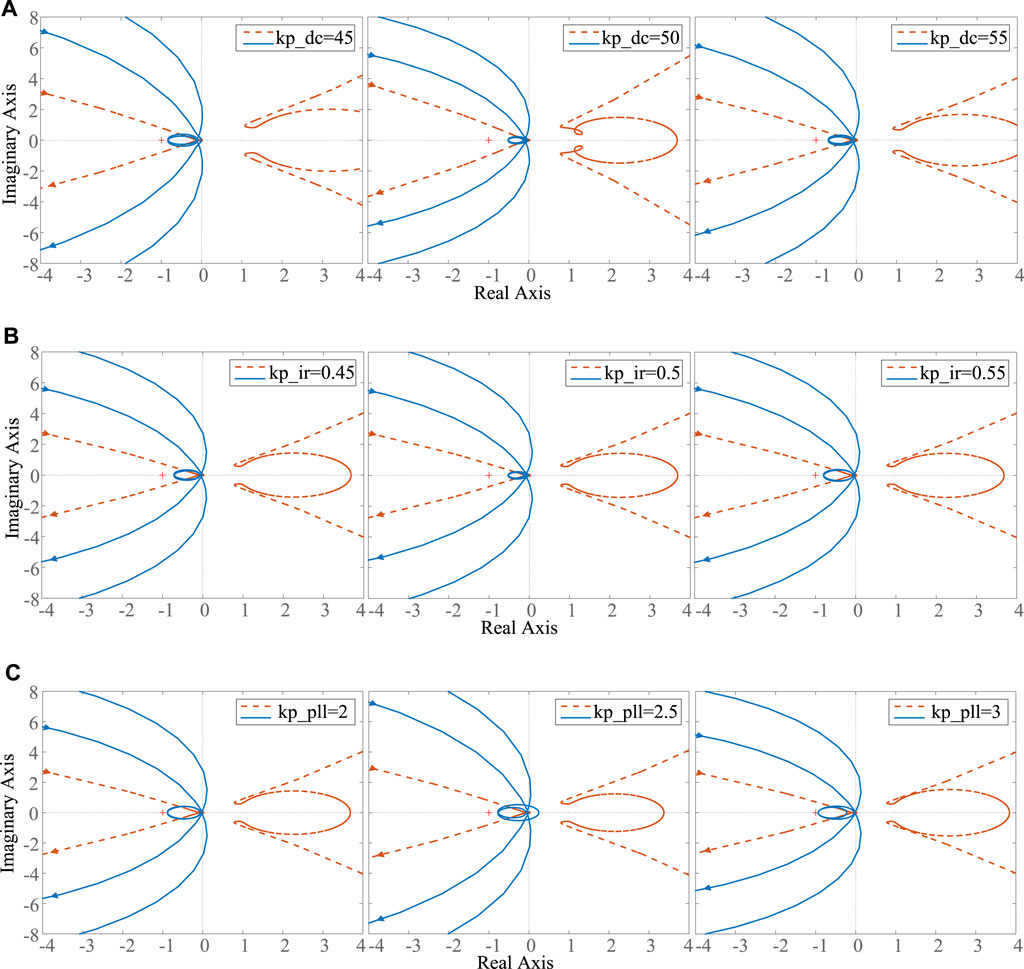
FIGURE 6. Generalized Nyquist curves of the system with (A) different
According to the generalized Nyquist stability criterion, if the Nyquist curves do not enclose (−1, j0), the system is stable and the further away from that point, the more stable the system is. It can be found that the optimal value exists between 45 and 55 for
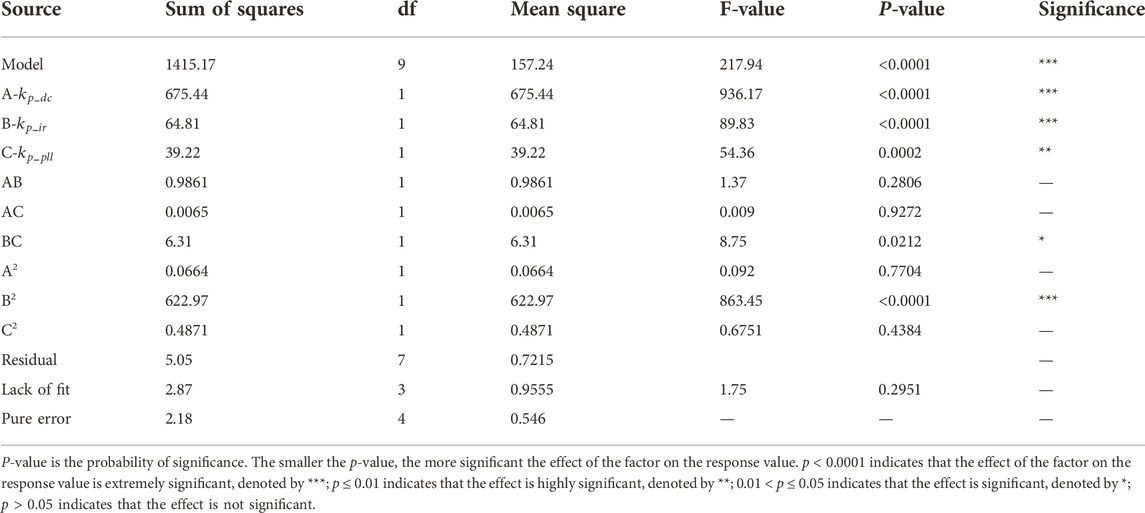
TABLE 7. ANOVA results for OD of RSM.
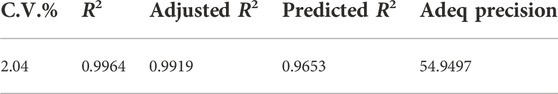
TABLE 8. Statistics for OD of RSM.
As can be seen from Table 7, the p-value of the model is less than 0.0001, indicating that the overall effect of the parameter combination on OD is extremely significant. Linear terms A, B and quadratic term B2 have an extremely significant effect on OD, quadratic term C2 has a highly significant effect on OD, interaction term BC has a significant effect on OD, and the effects of other terms are not significant. The significance of the effect of each factor is A > B > C, that is,
The statistics of the experiment data should meet the requirements of C.V.% less than 10, precision greater than 4, R2, adjusted R2, and predicted R2 are close to 0.9, and the difference between adjusted R2 and predicted R2 is less than 0.2. From Table 8, it can be found that the statistics of the model all meet the requirements, indicating that the fit and correlation of the model are good and the error is small, so it can also predict OD under different combinations of operating parameters.
A quadratic multiple regression is fitted to a total of 51 data points from 17 sets of experiments to create a regression equation as in (24). The response surface of each factor combination on OD is depicted in Figure 7.
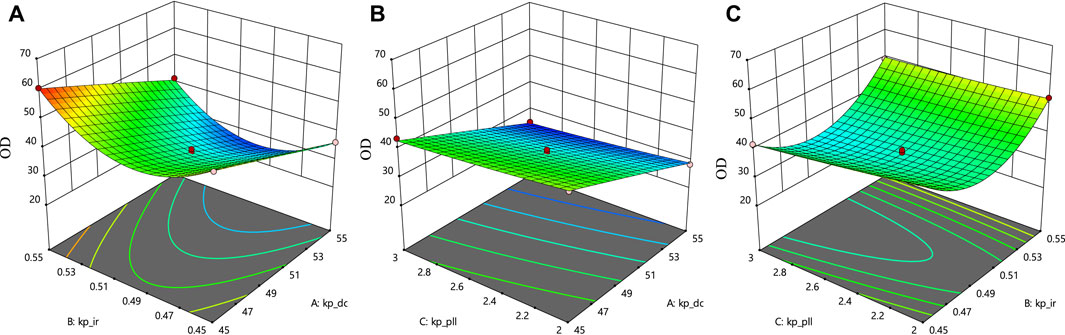
FIGURE 7. Effect of factors on OD. (A) Effect of
As shown in Figure 7A, OD decreases and then rises as
The optimal solution that satisfies the optimization index can be obtained by optimizing OD through (24). The optimal predicted and experimental value can be calculated by substituting the corresponding factor values into the regression equation and simulation model and then the error between them can be obtained. The results are listed in Table 9.
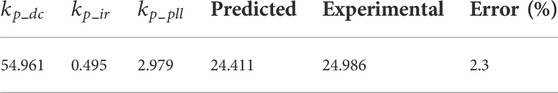
TABLE 9. Optimal parameter combination based on RSM.
Noticeably, the OD predicted by the model is 24.411, which is 1.33% lower than the minimum value of the response surface experiment (24.741). The error between the predicted and the experimental value is 2.3% (not more than 5%), indicating that the regression model is accurate and effective for the optimization.
4.4 Simulation results
To verify the effectiveness of the multi-parameter coupling optimization design strategy in this paper, the strategy combining the OEM and PSO in (Geng et al., 2019) is used for comparative verification. The SCR is changed from 3 to 2 and SCD is changed from 20% to 60% at 2s. The FFT analysis of the grid-connected current and generalized Nyquist curves of the system after 2s are depicted in Figure 8. Figure 9 shows the d-axis stator current waveform.
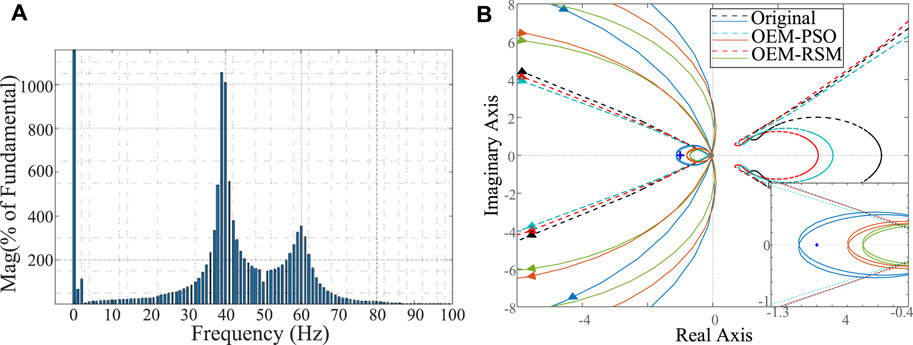
FIGURE 8. FFT analysis of the grid-connected current and generalized Nyquist curves of system. (A) FFT analysis of the grid-connected current; (B) Generalized Nyquist curves.

FIGURE 9. D-axis stator current waveform.
The FFT analysis is used to determine the frequency at which oscillations occur in the grid-connected system. It can be found from Figure 8 that the system appears SSO with a frequency of 39 Hz (lower than power frequency 50 Hz). The generalized Nyquist curve after 2 s changes from enclosing (−1, j0) to not enclosing and gradually moving away when control parameters change from the original parameters to the optimized parameters, indicating that the system changes from unstable to stable. It can be observed from Figure 9 that the system is destabilized after the grid condition changes to very weak grid and high series compensation degree with the original parameters, resulting in divergent SSR. After optimization by the strategy proposed in this paper and the strategy in (Geng et al., 2019), the system oscillations converge. The d-axis stator current returns to stability after about 2 s with the optimized parameters of the OEM-PSO, whereas it only oscillates for about 0.7 s with the optimized parameters of the OEM-RSM. Apparently, both optimization methods are effective in improving the stability of the sub-synchronous state of the system, and the OEM-RSM is more effective. The simulation results are consistent with the theoretical analysis results.
Figure 10 illustrates the DC-link voltage, active power, and grid current angular frequency curves when the SCR is 3 and SCD is 20%, with a three-phase ground short-circuit fault occurring at 2 s and removed after 0.1 s. To facilitate the analysis,
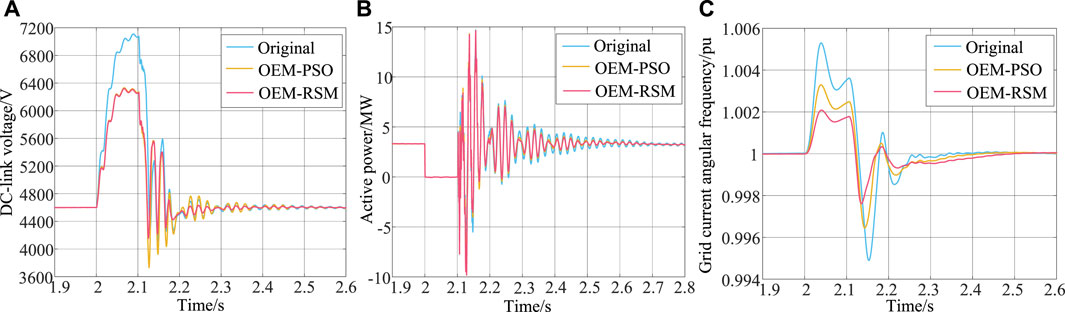
FIGURE 10. DC-link voltage, active power, and grid current angular frequency waveform. (A) DC-link voltage; (B) Active power; (C) Grid current angular frequency.
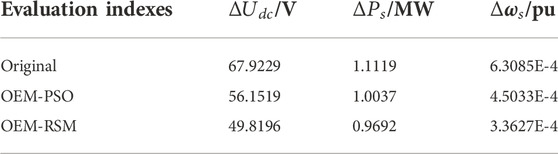
TABLE 10. Results of evaluation indexes with 3 parameter combinations.
From Figure 10, after optimization of the proposed strategy, the overshoot and settling time of DC-link voltage, active power, and grid current angular frequency with disturbance are much smaller, and the fluctuation is significantly weakened and the anti-interference is strongly enhanced. It can be found from Table 10 that
5 Conclusion
Based on the model of DFIG-based wind farm connected to weak grid by series compensation system, this paper proposes a clustering method based on the PCA and WFCM algorithm, with the dominant variables of the system SSO mode as the initial clustering indexes. For the equivalent wind farm after clustering, the DFIG control parameters are taken as the optimization object, and the sub-synchronous state stability and dynamic characteristics of the system are simultaneously optimized as the optimization objective. The optimal design strategy combining the OEM and RSM is adopted to quantitatively evaluate the interaction between controller parameters and the significance of their effects on the SSO and dynamic characteristics of the grid-connected system. The optimal parameter combination is obtained to achieve the effective mitigation of SSO. The highlights are as follows:
1) The proposed equivalence modeling method for DFIG-based wind farm takes into account the correlation between clustering indexes and SSO mode as well as the contribution degree of different clustering indexes to clustering results. It eliminates the redundancy of data and can be applied to study SSO in large-scale wind farm grid-connected systems.
2) Compared with the OEM-PSO, the proposed multi-parameter coupling optimization strategy can effectively improve the anti-interference and system stability in the sub-synchronous state, which can be applied to study the optimization problems of complex systems with multiple parameters and indexes.
3)
In addition, the current work will also be carried out for better analyzing and solving the SSO problem in actual situations in the near future. Since the control parameters of each cluster are changed synchronously in this paper, the interaction between clusters and the influence of control parameters of different clusters at different locations on SSO characteristics of the system will be fully considered to improve the proposed strategy.
Data availability statement
The original contributions presented in the study are included in the article/Supplementary Material, further inquiries can be directed to the corresponding author.
Author contributions
QZ put forward the initial concept and gave technical guidance in the whole process. XJ carried out the overall work for the paper and drafted the whole paper. FZ, HY, and BZ contributed to the revision and typesetting of the manuscript. All authors read and approved the final manuscript.
Funding
This work was supported in part by the State Key Laboratory of HVDC, Electric Power Research Institute, CSG (No. SKLHVDC-2020-KF-14).
Conflict of interest
The authors declare that the research was conducted in the absence of any commercial or financial relationships that could be construed as a potential conflict of interest.
Publisher’s note
All claims expressed in this article are solely those of the authors and do not necessarily represent those of their affiliated organizations, or those of the publisher, the editors and the reviewers. Any product that may be evaluated in this article, or claim that may be made by its manufacturer, is not guaranteed or endorsed by the publisher.
References
Bakir, H., Merabet, A., Dhar, R. K., and Kulakistet, A. A. (2020). Bacteria foraging optimisation algorithm based optimal control for doubly-fed induction generator wind energy system. IET Renew. Power Gener. 14 (11), 1850–1859. doi:10.1049/iet-rpg.2020.0172
Chen, A., Xie, D., Zhang, D., Gu, C., and Wang, K. (2019). PI parameter tuning of converters for sub-synchronous interactions existing in grid-connected DFIG wind turbines. IEEE Trans. Power Electron. 34 (7), 6345–6355. doi:10.1109/tpel.2018.2875350
Chen, Y., Wu, H., and Shi, J. (2018). Application of singular value decomposition algorithm to dimension-reduced clustering analysis of daily load profiles. Automation Electr. Power Syst. 42 (3), 105. doi:10.7500/AEPS20170309008
Dong, X., Hou, J., Tian, X., and Liu, Y. (2016). Comparison of the impact level on subsynchronous resonance characteristics of dominant factors by multiple wind farms at different locations. High. Volt. Eng. 42 (07), 2259. doi:10.13336/j.1003-6520.hve.20160713029
Geng, J., Qian, X., and Zhou, S. (2019). New fuzzy clustering validity index. Appl. Res. Comput. 36 (4), 1001. doi:10.19734/j.issn.1001-3695.2017.10.0991
Han, J., Miao, S., Li, L., Yang, W., and Li, Y. (2020). Wind turbines clustering in wind farm based on multi-view transfer learning and synthetic optimization of parameters in equivalent wind farm. Proc. CSEE 40 (15), 4866. doi:10.13334/j.0258-8013.pcsee.190952
Han, K. L., Huang, T. W., and Yin, L. F. (2021). Quantum parallel multi-layer Monte Carlo optimization algorithm for controller parameters optimization of doubly-fed induction generator-based wind turbines. Appl. Soft Comput. 112, 107813. doi:10.1016/j.asoc.2021.107813
Hu, B., Nian, H., Li, M., Xu, Y., Liao, Y., and Yang, J. (2022). Impedance-based analysis and stability improvement of DFIG system within PLL bandwidth. IEEE Trans. Ind. Electron. 69 (6), 5803–5814. doi:10.1109/tie.2021.3088369
Huang, J., Wu, X., Zheng, Z., Huang, Y., and Li, W. (2022). Multi-objective optimal operation of combined cascade reservoir and hydrogen system. IEEE Trans. Ind. Appl. 58 (2), 2836–2847. doi:10.1109/tia.2021.3138949
Lei, H., Zhen, C., Yue, X., Xu, G., and Bao, J. (2013). Mitigating thermal power’s SSR by additional damping controller of DFIG. Electr. Power 46 (4), 63. doi:10.3969/j.issn.1004-9649.2013.04.014
Leon, A. E., Amodeo, S. J., and Mauricio, J. M. (2021). Enhanced compensation filter to mitigate subsynchronous oscillations in series-compensated DFIG-based wind farms. IEEE Trans. Power Deliv. 36 (6), 3805–3814. doi:10.1109/tpwrd.2021.3049318
Li, C., Cai, W., Zhao, R., Yu, C., and Zhang, Q. (2019). Power consumption behavior analysis of AP cluster users based on optimized SAX and weighted load characteristic index. Trans. China Electrotech. Soc. 34 (S1), 368. doi:10.19595/j.cnki.1000-6753.tces.l80097
Liu, J., Yao, W., Wen, J., Fang, J., Jiang, L., He, H., et al. (2020). Impact of power grid strength and PLL parameters on stability of grid-connected DFIG wind farm. IEEE Trans. Sustain. Energy 11 (1), 545–557. doi:10.1109/tste.2019.2897596
Liu, J., Yao, W., and Wen, J. (2017). Small signal stability analysis and control of double-fed induction generator considering influence of PLL and power grid strength. Proc. CSEE 37 (11), 3162. doi:10.13334/j.0258-8013.pcsee.160857
Liu, M., Pan, W., Zhang, Y., Zhao, K., Zhang, S., and Liu, T. (2019). A dynamic equivalent model for DFIG-based wind farms. IEEE Access 7, 74931–74940. doi:10.1109/access.2019.2918359
Ma, X., Yang, Q., Chen, C., Luo, H., and Zheng, D. (2021). Harmonic and interharmonic analysis of mixed dense frequency signals. IEEE Trans. Ind. Electron. 68 (10), 10142–10153. doi:10.1109/tie.2020.3026288
Miao, Z. X. (2012). Impedance-model-based SSR analysis for type 3 wind generator and series-compensated network. IEEE Trans. Energy Convers. 27 (4), 984–991. doi:10.1109/tec.2012.2211019
Pan, X., Zhang, C., and Ju, P. (2015). Coherency-based dynamic equivalence of wind farm composed of doubly fed induction generators. Power Syst. Technol. 39 (03), 621. doi:10.13335/j.1000-3673.pst.2015.03.006
Shabanikia, N., Nia, A. A., Tabesh, A., and Khajehoddin, S. A. (2021). Weighted dynamic aggregation modeling of induction machine-based wind farms. IEEE Trans. Sustain. Energy 12 (3), 1604–1614. doi:10.1109/tste.2021.3057854
Si, J., Zhao, S., Feng, H., Cao, R., and Hu, Y. (2018). Multi-objective optimization of surface-mounted and interior permanent magnet synchronous motor based on taguchi method and response surface method. Chin. J. Electr. Eng. 4 (1), 67. doi:10.23919/CJEE.2018.8327373
Sun, Y., Mao, Y., Li, Z., Zhang, X., and Li, F. (2021). A comprehensive clustering method of user load characteristics and adjustable potential based on power big data. Proc. CSEE 41 (18), 6259. doi:10.13334/j.0258-8013.pcsee.201928
Wang, Z., Yang, C., Oh, S. -K., Fu, Z., and Pedrycz, W. (2020). Robust multi-linear fuzzy SVR designed with the aid of fuzzy C-means clustering based on insensitive data information. IEEE Access 8, 184997–185011. doi:10.1109/access.2020.3030083
Wanigasekara, C., Swain, A., Almakhles, D., and Zhou, L. (2022). Design of delta–sigma-based PID controller for networked wind energy conversion systems. IEEE Trans. Ind. Appl. 58 (1), 879–889. doi:10.1109/tia.2021.3126574
Xia, Y., Chen, Y., Song, Y., and Strunz, K. (2020). Multi-scale modeling and simulation of DFIG-based wind energy conversion system. IEEE Trans. Energy Convers. 35 (1), 560–572. doi:10.1109/tec.2019.2953893
Zhang, F., Yuan, H., Zhou, B., Zhang, Q., and Jin, X. (2022). “Parameter optimization and SSR mitigation of DFIG considering PLL,” in 2022 Power System and Green Energy Conference (PSGEC), 430
Zhao, K., Dai, Y., Jia, Z., and Ji, Y. (2022). General fuzzy C-means clustering strategy: Using objective function to control fuzziness of clustering results. IEEE Trans. Fuzzy Syst. 30 (9), 3601–3616. doi:10.1109/tfuzz.2021.3119240
Keywords: decarbonization, sub-synchronous oscillation (SSO), equivalent modeling, multi-parameter coupling optimization, DFIG-based wind farm
Citation: Zhang Q, Jin X, Zhang F, Yuan H and Zhou B (2023) Equivalent modeling and multi-parameter coupling optimization for DFIG-based wind farms considering SSO mode. Front. Energy Res. 10:1097185. doi: 10.3389/fenrg.2022.1097185
Received: 13 November 2022; Accepted: 17 November 2022;
Published: 18 January 2023.
Edited by:
Wei Gan, Cardiff University, United KingdomCopyright © 2023 Zhang, Jin, Zhang, Yuan and Zhou. This is an open-access article distributed under the terms of the Creative Commons Attribution License (CC BY). The use, distribution or reproduction in other forums is permitted, provided the original author(s) and the copyright owner(s) are credited and that the original publication in this journal is cited, in accordance with accepted academic practice. No use, distribution or reproduction is permitted which does not comply with these terms.
*Correspondence: Qian Zhang, emhhbmdxaWFuQGNxdS5lZHUuY24=