 Handong Qi1
 Wei Li
 Leilei Ji
94% of researchers rate our articles as excellent or good
Learn more about the work of our research integrity team to safeguard the quality of each article we publish.
Find out more
ORIGINAL RESEARCH article
Front. Energy Res., 04 January 2023
Sec. Process and Energy Systems Engineering
Volume 10 - 2022 | https://doi.org/10.3389/fenrg.2022.1094717
This article is part of the Research TopicOptimal Design and Efficiency Improvement of Fluid Machinery and SystemsView all 18 articles
Centrifugal pumps are frequently utilized in general machinery, but they have issues with low efficiency, unstable operation, and high-power consumption in actual engineering, making performance improvements necessary. In this paper, the particle swarm algorithm is utilized to find the optimal solution among the Pareto front solutions and obtain the most suitable impeller for the centrifugal pump with the lowest entropy generation and highest efficiency as the optimization objectives. Based on the entropy generation theory, the energy losses of the original model and the optimized model are compared and analyzed. The results show that the centrifugal pump impeller and volute are the two areas with the largest entropy generation ratio, the optimized centrifugal pump entropy generation decreases by 5.41%, and the efficiency increases by 3.89%. Turbulent entropy generation and wall entropy generation are the important causes of hydraulic losses. Most of the losses within the impeller occur mainly at leading edge and trailing edge of blade. As the flow rate increases, the closer the distribution of the high entropy generation rate at the front cover of the impeller, the more serious the flow losses. This paper can provide a theoretical reference for the performance optimization of centrifugal pumps.
As a general fluid machinery and equipment, centrifugal pumps are widely utilized in petrochemical, nuclear power, irrigation, urban water supply, heating systems, and other fields. With the deepening research in the field of blade pumps, the optimization and numerical calculation of blade pumps such as mixed-flow pumps and centrifugal pumps have become a key direction of current research (Li et al., 2016a; Li et al., 2021; Li et al., 2020; Ji et al., 2021; Jaluria, 2009). At present, centrifugal pumps generally have low efficiency, unsafe operation, high power consumption, and other problems. Therefore, improving centrifugal pumps’ operational stability, efficiency, and service life is of great importance to energy efficiency and response to global carbon neutrality targets (Cong et al., 2015; Pei, Yi, Yuan, Wang, Wang, 2017).
In recent years, many researchers have devoted themselves to studying the relationship between energy loss and entropy generation in the internal flow of fluid machinery and have obtained specific research results (Jiang et al., 2011; Fan et al., 2022; Lai et al., 2022; Zhang and Tang, 2022). Entropy generation theory is a method of calculating energy loss in a practical process based on the second law of thermodynamics, which is combined with heat transfer theory and fluid mechanics (Saha and Mahanta, 2001; Chen, 2012). Gong et al. (2013) analyzed the energy loss in hydraulic turbines and found that the entropy generation analysis method has the advantage of determining the amount of energy dissipation and the location of dissipation. Li et al. (2016b) combined the velocity distribution and entropy generation theory to study the hydraulic loss distribution in centrifugal pumps and found that the entropy generation rate changed with the decrease in flow rate. Ahmed et al. (2016) conducted a numerical study of incompressible viscous flow around the blades to investigate the entropy generation characteristics of turbine blades under oscillatory flow conditions. Hou et al. (2016) investigated the magnitude and location of irreversible energy losses in a two-stage LNG cryogenic submersible pump based on the entropy generation theory to find that the entropy generation theory is advantageous for evaluating the energy characteristics of LNG pumps. Li et al. (2017) utilized the entropy generation theory to obtain the variation law of hydraulic loss distribution and entropy generation of hydraulic turbines in pump mode. Li et al. (2018) utilized the local flow analysis method to study the relationship between the vacuole distribution and entropy generation. Ji et al. (Ji et al., 2020a; Ji et al., 2020b) utilized the entropy generation theory to study the relationship between internal energy loss and the size of the impeller clearance in mixed-flow pumps. The results show that the increase in the impeller tip clearance may cause an increase in the energy loss within the impeller. Zhang et al. (2018) found that the losses by direct dissipation were much smaller than by turbulent dissipation within a single-stage side-runner pump based on the entropy generation theory. Yang et al. (2019) utilized entropy generation theory to correct for wall effects in turbine pumps and to evaluate energy losses in pumps as well as entropy generation analysis of components to point out the effect of timing effects on pump performance. Majeed et al. (2019) utilized entropy generation theory to study turbulent dissipation in centrifugal pumps to select the location of optimized losses. Hou et al. (2019) optimize the design of an ultra-low specific speed centrifugal pump based on entropy generation theory and orthogonal design, in which the efficiency is improved and the entropy generation value is reduced. Chang et al. (2019) use entropy generation theory to investigate the type, size, and location of hydraulic losses in centrifugal pumps at different blade thicknesses. Qian et al. (2019) studied the internal flow of centrifugal pumps from energy distribution and entropy generation to find that entropy generation analysis could provide a basis for improving pump efficiency from another perspective. Lu et al. (2019) analyzed the internal flow state by the distribution of entropy generation in the pump-turbine and obtained the vortex generation mechanism. Mohammad et al. (2020) pointed out the advantages of entropy generation theory in determining the exact location and quantity of energy dissipation in PAT. Ren et al. (2021) and Guan et al. (2020) utilized entropy generation theory and the Q-criterion to investigate and analyze the hydraulic losses of over-flow components within centrifugal pumps. The entropy production theory can describe the system work loss, the optimization goal that reduces entropy production is to minimize the system work loss, while the whole system has a maximum working ability. Therefore, it can be used as an indicator and method to evaluate pump performance improvement.
Undeniably, numerous scholars have extensively and deeply investigated pump optimization. However, centrifugal optimization based on entropy generation theory and particle swarm optimization (PSO) still needs further study. Therefore, based on previous research, this paper carried out research on the above-mentioned, and the results can provide a theoretical reference for improving the centrifugal pump stability. The remainder of this paper is organized as follows: in Section 2, numerical models are described. In Section 3, the centrifugal Pump Impeller has been optimized based on entropy generation theory and particle swarm optimization. In Section 4, the energy losses of the original and optimized models are compared and analyzed based on the entropy generation theory.
The research object is the centrifugal pump developed by Jiangsu University. It uses Creo software for 3D modeling and adds inlet extensions and outlet extensions respectively to better match the actual flow conditions. Its components include an inlet pipe, front cavity, impeller, volute, back cavity, and outlet pipe, as shown in Figure 1. The main performance parameters of the model pump are shown in Table 1.
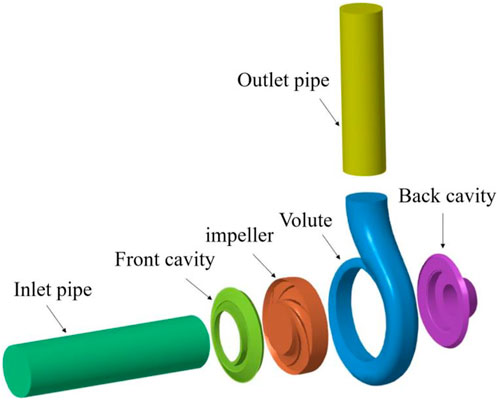
FIGURE 1. Centrifugal pump 3D model.
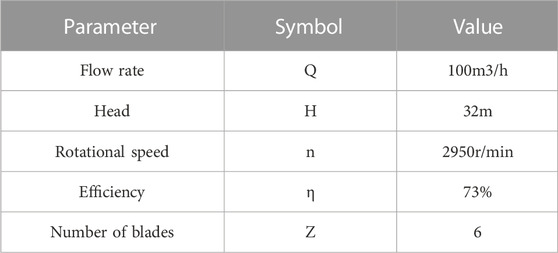
TABLE 1. Essential parameters of the Centrifugal pump
The accuracy of the numerical results and the rate of convergence directly depend on the quality of the mesh, the quantity of meshes, and the division of the mesh. Turbogrid is used for the unstructured hexahedral meshing of the impeller, and ICEM is used for the structured hexahedral meshing of the volute, front and rear chambers, and inlet and outlet pipes respectively. In addition, to ensure that the turbulence model has y + requirements for the near-wall surface, the mesh at the near-wall surface of the overflow components is locally encrypted. Finally, each overflow component has then assembled. The components are then assembled. Figure 2 shows the meshing of the centrifugal pump.
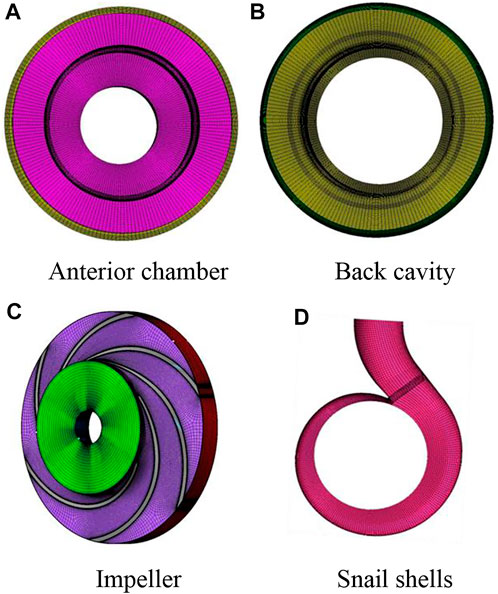
FIGURE 2. Centrifugal pump meshing.(A) Anterior chamber, (B) Back cavity, (C) Impeller, (D) Snail shells
SST k-ω model combines the advantages of standard k-ε model and k-ω model to simulate the flow well. The application of k-ω model in the near wall region can well predict the adverse pressure gradient in the boundary layer, and the use of k-ε model in the far field region. SST k-ω model makes the main shortcomings of Wilcox turbulence model to be greatly resolved. It is also recognized as a more accurate model for turbulence simulation in the field of rotating machinery. Its relevant equations are as follows:
The calculation of Reynolds stresses in the model is based on the Bossiness assumptions:
where the turbulent kinetic energy viscosity vt is defined as
where F1 and F2 are mixing functions; k is the turbulent kinetic energy, m2/s2;
The calculation area in the numerical calculation is divided into two settings: stationary area and rotating domain, the rotating domain is set for the impeller domain of the centrifugal pump, the other over-flow components are stationary domain, the interface of the volute and the inlet and outlet sections connected to the impeller is set for the dynamic static interface, the rest interface is static-static interface. The boundary conditions of the wall are an adiabatic and non-slip wall. The calculation domain reference pressure is set to 1 atm, the inlet boundary condition is the mass flow inlet with a value of 27.7278 kg/s and the outlet boundary condition is the pressure outlet. Considering the accuracy of the results, the convergence accuracy is set to 10–5 and the number of iteration steps is 1000.
In addition to the grid quality, the overall grid amount also significantly affects the calculation’s speed and accuracy. The right grid amount must be chosen for numerical calculations since a bigger grid quantity would lengthen calculation times and cost more in calculation resources while increasing calculation accuracy. Under the condition that the quality of the grid remains unchanged, five structural grid calculation schemes with different grid quantities are obtained by adjusting the number of grid nodes of the same topology. The same calculation conditions are set for the five different numbers of calculated model meshes and the pump head and efficiency are used as reference standards for comparison, and the results are shown in Figure 3. When the overall grid number of the model is greater than 3.35 million, the calculated head and efficiency do not vary much and tend to be stable, and the calculation error is less than 1%, which meets the requirements of the grid irrelevance test. Therefore, considering the calculation accuracy and the limitation of calculation resources, the overall grid number of 3.35 million is chosen for the subsequent numerical calculation.
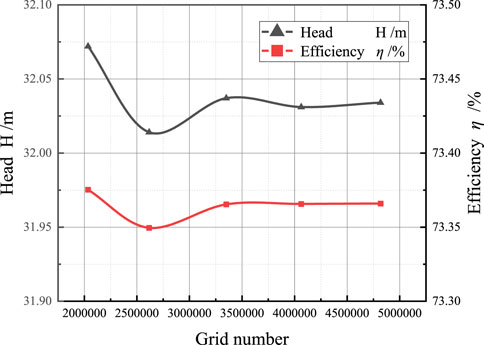
FIGURE 3. Grid independence verification.
To verify the accuracy of the numerical results, the prototype centrifugal pump is tested under the same flow conditions, and the test diagram is shown in Figure 4. The parameters of the measuring instrument are: power less than or equal to 400kW, pressure range from −0.1 MPa to 6.8 MPa, flow rate range from 0 m3/h to 10000 m3/h and total uncertainty of the measured value is 0.68%.
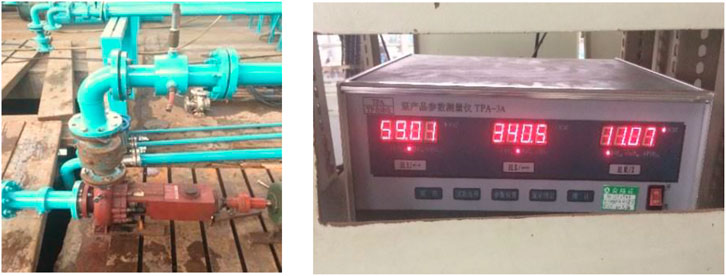
FIGURE 4. Real scenery of the performance test.
Figure 5 shows the comparison of the results obtained by the simulation and the experiment. As can be seen from the figure, the numerically calculated head and efficiency are slightly lower than the experimental values, with a maximum error of 3.89% and a minimum error of 1.65% for the head and a maximum error of 3.46% and a minimum error of 0.63% for the efficiency, both of which are within 5% of the error range, and the numerical simulation results are in high agreement with the experimental results.
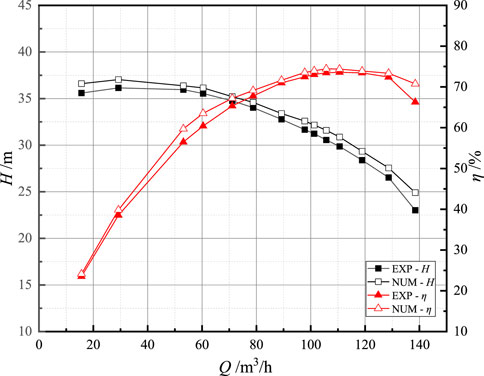
FIGURE 5. Comparison between numerical calculation value and test value.
The entropy generation theory based on the second law of thermodynamics can be used to evaluate the energy loss in centrifugal pumps, including the direct dissipation entropy generation
Direct dissipation entropy generation:
Turbulent dissipative entropy generation:
Wall entropy generation:
Where
Therefore, the entropy generation in the mainstream zone is:
Integral of each entropy generation in the corresponding region:
As a result, the total entropy generation in the computational domain is:
Researchers solve multi-objective optimization problems mainly by transforming multi-objective optimization problems into single-objective optimization problems. However, when setting the weight of a single objective, it is often the weight set by the researchers themselves, which cannot accurately describe the optimization objectives. Therefore, many intelligent optimization algorithms have emerged for multi-objective optimization problems. At present, PSO (Bashiri et al., 2019) and genetic algorithm (GA) (Şahin et al., 2011; Zhou et al., 2012) are widely used. Because the search of each bird in PSO is directional, and the mutation in GA is random. To some extent, PSO is more efficient than GA. Therefore, this paper selects the PSO algorithm as the research.
Eberhart and Kennedy et al. (1995) proposed the PSO algorithm based on the evolutionary algorithm, and it is a simplified model inspired by the predatory behavior of bird flocks. The basic idea of PSO is that individuals in a swarm pass information to each other, collaborate, and then find the optimal solution through iteration. Each individual in the solution space is referred to as a particle, and the individual is the solution in each optimization problem (Jordehi, 2015; Tang et al., 2021; Jain et al., 2022). The particle is given two properties: position and velocity. Moreover, the velocity and position of the particle are updated in the solution space according to the following equations.
where i = 1, 2, …, N, N is the total number of particles; ω is the inertia factor, taking the value of 0.9; vi is the particle velocity; rand () is a random number between 0 and 1; xi is the current particle position; c1, c2 are the learning factors, taking the value of 2.
In engineering application problems, there are often two or more objectives to be optimized, and in most cases, it is difficult to optimize all sub-objectives. Due to the contradictory relationship between each objective, when dealing with multi-objective optimization problems, it is necessary to make appropriate ' concessions ' for each sub-objective, to achieve overall consideration. A multi-objective optimization problem can be defined as:
Let D be the feasible region of the above multi-objective optimization problem:
In this paper, the first optimization objective of multi-objective optimization is to reduce the entropy production rate, and the second objective is to improve the efficiency of the centrifugal pump and meet the head as a constraint condition.
The multi-objective optimization of the approximate model is carried out by the particle swarm algorithm. The final Pareto solution set is obtained as shown in Figure 6. The figure depicts the efficiency as the horizontal coordinate and the entropy generation value as the vertical coordinate, corresponding to the maximum efficiency and the minimum entropy generation value of the optimization target. Respectively, and the points in the figure represent each optimization sample, and the points on the red line are the Pareto front distribution. The minimum entropy generation value. From this line, an optimization sample is selected as the final optimization solution, and the optimization model is determined.
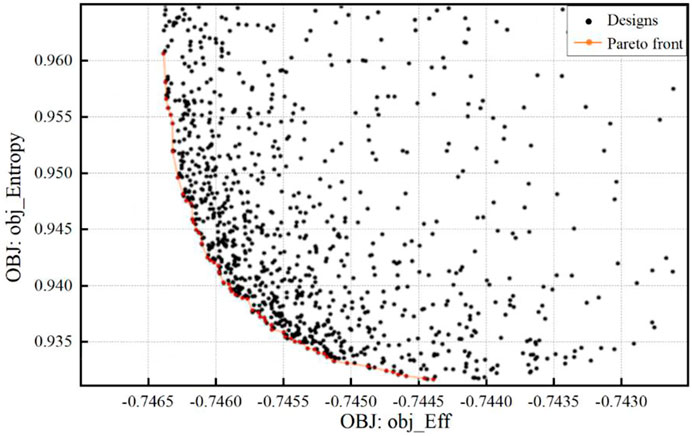
FIGURE 6. Pareto solution set.
After optimization by the particle swarm algorithm, a solution is found in the Pareto front solution that satisfied the head constraint, had a reduced entropy generation value, and had an increased efficiency value. The comparison of the parameters before and after optimization is shown in Table 2. As shown in the table, the optimized blades have no significant change in the blade inlet angle at the back cover (θ1), the blade outlet angle at the back cover (θ2) is increasing, the blade inlet angle at the back cover (θ3) has increased the most, the blade outlet angle at the front cover (θ4) has decreased and the wrap angle value (wrap) has decreased. Overall, the entropy value of the optimized centrifugal pump has decreased by 5.41% and the efficiency value has increased by 3.89%. The blade model of the centrifugal pump before and after optimization is shown in Figure 7.
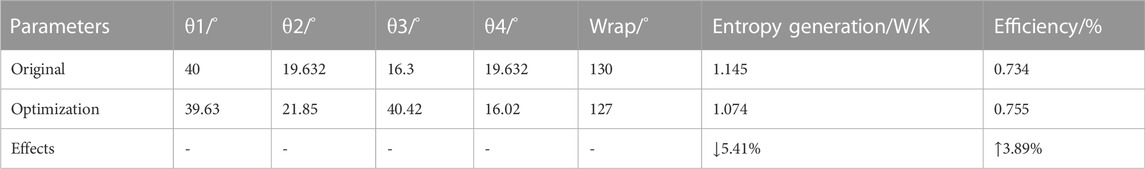
TABLE 2. Comparison of parameters before and after optimization.
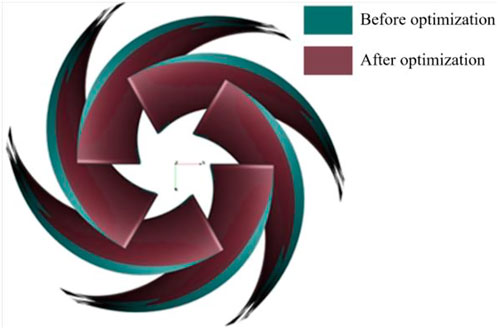
FIGURE 7. 3D drawing of impeller before and after optimization.
Table 3 shows the comparison of the entropy generation values of the different types of entropy within the centrifugal pump before and after optimization at rated operating conditions. As can be seen from the table, the total entropy generation value is reduced after optimization by 0.2153 W/K, and the losses are reduced by 2.8%, indicating that the flow performance of the optimized centrifugal pump has been improved. The value of the different types of entropy generation changed before and after the optimization, except for the direct entropy generation utilized by the time-averaged pulsation, which increases after the optimization, the turbulent entropy generation and the wall entropy generation decrease by 0.184 W/K and 0.0451 W/K respectively, and the losses decrease by 6.3% and 6.4% respectively. It can be seen that entropy generation due to turbulent dissipation and entropy generation to wall dissipation are optimized best, with both entropy generation values reduced by more than 6%.
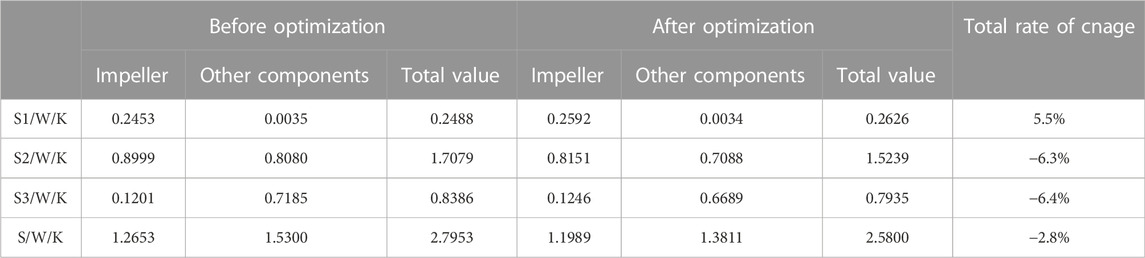
TABLE 3. Comparison of entropy generation value before and after optimization under rated working conditions.
Figure 8 shows the contour of the distribution of the different types of entropy generation on the blade at rated operating conditions. From the figure, it can be seen that the entropy generation values of each type are not in the same order of magnitude, the wall entropy generation level is much smaller than the direct entropy generation and turbulent entropy generation. While the direct entropy generation value is smaller than the turbulent entropy generation, the entropy generation is mainly distributed at the blade’s leading edge and trailing edge, which may be due to impact loss at the inlet and the existence of a jet wake at the outlet. The direct entropy generation is mainly distributed at the blade’s leading edge, and the turbulent entropy generation is mainly distributed at the leading edge against the tip of the blade. Then the wall entropy generation is mainly distributed at the leading and trailing edges of the blade.
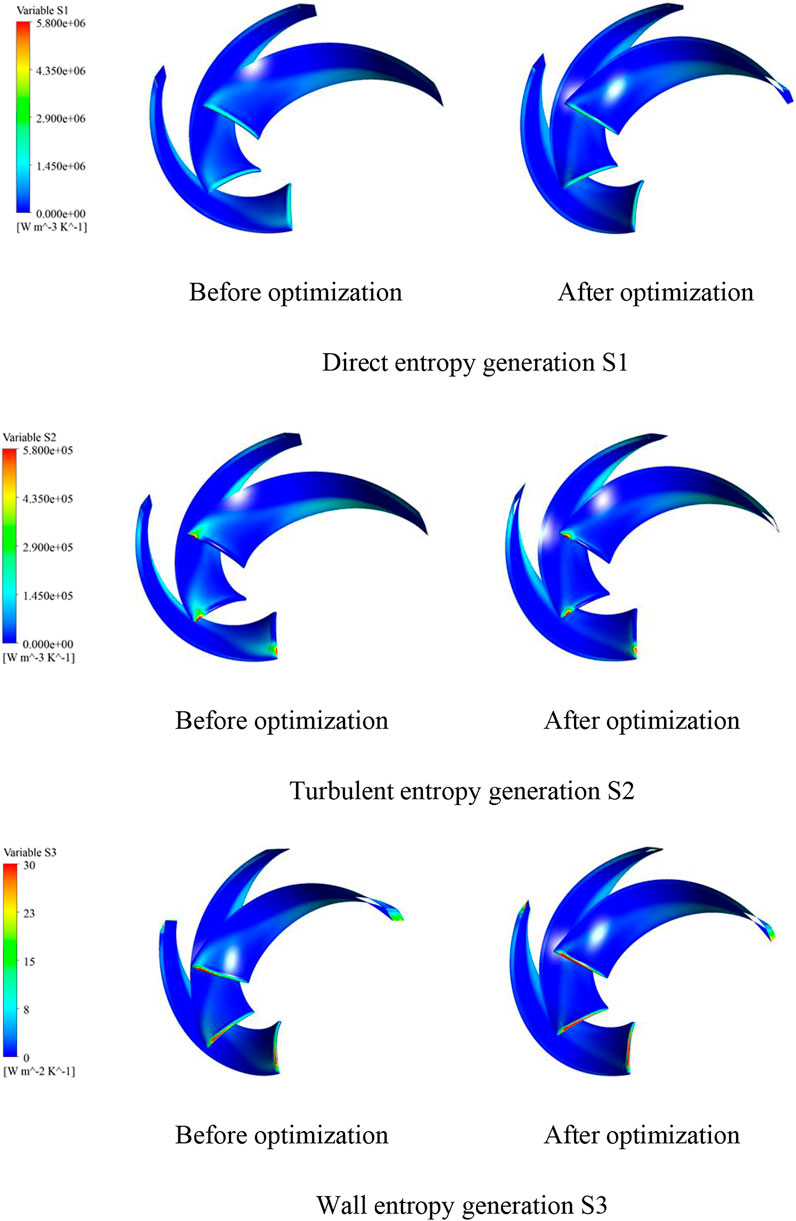
FIGURE 8. Different types of entropy generation cloud map.
To further analyze the trend of irreversible losses in the centrifugal pump before and after optimization, Figure 9 shows the variation of different types of entropy generation values with flow rate. It can be seen from the figure that the direct entropy generation value of the optimized model is larger than before, indicating that parameter optimization is not effective in optimizing the entropy generation of this category, while on the contrary, turbulent entropy generation and wall entropy generation both decrease; Both before and after optimization, the direct entropy generation value is positively proportional to the flow rate, and the entropy generation value increases as the flow rate increases. At low flow rates, the entropy generation due to turbulent dissipation decreases more rapidly and then increases slowly after rated operating conditions; the entropy generation to wall friction decreases slowly and then starts to increase rapidly after rated operating conditions.
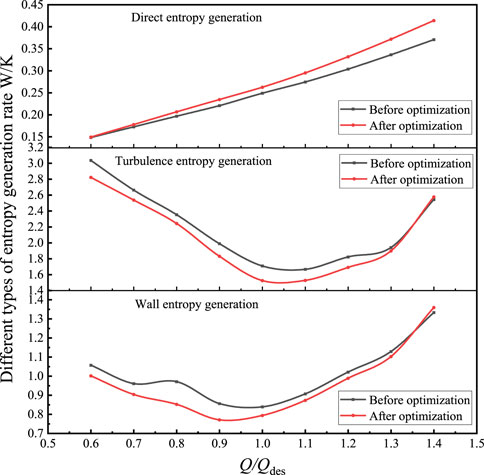
FIGURE 9. Comparison of different types of entropy generation in centrifugal pump before and after optimization.
Figure 10 shows the ratio of the different types of entropy generation to the total entropy generation before and after optimization. The histogram shows more clearly that turbulent losses due to turbulent dissipation in the impeller account for the largest proportion, followed by wall losses due to wall friction. Finally, direct dissipation is due to time averaging. Comparing Figure 10A and Figure 10B, the trend of the different types of entropy generation to total entropy generation ratio before and after optimization is the same. In summary, the turbulent entropy generation and wall entropy generation of the impeller of the centrifugal pump are optimized to a certain extent after the optimization, and the overall pump performance is improved.
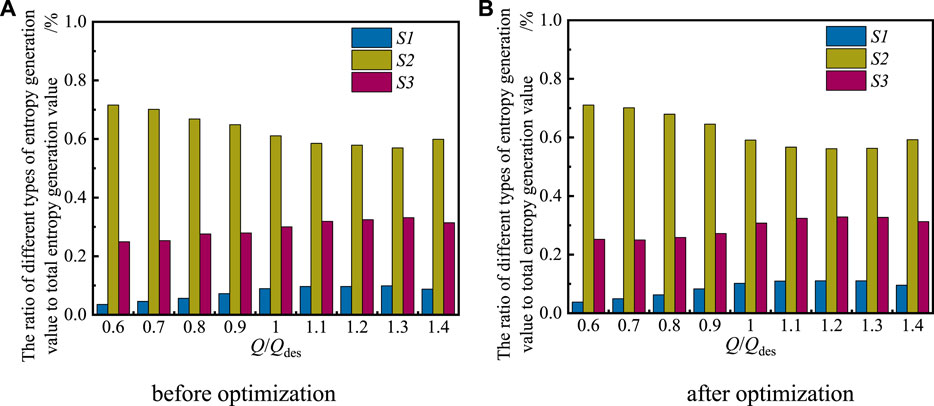
FIGURE 10. Ratio of different types of entropy generation to total entropy generation before and after optimization.(A) before optimization (B) after optimization.
To investigate the relationship between the irreversible losses utilized by entropy generation and the flow rate in the centrifugal pump, CFX simulation software is utilized to numerically simulate the flow conditions from 0.6Qdes to 1.4Qdes, and the total entropy generation value with a flow rate in the centrifugal pump is obtained as shown in Figure 11. As can be seen from the graph, the changing pattern of the relationship graph before and after the optimization is the same, the total entropy output is first falling and then rises when the flow rate from 0.6Qdes to the rated condition 1.0Qdes, the total entropy output value in the pump is rapidly decreasing, when the flow rate from 1.0Qdes to 1.4Qdes, the total entropy output value is increasing. The total entropy output decreases after optimization, especially from the small flow rate to the design condition. Then the total entropy generation value before and after optimization is the smallest at 1.0Qdes, which is consistent with the internal flow field flow of the centrifugal pump and further illustrates that the hydraulic performance of the centrifugal pump is related to the stability of the internal flow field flow.

FIGURE 11. Total entropy generation value under different flows before and after optimization.(A) before optimization (B) after optimization.
Figure 12 shows the entropy generation values of each overflow component in the centrifugal pump under different operating conditions before and after optimization. It is seen from the figure that the entropy generation in the inlet section, impeller, and volute are relatively large at a low flow rate. In contrast, the entropy generation value for the outlet section is smaller. The value of the inlet section decreases under rated conditions, while the value of the outlet section increases. However, the impeller and volute are always the larger sections, with the entropy generation value of the impeller increasing slowly and the volute entropy generation value decreasing and then increasing. Figure 12B shows the entropy generation generated in each overflow component within the optimized centrifugal pump. Comparing Figure 12A; Figure 12B, the development of entropy generation in each overflow component with operating conditions after optimization is similar to that before optimization. At the rated condition, the optimized impeller entropy generation is smaller, indicating a significant improvement in the optimization effect because of the reduction in turbulence entropy generation and wall entropy generation. The optimized impeller design significantly reduces the entropy generation value within the entire centrifugal pump, thereby reducing the hydraulic losses.

FIGURE 12. Entropy generation distribution of components under different working conditions.(A) before optimization (B) after optimization.
Figure 13 shows the velocity streamwise in the impeller runners before and after optimization. From the figure, it can be seen that the velocity streamlines in the different runners of the impeller are distributed differently, and the swirls occurring mainly in the middle of the runner before optimization. Under the same conditions, there are fewer swirls in the impeller runners after optimization, which means that the flow losses are smaller. According to existing research (Zhu, 2019), it is known that the vortex has a large turbulent kinetic energy, which leads to an increase in the entropy value utilized by turbulent dissipation in the passage. It can be deduced that where vortices occur, hydraulic losses are generated and that the hydraulic losses in the passage are mainly due to turbulent dissipation.

FIGURE 13. Velocity streamline diagram in impeller under different working conditions before and after optimization.(A) before optimization (B) after optimization.
Figure 14 shows the contour of the distribution of entropy generation value on the blades of the centrifugal pump before and after optimization under different operating conditions. As seen above, the entropy generation value produced by the impeller and the entropy generation value produced by the volute are similar; both account for a larger proportion of centrifugal pumps. As shown in the figure, the blade on the entropy generation value increases with the flow rate increase. Moreover, the occupied area in the spread, especially the blade suction surface high entropy generation area from the initial blade leading edge to the blade trailing edge development. In the leading edge, there is a high entropy generation area, which may be due to the inlet’s easy to produce a large number of vortex and backflow phenomena, resulting in energy loss, appear a high entropy generation area. As the flow rate increases, the impact loss of the fluid at the leading edge of the blade intensifies, resulting in a further deterioration of the energy loss from the leading edge of the blade to the middle of the blade. Under high flow conditions, the entropy generation loss in the impeller passage is higher under the dual action of high velocity and gravity. A high entropy generation region is formed at the edge of the blade suction surface. Comparing the entropy generation distribution before and after optimization, the high entropy generation region is significantly reduced, indicating that the flow conditions at the impeller inlet and in the runner are effectively improved and the losses are reduced.
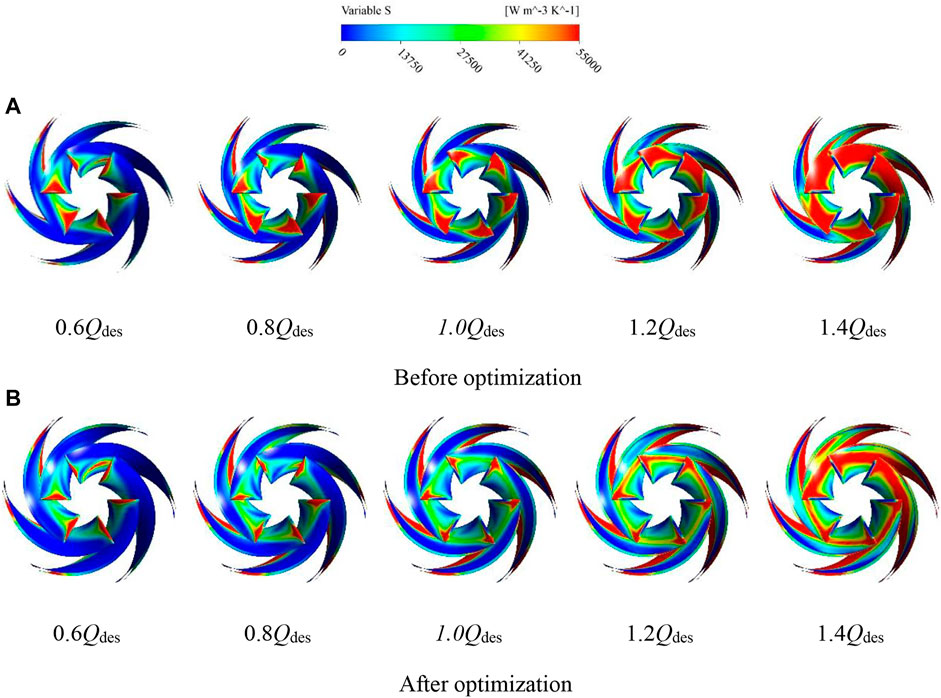
FIGURE 14. Distribution of blade entropy generation under different working conditions before and after optimization.(A) before optimization (B) after optimization.
To further analyze the distribution of entropy generation values in the volute, Figure 15 shows the distribution of entropy generation in the middle section of the volute of the centrifugal pump before and after optimization under different operating conditions. It can be seen from the graph that the entropy generation in the volute is mainly distributed at the volute inlet, the volute outlet, and the volute wall surface. As the flow rate increases from 0.6Qdes to 1.0 Qdes, the entropy generation distribution in the volute gradually decreases. As the flow rate increases from 1.0 Qdes to 1.4 Qdes, the entropy generation distribution in the volute gradually increases. The entropy generation in the volute section is minimized at the design flow rate. It is found that at 1.0 Qdes, the change in entropy generation in the volute is not significant before and after the optimization, because there are no obvious changes at the blade trailing edge. While the distribution of entropy generation of turbulent flow in the volute is reduced at the rest of the flow rate.
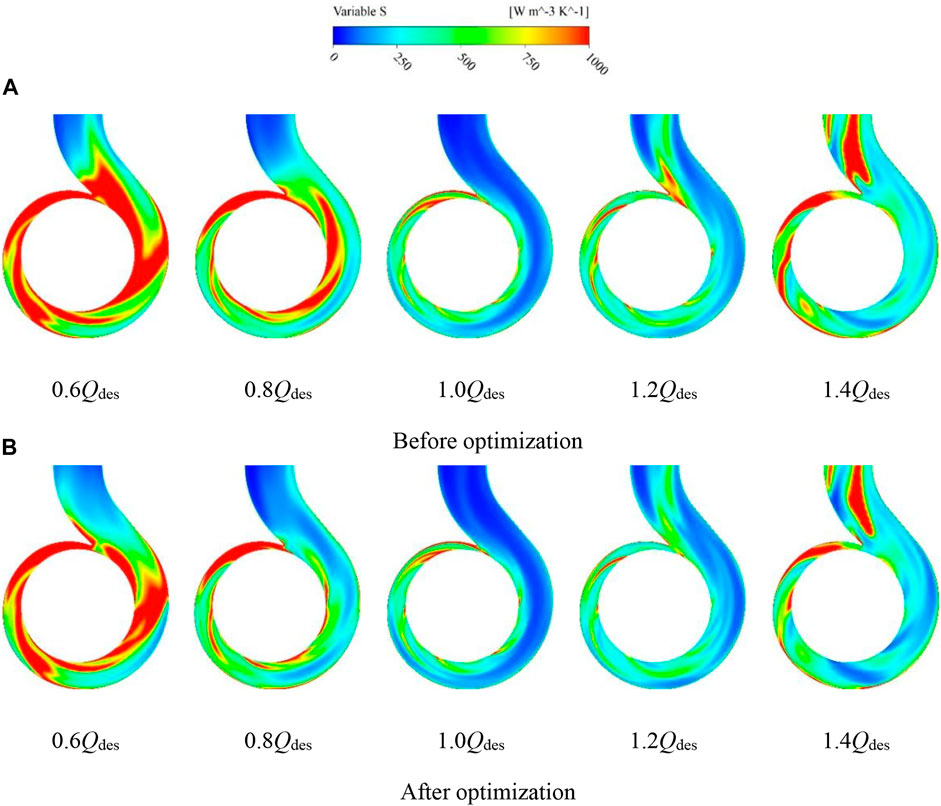
FIGURE 15. Entropy generation of volute cross-section at different working conditions before and after optimization.(A) before optimization (B) after optimization.
As can be seen from the previous section, the over-flow component with the high entropy generation within the centrifugal pump is the impeller and the main over-flow component to be optimized is also the impeller, so an in-depth analysis of this component is necessary to determine the main cause of irreversible losses within the pump passage. Figure 16 shows the display of different cross-sections of the impeller. Three different cross-sections within the impeller runner are defined in the post-processing step, span 0.1 near the back cover plate, span 0.5 in the middle runner section of the impeller, and span 0.9 near the front cover plate.
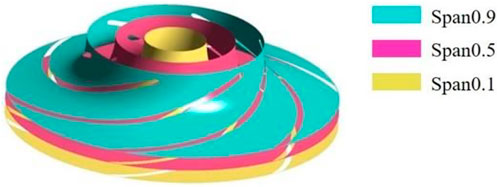
FIGURE 16. Different section display.
Figure 17 shows the contour of total entropy yield distribution for each section of the impeller before and after optimization. Figure 17A shows the cross-section near the rear cover plate, where the high entropy generation is distributed in the middle and rear part of the blade suction surface at low flow rate conditions and moves towards the trailing edge of the blade as the flow rate increases until it disappears. At a flow rate of 1.0Qdes, comparing the entropy generation distribution on the span0.1 cross-section before and after optimization, the entropy generation after optimization is significantly lower than that before optimization, indicating that the flow condition in the impeller runner after optimization has improved and the hydraulic loss has been reduced. As seen from the contour of the entropy generation distribution in the middle section of the impeller in Figure 17B, the high entropy generation is mainly distributed at the impeller inlet, blade suction surface, and impeller outlet, and the loss in the impeller runner decreases as the flow rate increases. The optimized total entropy generation is the smallest at the nominal operating condition of 1.0 Qdes. Figure 17C shows the cross-section near the front cover of the impeller where the entropy generation increases with increasing flow rate. At low flow rates, the high entropy generations are mainly at the impeller inlet and the impeller outlet, and as the flow rate increases, the entropy generations spread from the blade pressure into the impeller outlet. In general, the closer to the front cover the higher the distribution of high entropy generation, and the more serious the flow losses.
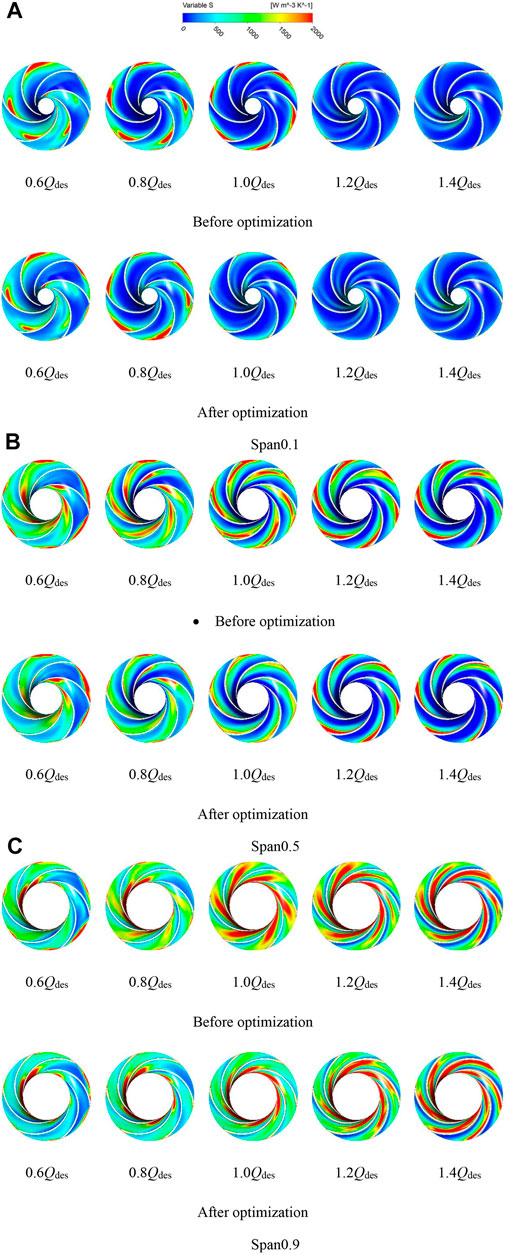
FIGURE 17. Entropy generation clouds of different sections before and after optimization.(A) Span0.1, (B) Span0.5, (C) Span0.9.
In the present paper, the centrifugal pump impeller carries out optimization by combining entropy generation theory and particle swarm optimization. The energy losses of the original and optimized models are compared and analyzed. The following major conclusions have been drawn from the present study.
1) The result of optimization indicates that the entropy generation of the centrifugal pump is reduced by 5.41%, and the efficiency is increased by 3.89%. The numerical calculation value and experimental value of centrifugal pump performance are within the error range, indicating that the numerical simulation can well reflect the real flow of the internal flow field of the centrifugal pump.
2) Comparing the different types of entropy generation before and after optimization, it is found that the entropy generation utilized by turbulent dissipation and the entropy generation utilized by wall dissipation are optimized to be the most effective, with both entropy generation values reduced by more than 6%. Turbulent entropy generation and wall entropy generation are the important causes of hydraulic losses. Most of the losses within the impeller occur mainly at the blade’s leading edge and the blade’s trailing edge.
3) The total entropy generation value at the rated operating condition is the smallest, which further illustrates that the centrifugal pump operating away from the design conditions will lead to increased fluid instability in the pump, resulting in a decline in hydraulic performance. Optimizing the impeller of the centrifugal pump significantly reduces the internal flow loss and improves its efficiency of the centrifugal pump.
4) At low flow rates, the high entropy generations are mainly at the impeller inlet and the impeller outlet. The closer to the front cover the higher the distribution of high entropy generation, and the more serious the flow losses. The optimization content studied in this article can provide support for the optimization theory of centrifugal pump. At the same time, it provides a new idea for the optimization of rotating machinery such as the mixed-flow pump.
The raw data supporting the conclusions of this article will be made available by the authors, without undue reservation.
Conceptualization: HQ; Methodology: HQ, WL; Formal analysis: HQ, LJ; Investigation: HQ, RS, and ML; Writing–original draft preparation: HQ, WL; Writing–review and editing: HQ, WL, and LJ; Supervision: HQ, YY, and YP.
The work was sponsored by the Key International Cooperative research of National Natural Science Foundation of China (No.52120105010), National Natural Science Foundation of China (No.52179085), the National Key R&D Program Project (No.2020YFC1512405), China Postdoctoral Science Foundation (No.2022TQ0127), the Fifth “333 High Level Talented Person Cultivating Project” of Jiangsu Province, Funded projects of “Blue Project” in Jiangsu Colleges and Universities, “Belt and Road” Innovation Cooperation Project of iangsu Province (No.BZ2020068), Independent Innovation Fund Project of Agricultural Science and Technology in Jiangsu Province (No.CX(20)2037), Open Research Subject of Key Laboratory of Fluid and Power Machinery (Xihua University), Ministry of Education (LTDL-2022010).
The authors declare that the research was conducted in the absence of any commercial or financial relationships that could be construed as a potential conflict of interest.
All claims expressed in this article are solely those of the authors and do not necessarily represent those of their affiliated organizations, or those of the publisher, the editors and the reviewers. Any product that may be evaluated in this article, or claim that may be made by its manufacturer, is not guaranteed or endorsed by the publisher.
Ahmed, S., Khalid, M., Qing, X., Shehadeh, M. F., and Day, A. (2016). Performance analysis of wells turbine blades using the entropy generation minimization method. Renew. Energy 86, 1123–1133. doi:10.1016/j.renene.2015.09.045
Bashiri, M., Derakhshan, S., and Shahrabi, J. (2019). Design optimization of a centrifugal pump using particle swarm optimization algorithm. Int. J. Fluid Mach. Syst. 12 (4), 322–331. doi:10.5293/ijfms.2019.12.4.322
Chang, H., Shi, W., Li, W., and Liu, J. (2019). Energy loss analysis of novel self-priming pump based on the entropy production theory. J. Therm. Sci. 28 (2), 306–318. doi:10.1007/s11630-018-1057-5
Chen, L. G. (2012). Progress in entransy theory and its applications. Chin. Sci. Bull. 57 (34), 4404–4426. doi:10.1007/s11434-012-5477-4
Cong, X., Zhou, R., Han, Y., Zhang, F., and Chen, L. (2015). Optimization design of deep-well centrifugal pump based on CFX orthogonal test [J]. Fluid Mach. 43 (9), 22–25.
Eberhart, R., and Kennedy, J. (1995). IEEE, 39–43.A new optimizer using particle swarm theory MHS'95, Proceedings of the sixth international symposium on micro machine and human science, Beijing China, June 1995
Fan, B., Liang, Z., Fan, R., and Chen, S. (2022). Numerical study on entropy generation of the multi-stage centrifugal pump. Entropy 24 (7), 923. doi:10.3390/e24070923
Gong, R., Wang, H., Chen, L., Li, D., Zhang, H., and Wei, X. (2013). Application of entropy production theory to hydro-turbine hydraulic analysis. Sci. China Technol. Sci. 56 (7), 1636–1643. doi:10.1007/s11431-013-5229-y
Guan, H., Jiang, W., Yang, J., Wang, Y., Zhao, X., and Wang, J. (2020). Energy loss analysis of the double-suction centrifugal pump under different flow rates based on entropy production theory. Proc. Institution Mech. Eng. Part C J. Mech. Eng. Sci. 234 (20), 4009–4023. doi:10.1177/0954406220919795
Hou, H., Zhang, Y., Li, Z., Jiang, T., Zhang, J., and Xu, C. (2016). Numerical analysis of entropy production on a LNG cryogenic submerged pump. J. Nat. Gas Sci. Eng. 36, 87–96. doi:10.1016/j.jngse.2016.10.017
Hou, H., Zhang, Y., Zhou, X., Zuo, Z., and Chen, H. (2019). Optimal hydraulic design of an ultra-low specific speed centrifugal pump based on the local entropy production theory. Proc. Institution Mech. Eng. Part A J. Power Energy 233 (6), 715–726. doi:10.1177/0957650918825408
Jain, M., Saihjpal, V., Singh, N., and Singh, S. B. (2022). An overview of variants and advancements of PSO algorithm. Appl. Sci. 12 (17), 8392. doi:10.3390/app12178392
Jaluria, Y. (2009). Simulation-based optimization of thermal systems. Appl. Therm. Eng. 29 (7), 1346–1355. doi:10.1016/j.applthermaleng.2008.01.008
Ji, L., Li, W., Shi, W., Chang, H., and Yang, Z. (2020). Energy characteristics of mixed-flow pump under different tip clearances based on entropy production analysis. Energy 199–117447. doi:10.1016/j.energy.2020.117447
Ji, L., Li, W., Shi, W., Tian, F., and Agarwal, R. (2020). Diagnosis of internal energy characteristics of mixed-flow pump within stall region based on entropy production analysis model. Int. Commun. Heat Mass Transf. 117–104784. doi:10.1016/j.icheatmasstransfer.2020.104784
Ji, L., Li, W., Shi, W., Tian, F., and Agarwal, R. (2021). Effect of blade thickness on rotating stall of mixed-flow pump using entropy generation analysis. Energy 236–121381. doi:10.1016/j.energy.2021.121381
Jiang, J., Wang, R., Pezeril, M., and Wang, Q. A. (2011). Application of varentropy as a measure of probabilistic uncertainty for complex networks. Chin. Sci. Bull. 56 (34), 3677–3682. doi:10.1007/s11434-011-4697-3
Jordehi, A. R. (2015). A review on constraint handling strategies in particle swarm optimisation. Neural Comput. Applic. 26 (6), 1265–1275. doi:10.1007/s00521-014-1808-5
Lai, F., Huang, M., Wu, X., Nie, C., and Li, G. (2022). Local entropy generation analysis for cavitation flow within a centrifugal pump. J. Fluids Eng. 144 (10)–101206. doi:10.1115/1.4054467
Li, D., Wang, H., Qin, Y., Han, L., Wei, X., and Qin, D. (2017). Entropy production analysis of hysteresis characteristic of a pump-turbine model. Energy Convers. Manag. 149, 175–191. doi:10.1016/j.enconman.2017.07.024
Li, W., Ji, L., Li, E., Shi, W., Agarwal, R., and Zhou, L. (2021). Numerical investigation of energy loss mechanism of mixed-flow pump under stall condition. Renew. Energy 167, 740–760. doi:10.1016/j.renene.2020.11.146
Li, W., Ji, L., Shi, W., Hui, C., and Jin, M. (2016). Starting characteristic of mixed-flow pump based on quasi-steady state assumption[J]. Trans. Chin. Soc. Agric. Eng. 32 (7), 86–92.
Li, W., Li, E., Ji, L., Zhou, L., Shi, W., and Zhu, Y. (2020). Mechanism and propagation characteristics of rotating stall in a mixed-flow pump. Renew. Energy 153, 74–92. doi:10.1016/j.renene.2020.02.003
Li, X., Jiang, Z., Zhu, Z., Si, Q., and Li, Y. (2018). Entropy generation analysis for the cavitating head-drop characteristic of a centrifugal pump. Proc. Institution Mech. Eng. Part C J. Mech. Eng. Sci. 232 (24), 4637–4646. doi:10.1177/0954406217753458
Li, X., Zhu, Z., Li, Y., and Chen, X. (2016). Experimental and numerical investigations of head-flow curve instability of a single-stage centrifugal pump with volute casing. Proc. Institution Mech. Eng. Part A J. Power Energy 230 (A7), 633–647. doi:10.1177/0957650916663326
Lu, J., Wang, L., Liao, W., Wan, N., and Zin, A. (2019). Entropy generation analysis for vortex rope of a turbine model [J]. J. Hydraulic Eng. 50 (2), 233–241.
Majeed, K., Wang, W., Yuan, J., Zhao, J., Wang, Y., and Liu, J. (2019). Flow loss analysis of a two-stage axially split centrifugal pump with double inlet under different channel designs. Proc. Institution Mech. Eng. Part C J. Mech. Eng. Sci. 233 (15), 5316–5328. doi:10.1177/0954406219843573
Mohammad, M., Mohammad, H., Ali, M., and Riasi, A. (2020). A numerical study on mechanisms of energy dissipation in a pump as turbine (PAT) using entropy generation theory. Renew. Energy 162, 1036–1053. doi:10.1016/j.renene.2020.08.102
Pei, J., Yi, T., Yuan, S., Wang, W., and Wang, J. (2017). Cavitation optimization for a centrifugal pump impeller by using orthogonal design of experiment. Chin. J. Mech. Eng. 30 (1), 103–109. doi:10.3901/cjme.2016.1024.125
Qian, B., Chen, J., Wu, P., Wu, D. z., Yan, P., and Li, S. y. (2019). Investigation on inner flow quality assessment of centrifugal pump based on Euler head and entropy production analysis. IOP Conf. Ser. Earth Environ. Sci. 240 (9)–092001. doi:10.1088/1755-1315/240/9/092001
Ren, Y., Zhu, Z., Wu, D., Chen, A., and Wing, L. (2021). Flow loss characteristics of a centrifugal pump based on entropy generation [J]. J. Harbin Eng. Univ. 42 (2), 266–272.
Saha, S. K., and Mahanta, D. K. (2001). Thermodynamic optimization of solar flat-plate collector. Renew. energy 23 (2), 181–193. doi:10.1016/s0960-1481(00)00171-3
Şahin, A. Ş., Kılıç, B., and Kılıç, U. (2011). Optimization of heat pump using fuzzy logic and genetic algorithm. Heat. Mass Transf. 47 (12), 1553–1560. doi:10.1007/s00231-011-0818-4
Tang, J., Liu, G., and Pan, Q. (2021). A review on representative swarm intelligence algorithms for solving optimization problems: Applications and trends. IEEE/CAA J. Autom. Sin. 8 (10), 1627–1643. doi:10.1109/jas.2021.1004129
Yang, B., Li, B., Chen, H., and Liu, Z. (2019). Entropy production analysis for the clocking effect between inducer and impeller in a high-speed centrifugal pump. Proc. Institution Mech. Eng. Part C J. Mech. Eng. Sci. 233 (15), 5302–5315. doi:10.1177/0954406219843946
Zhang, F., Yuan, S., Wei, X., and Zhan, B. (2018). Study on flow loss characteristics of side channel pump based on entropy production. J. Mech. Eng. 54 (22), 137–144. doi:10.3901/jme.2018.22.137
Zhang, X., and Tang, F. (2022). Energy loss evaluation of axial flow pump systems in reverse power generation operations based on entropy production theory[J]. Sci. Rep. 12 (1), 1–19.
Zhou, J. S., Zhang, S. J., and Mao, P. Z. (2012). Performance optimization based on genetic algorithm of double suction centrifugal pump. Adv. Mat. Res. 468, 2565–2568. doi:10.4028/www.scientific.net/amr.468-471.2565
Keywords: centrifugal pump, particle swarm algorithm, entropy generation analysis, numerical calculation, optimization
Citation: Qi H, Li W, Ji L, Liu M, Song R, Pan Y and Yang Y (2023) Performance optimization of centrifugal pump based on particle swarm optimization and entropy generation theory. Front. Energy Res. 10:1094717. doi: 10.3389/fenrg.2022.1094717
Received: 10 November 2022; Accepted: 05 December 2022;
Published: 04 January 2023.
Edited by:
Muhammad Wakil Shahzad, Northumbria University, United KingdomReviewed by:
Aqiang Lin, Northwestern Polytechnical University, ChinaCopyright © 2023 Qi, Li, Ji, Liu, Song, Pan and Yang. This is an open-access article distributed under the terms of the Creative Commons Attribution License (CC BY). The use, distribution or reproduction in other forums is permitted, provided the original author(s) and the copyright owner(s) are credited and that the original publication in this journal is cited, in accordance with accepted academic practice. No use, distribution or reproduction is permitted which does not comply with these terms.
*Correspondence: Wei Li, bHdqaWFuZ2RhQHVqcy5lZHUuY24=; Leilei Ji, bGVpbGVpamlAdWpzLmVkdS5jbg==
Disclaimer: All claims expressed in this article are solely those of the authors and do not necessarily represent those of their affiliated organizations, or those of the publisher, the editors and the reviewers. Any product that may be evaluated in this article or claim that may be made by its manufacturer is not guaranteed or endorsed by the publisher.
Research integrity at Frontiers
Learn more about the work of our research integrity team to safeguard the quality of each article we publish.