 Yikun Tang
 Zhiyuan Tang
 Yi Gao2
- 1College of Electrical Engineering, Sichuan University, Chengdu, Sichuan, China
- 2State Grid Tianjin Power Economics and Technology Research Institute, Tianjin, China
- 3State Grid Tianjin Electric Power Company, Tianjin, China
- 4China Electric Power Research Institute, Beijing, China
Electrical load forecasting plays a vital role in the operation of power system. In this paper, a novel adaptive short-term load forecasting method for the aggregated load is built. The proposed method consists of two stages: load forecast model preparation stage and adaptive load forecast model selection stage. In the first stage, based on historical load data of all consumers, the typical monthly load patterns are firstly identified in an optimal fashion with the aid of the cosine similarity. Then, for each identified monthly load pattern, a stacking ensemble learning method is proposed to train the load forecasting model. In the second stage, according to the similarity between individual load data of the latest month and the identified monthly load pattern, all the consumers are firstly classified into different groups where each group corresponds to a particular load pattern. Then, for each group, the corresponding trained load forecasting model is employed for short-term load forecast and the final forecast of the aggregated load is calculated as a simple aggregation of the produced load forecast for each group of consumers. Case studies conducted on open dataset show that, compared with the single forecasting model, the proposed adaptive load forecasting method can effectively improve the load forecasting accuracy.
1 Introduction
Load forecasting is an important part of the smart grid, which plays an important role in the security, stability and economic dispatch of the power system (Diamantoulakis et al., 2015). Rapid progress in the consumer-side advanced measurement system brings about a large amount of consumer-side power consumption data which has opened the possibility of designing various load forecasting methods (Stephen et al., 2017; Chaouch, 2014). The key challenge becomes how to effectively process these data and improve the consumer-side load prediction accuracy.
As mentioned above, load forecasting has always been a research hotspot due to its vital role in the operation of power systems. Many experts and scholars have done in-depth research on it, and proposed many models and algorithms. As the typical time-series forecasting algorithms, auto regression (Mbamalu and El-Hawary, 1993) and auto regression moving average (Huang and Shih, 2003) have been proposed for load forecast. Although these methods require a small amount of data for calculation and also have a fast computation speed, they are often criticized for their limited success in handling complex non-linear relationship and relatively poor learning ability. Moreover, they have high requirements for data stability which however is not the intrinsic nature of load in distribution networks.
To overcome above mentioned issues, machine learning techniques have been proposed for load forecasting, such as artificial neural network (ANN) (Hippert et al., 2001; Quan et al., 2014), support vector regression (SVR) (Tan et al., 2020a), Classification And Regression Tree (CART) (Zhong and Tam, 2015), Random Forest (RF) (Xuan et al., 2021), extreme gradient boosting (XGBoost) (Yao et al., 2022), and so on. These algorithms have been successfully applied to tackle non-linear feature fitting in load forecasting. For example, in (Guan et al., 2013), separate neural networks (NN s) are applied to wavelet decomposed filtered load data. In (Haque, 2019), a SVR based model is presented to determine the impact of HVAC set point adjustments on building-level electrical load. In (Liao, 2019), a XGBoost based model is designed to analyze the common laws of meteorological and daily types on the load. Besides the machine learning methods, deep learning is also used extensively for load forecasting due to its powerful learning ability. For example, Recurrent Neural Network (RNN) (Zhang et al., 2020) is the commonly used deep learning model for time series forecasting. In (Shi et al., 2018), a RNN based model is designed to forecast the household load forecasting, whose performance is obviously better than time-series analysis and machine learning approaches. Long Short-term Memory network (LSTM) (Tan et al., 2020b) and Gated Recurrent Unit network (GRU) (Sajjad et al., 2020) are two of variants of RNN, and can achieve better performance than RNN. In (Kumar et al., 2018), LSTM-RNN and GRU-RNN based model is applied to spark clusters, which brings better performance than RNN. In Kong et al. (2017) proved that LSTM based model is suitable, and claimed that the model can be further improved if more energy sequences are obtained. Although machine learning and deep learning approaches can process massive amounts of data and obtain better prediction results than traditional methods, they need to consume more memory and time. In addition, parameter adjustment is also one of the difficulties of machine learning and deep learning approaches.
Although the above-mentioned forecasting models have achieved great accuracy in load forecasting, there is still one critical challenge in the real-world load forecasting, i.e., the forecasting accuracy of a certain forecasting model cannot be guaranteed in all possible load patterns. This is because that the generalization ability of a certain forecasting model is usually limited so that they cannot adapt to all various load patterns with different fluctuation characteristics. Compared with the aggregated load in transmission networks, the loads in distribution networks usually have severer fluctuations and uncertainties due to its much smaller size and more random factors such as weather, holiday, working days shifting or some social activities (Fallah et al., 2018). Thus, it is unexpected that in the distribution network a single forecasting model can provide an accurate non-linear function that maps the input vector to the future value of the load. In view of this, a forecasting method of pattern adaptive matching is proposed in this paper. In the proposed method, different load patterns are firstly obtained by optimal clustering of massive consumer historical loads, which can well characterize the fluctuation characteristics of various loads. Then, for each load pattern, a load forecasting model based on stacking ensemble learning is built, which can establish a multi-model fusion load forecasting model to improve the performance of load forecasting. Next, according to the fluctuation characteristics of the latest consumer load, all the consumers are classified into different groups, where each group corresponds to a particular identified load pattern. Finally, forecast the load of each group separately and sum the forecasts of different groups to obtain the aggregated load forecast. The result based on open dataset demonstrates that compared with the overall forecast by a single method, in the proposed method, the impact of load fluctuations on the forecast accuracy is reduced, and the forecast accuracy increased by 0.94%.
The key contributions of this paper can be briefly summarized as follows:
1) A novel two-stage short-term load forecasting method for the aggregated load is proposed, where the adaptive pattern matching technique is designed to improve the adaptive capability of the proposed forecasting method.
2) Forecasting models based on stacking ensemble learning are built, where the advantages of integrated heterogeneous models are fully utilized.
3) We validate our proposed method with a public dataset and compare its performance with several single load forecasting methods, where its superior performance is demonstrated for the proposed method.
The remainder of this letter is organized as follows: Section 2 focuses on the implementation of the forecasting model. Section 3 conducts case studies and makes comparisons to verify the effectiveness of our proposed method. Finally, Section 4 draws conclusion and gives an outlook on future work.
2 Proposed methodology
The construction of the adaptive forecasting method with pattern matching proposed in this paper is shown in Figure 1.
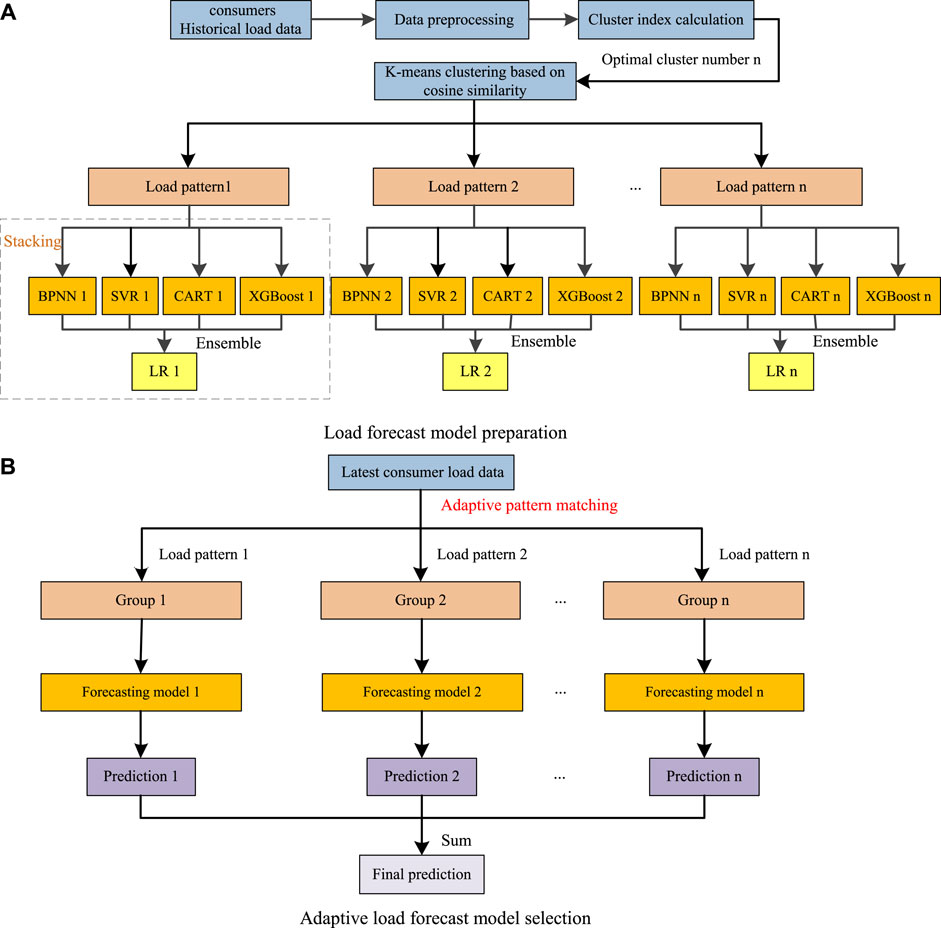
FIGURE 1. The full flowchart of the proposed method. (A) Load forecast model preparation. (B) Adaptive load forecast model selection.
The overall forecasting process of the proposed method can be divided into two stages: load forecast model preparation stage and adaptive load forecast model selection stage. The construction is shown in Figure 1. In the load forecast model preparation stage, load patterns are optimally obtained from historical load data. And for each load pattern, stacking ensemble learning based forecasting models is well prepared. In this stage, we first utilize the cosine similarity to measure the morphological distance between consumers’ historical load data, then the load patterns are clustered by using the k-means algorithm. The optimal number of clusters is determined by cluster index. Finally, the Stacking based load forecasting model is built for each load pattern. The stacking based model has two levels. In the first level, the load pattern data are used to train the Back Propagation Neural Network (BPNN) (Park et al., 1991), SVR, CART and XGBoost based models. Then, in the second level, the liner regression (LR) model is employed to determine the weights and fuses the multiple level-one models. While in the adaptive load forecast model selection stage, different groups of consumers are constructed based on their load patterns and forecasting is conducted on the grouped load individually. In this stage, according to the similarity between the latest consumer load data and the load pattern, all consumer load data are firstly classified into the previously identified load pattern. Afterwards, the corresponding forecasting model of each load pattern is employed for prediction. Finally, sum the predictions of different groups to obtain the final prediction.
2.1 Load forecast model preparation stage
It is clear that load consumption differs in both magnitude and time of use, and is dependent on lifestyle, weather, and many other relevant factors. In order to classify dissimilar loads into different clusters, this paper uses cosine similarity to measure the difference in consumer load curve shape, and uses k-means algorithm for clustering. Let xi=(xi1, xi2, …, xin),xj=(xj1, xj2, …, xjn) be two load curves, and the similarity between them is defined as:
It can be concluded from Eq. 1 that the more similar the two curves are in shape, the lower the cosine similarity is. When the two curves are completely identical in shape, the cosine similarity is 0.
Next, we construct a clustering indicator for K-means clustering method. As a classic clustering algorithm, K-means algorithm is widely used in power load clustering analysis. But the number of clusters directly affects the clustering effect. In order to determine the optimal number of clusters, we adopt the graph-based clustering effect evaluation method to establish the clustering evaluation index.
where K is the number of clusters, vc denotes the cluster center of each cluster; nK represents the number of samples contained in the current K-th cluster. V represents the sum of distances from various samples to their corresponding cluster centers. V decreases with the increase of the number of clusters. When the decreasing trend of V value tends to be gentle, the corresponding cluster number is the best cluster number.
By applying the above clustering method, we can optimally obtain the load pattern from the historical load data. Then, for each load pattern, a load forecasting model is to be trained. In order to combine the advantages of several heterogeneous models, a stacking based ensemble learning method is proposed to train the load forecasting model. Ensemble learning is a method that combines the prediction results of multiple models to obtain better and more robust prediction than any one model. Ensemble learning based on stacking is an integration technology that combines many different models to form a new model with two-level structure. Figure 2 illustrates its basic structure.
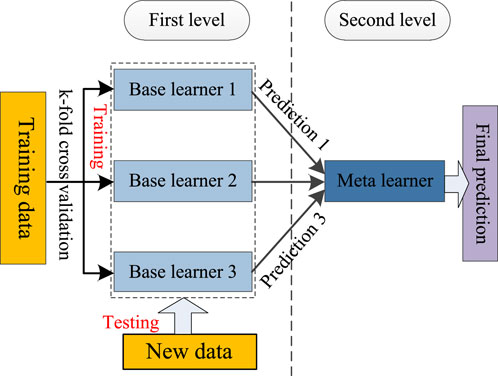
FIGURE 2. Ensemble learning method based on Stacking.
In the first level, multiple different types of base learners are trained to predict the data set. In order to prevent the occurrence of overfitting, the training data is learned in the base learner by means of k-fold cross-validation, and the training results of the base learner are used as the input of the meta learner for training. After the training, the final prediction result can be obtained by taking the test set as input.
In this paper, we select BPNN, SVR, CART, and XGBoost as the base learners. BPNN has self-learning, self-organization, self-adaptive, and strong non-linear function approximation ability, and has strong fault tolerance. The BPNN algorithm is mainly composed of two parts: one is the forward propagation of the signal; the other is the back-propagation of the error between the output value and the real value, and constantly corrects the parameters of each neuron. SVR is an important application branch of support vector machine (SVM) (Zhang et al., 2011). It maps the input vector to the high-dimensional feature space through non-linear mapping and obtains a regression hyperplane through calculation, so that the sum of distances from all sample points in the set to the hyperplane is minimum. The CART algorithm recursively performs binary segmentation on each feature, The segmentation method adopts the Gini index estimation function based on the minimum distance, and divides the current sample set into two sub-sample sets so that each non-leaf node generated has two branches. XGBoost is an engineering implementation of gradient boosting decision tree (GBDT) algorithm (Liu et al., 2018). Its basic idea is that multiple weak regression trees are linearly combined into strong regression trees. Its model is defined as:
where F(x) is the final output value and fm(x) is the output value of the m-th weak regression tree.
In the second level, linear regression is chosen as the meta learner. That is, the predictions obtained by the base learners are optimally weighted by the least squares algorithm to obtain the final prediction. The model is defined as:
where
In the process of model training, the prediction
where Y = [1, y1, y2, …, yn], W = [w0, w1, w2, …, wn]T, 1 is the column vector whose elements are all 1.
2.2 Adaptive load forecast model selection stage
When performing load forecasting in real time, the consumer’s electricity load should be firstly matched with the load pattern that has been divided according to the morphological similarity between the consumers’ latest electricity consumption data and the identified load pattern. Then the consumer’s power loads are predicted by the prediction model corresponding to the same load pattern.
Figure 3 shows the diagram of pattern matching approach. In this approach, we set a month as 28 days (the same as below). When forecasting the load on the day q + 1 (q = 0, 1, ..., 27) of a month, the selected data includes the data1 of the first q days of this month and the load data2 for the (28-q) days of the previous month. In order to make the selected data time consistent with the monthly load pattern, move data1 to data2 and splice it into a consumer’s completed monthly load data3 from the beginning of the month to the end of the month. Calculate the cosine similarity between each consumer data3 and each monthly load pattern, and classify each consumer into the most similar monthly load pattern with its lowest value. Thus, all the consumers are divided into different groups. Each group is forecasted separately by the corresponding forecasting model. Then, these predictions are summed to form the aggregated load prediction.
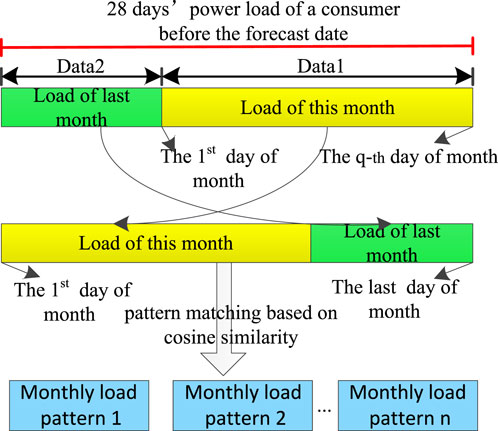
FIGURE 3. Pattern matching diagram.
3 Case study
In order to assess the performance of our model, we chose the grid-side power consumption data of 300 households in Australia for analysis (https://www.ausgrid.com.au/Industry/Innovation-and-research/Data-to-share/Solar-home-electricity-data). The data length is from 1 July 2010, to 30 June 2011. The time resolution is 30 min.
To evaluate the overall forecasting accuracy of the proposed model, two commonly used evaluation metrics are adopted in this work. They are Mean Absolute Percentage Error (MAPE) and Root Mean Square Error (RMSE), whose expressions are given as
where e is the actual value, o is the predicted value, and N is the predicted number.
3.1 Identification of load patterns
Firstly, select the data of 300 households in the first 10 months from 1 July 2010, to formulate a total of 3,000 monthly load data samples. The time resolution is 30 min. We increase the number of clusters to obtain the change graph of clustering index, as shown in Figure 4, using the K-means algorithm based on cosine similarity. When the K value is between 9 and 12, the downward trend of the evaluation index V tends to slow down. Select Kb = 9 as the best cluster number. Then the K-means clustering is carried out again to obtain nine kinds of monthly load patterns, as shown in Figure 5.
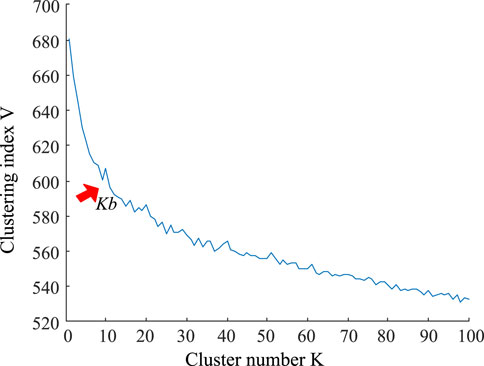
FIGURE 4. Clustering index.
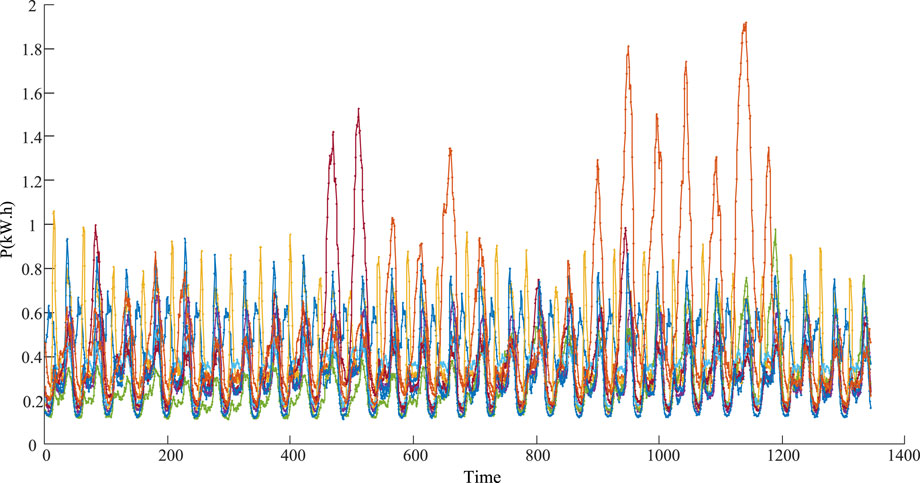
FIGURE 5. Monthly load pattern.
Let the load at the predicted time t Pt be the output, and select historical load, working day, weekend, and time of day as feature inputs, the input feature are:
where the first seven elements are historical load data, h is the time of the day when the load data is collected, weekday and hour respectively represent the week and hour. 1,344 samples can be constructed in each month’s load pattern, 70% of the samples are randomly selected as training samples, and the remaining samples are used as validation samples. The best super parameters of each base learner are obtained by the grid search method.
3.2 Pattern matching and load forecasting
Select the first 7 days of November for load forecasting. Pattern matching is required for each day from the first day to the seventh day of November. Table 1 give the pattern matching results of the first day of November. The matching index in the table refers to the cosine similarity between the data obtained by summing the data of consumers that match the same load pattern with the corresponding monthly load pattern It can be seen from the table that the fewer consumers the model matches, the higher the matching index, that is, the lower the similarity between the consumer load data and the monthly load pattern, which will make the prediction effect worse to a certain extent, but the number of consumers is small, the impact on the overall load prediction is small.
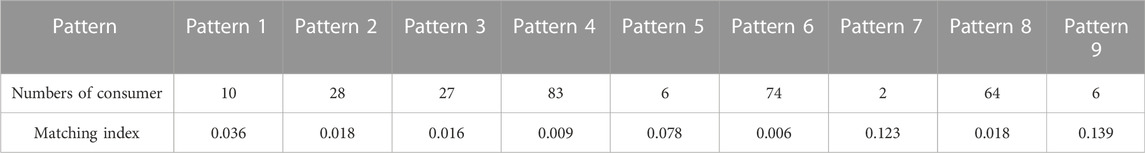
TABLE 1. Pattern matching results on November 7.
After the pattern matching, all consumers are assigned to different groups, each of which corresponds to a previous load pattern. Forecast the load separately for each group, and sum the predictions from all the groups to get the load forecasting results for the first 7 days of November, as shown in Figure 6 and Table 2. In order to verify the effectiveness of the method proposed in this letter, the overall prediction by the single method of BPNN, SVR, CART, and XGBoost is introduced.
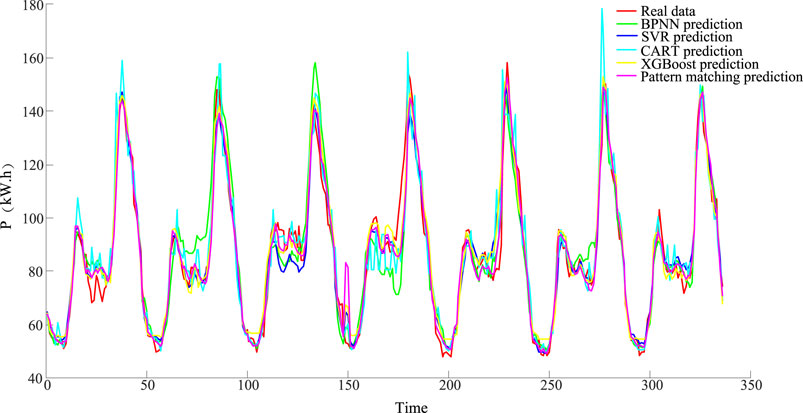
FIGURE 6. Prediction results of different methods.
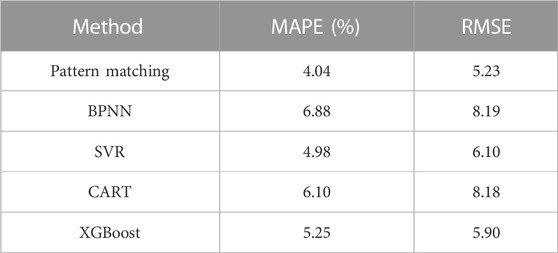
TABLE 2. Load forecasting results of different methods.
Comparing the above results, it is found that, compared with other methods using a single model, the adaptive pattern matching prediction method proposed in this letter can achieve the best prediction effect and can improve the prediction accuracy by at least about 0.94%.
4 Conclusion and future works
In this paper, we have proposed an adaptive forecasting method for the aggregated load with pattern matching. The main advantage is that it can select the proper load pattern corresponding to the load in time according to the change of load fluctuation, and construct the best prediction model for prediction. Compared with a single load forecasting model, the forecasting accuracy of the proposed model is greatly improved. We will extend the method from deterministic forecasting to probabilistic forecasting. The application of our proposed method to wind or solar forecasting will also be investigated.
Data availability statement
The original contributions presented in the study are included in the article/Supplementary Material, further inquiries can be directed to the corresponding author.
Author contributions
The first author, YT, and the corresponding author, ZT, contributed to the main conception, analysis frame of this study and the manuscript preparation. JL gave constructive discussion, contributed to the analysis, and made conclusion. YG, LW, JZ, and FH gave some advices.
Funding
This work is supported by Science and Technology Project of State Grid Corporation of China (No. 5400-202112507A-0-5-ZN).
Conflict of interest
LW was employed by State Grid Tianjin Electric Power Company.
The remaining authors declare that the research was conducted in the absence of any commercial or financial relationships that could be construed as a potential conflict of interest.
The authors declare that this study received funding from State Grid Corporation of China. The funder had the following involvement in the study: Data provision and the suggestions for writing.
Publisher’s note
All claims expressed in this article are solely those of the authors and do not necessarily represent those of their affiliated organizations, or those of the publisher, the editors and the reviewers. Any product that may be evaluated in this article, or claim that may be made by its manufacturer, is not guaranteed or endorsed by the publisher.
References
Chaouch, M. (2014). Clustering-based improvement of nonparametric functional time series forecasting: Application to intra-day household-level load curves. IEEE Trans. Smart Grid 5 (1), 411–419. doi:10.1109/TSG.2013.2277171
Diamantoulakis, P. D., Kapinas, V. M., and Karagiannidis, G. K. (2015). Big data analytics for dynamic energy management in smart grids. Big Data Res. 2, 94–101. doi:10.1016/j.bdr.2015.03.003
Fallah, S. N., Deo, R. C., Shojafar, M., Conti, M., and Shamshirband, S. (2018). Computational intelligence approaches for energy load forecasting in smart energy management grids: State of the art, future challenges, and research directions. Energies 11 (3), 596–626. doi:10.3390/en11030596
Guan, C., Luh, P. B., Michel, L. D., Wang, Y., and Friedland, P. B. (2013). Very short-term load forecasting: Wavelet neural networks with data pre-filtering. IEEE Trans. Power Syst. 28 (1), 30–41. doi:10.1109/TPWRS.2012.2197639
Haque, A. IEEE.An SVR-based building-level load forecasting method considering impact of HVAC set pointsProceedings of the 2019 IEEE Power & Energy Society Innovative Smart Grid Technologies Conference (ISGT)February 2019Washington, DC, USA.
Hippert, H. S., Pedreira, C. E., and Souza, R. C. (2001). Neural networks for short-term load forecasting: A review and evaluation. IEEE Trans. Power Syst. 16 (1), 44–55. doi:10.1109/59.910780
Huang, S. J., and Shih, K. R. (2003). Short-term load forecasting via ARMA model identification including non-Gaussian process considerations. IEEE Trans. Power Syst. 18, 673–679. doi:10.1109/tpwrs.2003.811010
Kong, W., Dong, Z. Y., Hill, D. J., Luo, F., and Xu, Y. (2017). Short-term residential load forecasting based on resident behaviour learning. IEEE Trans. Power Syst. 33, 1087–1088. doi:10.1109/tpwrs.2017.2688178
Kumar, S., Hussain, L., Banarjee, S., and Reza, M., “Energy load forecasting using deep learning approach-LSTM and GRU in spark cluster”, Proceedings of the 2018 Fifth International Conference on Emerging Applications of Information Technology (EAIT), January 2018, Kolkata, India, pp. 1–4. doi:10.1109/EAIT.2018.8470406
Liao, X. “Research on short-term load forecasting using XGBoost based on similar days”, Proceedings of the 2019 International Conference on Intelligent Transportation, Big Data & Smart City (ICITBS), January 2019, Changsha, China 2019.doi:10.1109/ICITBS.2019.00167
Liu, S., Cui, Y., Ma, Y., and Liu, P., “Short-term load forecasting based on GBDT combinatorial optimization”, Proceedings of the 2018 2nd IEEE Conference on Energy Internet and Energy System Integration (EI2), Beijing, China, October 2018, pp. 1–5. doi:10.1109/EI2.2018.8582108
Mbamalu, Gan, and El-Hawary, M. E. (1993). Load forecasting via suboptimal seasonal autoregressive models and iteratively reweighted least squares estimation. IEEE Trans. Power Syst. 8, 343–348. doi:10.1109/59.221222
Park, D. C., El-Sharkawi, M., Marks, R., Atlas, L., and Damborg, M. (1991). Electric load forecasting using an artificial neural network. IEEE Trans. Power Syst. 6, 442–449. doi:10.1109/59.76685
Quan, H., Srinivasan, D., and Khosravi, A. (2014). Short-Term Load and Wind Power Forecasting Using Neural Network-Based Prediction Intervals. [J]. IEEE Trans. Neural Netw. Learn. Syst. 25 (2), 303–315.
Sajjad, M., Khan, Z. A., Ullah, A., Hussain, T., Ullah, W., Lee, M. Y., et al. (2020). A novel CNN-GRU-Based hybrid approach for short-term residential load forecasting. IEEE Access 8, 143759–143768. doi:10.1109/ACCESS.2020.3009537
Shi, H., Xu, M., and Li, R. (2018). Deep learning for household load forecasting—a novel pooling deep RNN. IEEE Trans. Smart Grid 9 (5), 5271–5280. doi:10.1109/TSG.2017.2686012
Stephen, B., Tang, X., Harvey, P. R., Galloway, S., and Jennett, K. I. (2017). Incorporating practice theory in sub-profile models for short term aggregated residential load forecasting. IEEE Trans. Smart Grid 8 (4), 1591–1598. doi:10.1109/TSG.2015.2493205
Tan, M., Yuan, S., Li, S., Su, Y., Li, H., and He, F. H. (2020). Ultra-short-term industrial power demand forecasting using LSTM based hybrid ensemble learning. IEEE Trans. Power Syst. 35, 2937–2948. doi:10.1109/tpwrs.2019.2963109
Tan, Z., Zhang, J., He, Y., Zhang, Y., Xiong, G., and Liu, Y. (2020). Short-term load forecasting based on integration of SVR and stacking. IEEE Access 99, 227719–227728. doi:10.1109/access.2020.3041779
Xuan, Y., Si, W., Zhu, J., Sun, Z., Zhao, J., and Xu, M. (2021). Multi-model fusion short-term load forecasting based on random forest feature selection and hybrid neural network. IEEE Access 9, 69002–69009. doi:10.1109/ACCESS.2021.3051337
Yao, X., Fu, X., and Zong, C. (2022). Short-term load forecasting method based on feature preference strategy and LightGBM-XGboost. IEEE Access 10, 75257–75268. doi:10.1109/ACCESS.2022.3192011
Zhang, M., Yu, Z., and Xu, Z. (2020). Short-term load forecasting using recurrent neural networks with input attention mechanism and hidden connection mechanism. IEEE Access 8, 186514–186529. doi:10.1109/ACCESS.2020.3029224
Zhang, Q., Lai, K. K., and Niu, D., “Optimization combination forecast method of SVM and WNN for power load forecasting”, Proceedings of the 2011 Fourth International Joint Conference on Computational Sciences and Optimization, April 2011, Kunming and Lijiang City, China, pp. 249–253. doi:10.1109/CSO.2011.193
Keywords: adaptive load forecasting, aggregated load, pattern matching, cosine similarity, stacking ensemble learning
Citation: Tang Y, Tang Z, Gao Y, Wei L, Zhou J, Han F and Liu J (2023) An adaptive forecasting method for the aggregated load with pattern matching. Front. Energy Res. 10:1088100. doi: 10.3389/fenrg.2022.1088100
Received: 03 November 2022; Accepted: 05 December 2022;
Published: 20 January 2023.
Edited by:
Yaser Qudaih, Higher Colleges of Technology, United Arab EmiratesReviewed by:
Weiye Zheng, South China University of Technology, ChinaWanjun Huang, Beihang University, China
Ao Qiao, Chengdu University of Information Technology, China
Copyright © 2023 Tang, Tang, Gao, Wei, Zhou, Han and Liu. This is an open-access article distributed under the terms of the Creative Commons Attribution License (CC BY). The use, distribution or reproduction in other forums is permitted, provided the original author(s) and the copyright owner(s) are credited and that the original publication in this journal is cited, in accordance with accepted academic practice. No use, distribution or reproduction is permitted which does not comply with these terms.
*Correspondence: Zhiyuan Tang, dGFuZ3poaXl1YW5Ac2N1LmVkdS5jbg==