 Xuecheng Liu
 Libao Shi
95% of researchers rate our articles as excellent or good
Learn more about the work of our research integrity team to safeguard the quality of each article we publish.
Find out more
ORIGINAL RESEARCH article
Front. Energy Res. , 23 January 2023
Sec. Smart Grids
Volume 10 - 2022 | https://doi.org/10.3389/fenrg.2022.1082442
This article is part of the Research Topic Exploring Cyber-Physical Interactions in Energy and Power Systems: Theory and Application View all 6 articles
The widely used intelligent measuring equipment not only makes the operation of AC/DC hybrid transmission system more safe and reliable, but also inevitably brings new problems and challenges such as the threats and hidden dangers of cyber attacks. Given this, how to effectively and comprehensively assess the inherent vulnerabilities of AC/DC hybrid transmission systems under the coordinated physical-cyber attacks is of critical significance. In this paper, a three-stage physical-cyber attack and defense risk assessment framework based on dynamic game theory is proposed. In the framework, the dynamic game process between attacker and defender is carried out for the power grid risk, which is expressed as the product of the attacker’s success probability in attacking the substation and the load loss caused by the attack. Regarding the probability of a successful attack, it depends on the number of funds invested by both attacker and defender sides considering the marginal effect, while the corresponding load loss caused depends on the cyber attack vector and the optimal load shedding scheme. For the solution of the proposed three-stage dynamic game framework, it is converted into a bi-level mathematical programming problem, in which the upper-level problem is solved by using the backward induction method to get the subgame perfect Nash equilibrium, and the lower-level problem is solved by using an improved particle swarm optimization algorithm to get the optimal amount of load shedding. Finally, the case study is performed on a modified IEEE 14-node AC/DC hybrid transmission test system, and the inherent weaknesses of the power grid are identified based on the risk assessment results, verifying the effectiveness of the proposed framework and method.
With the continuous evolution and in-depth integration of the physical power grid composed of practical equipment and the advanced information communication system (ICS), a powerful cyber physical power system (CPPS) has been gradually formed. In particular, with the deep interaction between the physical power grid and ICS, the high dependence of the power grid on the measurement data will cause great damage to the power system security and stability under cyber attacks that compromise the availability, integrity, and confidentiality of power grid data (Xu et al., 2021). Compared with physical attacks, some cyber attacks, such as the false data injection (FDI) and distributed denial of service (DDoS) attacks, are highly stealthy, easy to implement, and difficult to defend promptly. It is known that the blackout occurred in Ukraine on 23 December 2015 was the first event in the world that was considered as a malicious cyber attack on the power supply system (Liang et al., 2016). In the blackout, a malware called “Black Energy” attacked 60 substations roughly, resulting in power outage of 1.4 million people in western Ukraine for 3–6 h. Thereafter, more and more cyber attacks have occurred in power systems around the world, and have caused certain system losses and social impact, such as the ransomware attack on the Israeli national grid in 2016 and the satellite DoS attack on a German wind farm in 2022. As a result, it is foreseeable that as more and more intelligent devices are put into the modern AC/DC hybrid transmission system, especially with the increasing proportion of large-scale grid-connected clean energy and energy storage system, once the power grid suffers from the coordinated physical-cyber attacks, it will cause inestimable and severe economic and social losses, affecting people’s normal life.
So far, a lot of research has been conducted on the risk analysis of CPPS in the case of cyber attacks. Regarding the interactions between cyber attackers and power grid defenders, a bi-level optimization problem has been constructed to perform vulnerability analysis (Yuan et al., 2011; Khanna et al., 2017), in which the upper level problem mainly described the behavior of the attacker, while the lower level problem mainly achieved the power grid protection based on security-constrained economic dispatch. In (Che et al., 2018), a cyber-secured corrective dispatch scheme was proposed to protect the power grid from potential data attacks. In (Chung et al., 2018), a coordinated cyber-physical attack scheme was proposed to cause more serious consequences, and a target selection criterion was designed to achieve higher attack success rate. The bi-level optimization model built in the above studies mainly focuses on the behavior of attackers and defenders, ignoring the impact of resource deployment on attack and defense, which can help attackers gain access to key equipment through related vulnerabilities to achieve the purpose of attack or help defenders detect attack behavior through related defense facilities to ensure the security of the power grid. In order to better describe the resource allocation between attackers and defenders, many studies have used game frameworks to model the strategic choices of attacks and defenses, that is, the choice of various resource allocation schemes (Ranjbar et al., 2019; Dai and Shi, 2020; Gao and Shi, 2020; Hasan et al., 2020; Shan and Zhuang, 2020; Zhang et al., 2021). In addition, different game models have been used to explain a variety of attack and defense scenarios according to the research target and cyber attack methods. In Xiang et al. (2018), a system adequacy evaluation framework incorporating cyber attacks and physical failures was proposed to quantify the influence of cyber attacks on the power supply adequacy, and the static and Markov games were applied to model the interactions between defenders and attackers. In Wang et al. (2017), a Bayesian honeypot game strategy was introduced to investigate the DDoS attack in the advanced metering infrastructure network, and the interactions between the defenders and the attackers were analyzed elaborately. In Liu and Wang (2021), a FlipIt game model was established to investigate the interactions between the defender, the attacker and insider, and three types of insiders and their corresponding impacts on the supervisory control and data acquisition system were modeled and analyzed. In Lakshminarayana et al. (2021), a zero-sum non-cooperative game model was proposed to find the optimal placement of distributed flexible AC transmission system as defense resource, so as to realize a moving target defense strategy against the coordinated physical-cyber attack. In order to study the interactions between defenders and attackers more comprehensively, two game models, namely a Stackelberg game and a hybrid satisfaction equilibrium-Nash equilibrium game, were applied to study the impacts of data injection attacks on the smart grid with multiple adversaries taken into account (Sanjab and Saad, 2016). In Wei et al. (2016), a stochastic game-theoretic approach was proposed to find the optimal strategy of defender to protect the power grid against coordinated physical-cyber attack. Although these game models mentioned above explained the interaction of the resource allocation between attackers and defenders in detail, the risks of power system, usually quantified as the product of the attack success probability and the corresponding consequences, still needs to be studied in-depth. The classic three-stage defender-attacker-defender dynamic game models with complete information were proposed to assess the operation risks of transmission lines (Gao and Shi, 2020) and feeder automation system (Dai and Shi, 2020) under various physical-cyber attack scenarios. In Zhang et al. (2021), a zero-sum multi-level Markovian Stackelberg game was proposed to model the sequential attack and defense actions on both cyber layer and physical layer, aiming to mitigate the risks of power system. Moreover, some studies also conducted risk analysis on CPPS system based on game theory by considering the information asymmetry between attackers and defenders (Gao et al., 2019; Wang et al., 2019; Shao and Li, 2021; Tian et al., 2021). In the aforementioned existing studies, almost all the studies are conducted for the AC transmission systems, and few studies investigate and discuss the impact of cyber attacks on the AC/DC hybrid transmission systems. In Amir et al. (2019), the impacts of the cyber-attacks on the HVDC system and the effects on the dynamic voltage stability were investigated to implement the cyber-physical vulnerability and security evaluation of AC/DC hybrid power grid. In Qiu et al. (2021), a HVDC ancillary control strategy based on a hybrid data-driven technology was proposed to effectively improve the controllability of the HVDC intertie under the FDI attacks. Although the existing work on the impact of cyber attacks on power grid operation and stability has achieved fruitful research results using models and methods with varying degrees of detail, the resource allocation of defenders and attackers is relatively abstract, lacking some practical significance, and the attack and defense strategies adopted are difficult to reflect the actual operating conditions of the power grid studied. Meanwhile, most of the existing work takes the implementation conditions of the cyber attacks as the main factor affecting the success probability of cyber attacks, such as whether the false data can pass the bad data detection in the FDI attacks, lacking the modeling of the specific process of cyber attacks, which obviously will affect the success probability of attackers. In addition, most of the existing research work mainly focuses on the AC transmission systems, but the operation risk of the AC/DC hybrid transmission system under the coordinated physical-cyber attacks is rarely discussed. More intensive and specific research work needs to be further carried out to model the resource allocation of attackers and defenders, and the cyber attack process and the corresponding risk assessment of AC/DC hybrid system need to be explored and exploited in more detail.
In this paper, a three-stage dynamic game risk assessment framework for an AC/DC hybrid transmission system under the coordinated physical-cyber attacks is proposed, and then this three-stage dynamic game framework is converted into a bi-level mathematical optimization problem, which is solved by using the backward induction (BI) method and an improved particle swarm optimization (IPSO) algorithm. The main contributions of this paper are summarized in the following three-fold.
1) A three-stage physical-cyber attack and defense risk assessment framework based on dynamic game theory is proposed, aiming to effectively identify the inherent vulnerability of the AC/DC hybrid transmission system under the coordinated physical-cyber attacks.
2) The process of substation suffering from the cyber and physical attacks is elaborately modeled to implement the quantification of the actual success probability of the FDI attack on the substation, which lays the foundation for the risk assessment of the system.
3) A FDI attack model, targeting the AC/DC hybrid transmission system, is carefully constructed based on AC state estimation to bypass the bad data detector and effectively realize more stealthy cyber attacks. In addition, an IPSO algorithm is applied to solve the proposed FDI attack model with highly non-linear characteristics.
The structure of the paper is organized as follows. In Section 2, a three-stage physical-cyber attack and defense risk assessment framework based on dynamic game theory is discussed. The corresponding solution methodology based on the BI and an IPSO algorithms is given in Section 3. The case study based on a modified IEEE 14-node test system is performed in Section 4. Finally, Section 5 concludes this paper and discusses possible future work.
In this paper, a dynamic game framework is proposed to conduct the risk assessment of coordinated physical-cyber attacks in an AC/DC hybrid transmission system. In this dynamic game framework, two players are involved, namely an attacker and a defender. The attacker is assumed to be an attack team that consists of hackers, mainly performing data monitoring and cyber attacks against substations, and the FDI attacks are used as the main means of cyber attacks. The defender is also assumed to be a defensive team that consists of utility managers, substation inspectors, and cyber security technicians. The defensive team aims at reducing the success probability of cyber attacks on the transmission system by improving inspection efforts and identifying network vulnerabilities, and on the other hand, the defensive team will also conduct optimal load shedding strategy after being attacked. Based on game theory, and according to the action sequence of game participants, this paper proposes a three-stage physical-cyber attack and defense risk assessment framework for an AC/DC hybrid transmission system. The corresponding dynamic game equilibrium solution can not only obtain the optimal attack and defense strategies, but also identify the inherent weaknesses of the power grid according to the risk assessment results.
Figure 1 illustrates the game process of the three-stage physical-cyber attack and defense. In stage 1, the defender allocates limited defense funds to protect the cyber security and physical security of the substation. In stage 2, the attacker allocates limited attack funds to conduct cyber attacks on the substation, and gains the right to tamper with power grid data by performing FDI attacks. In stage 3, the defender adopts the optimal load shedding scheme for the AC/DC hybrid transmission system to minimize the power grid risk.
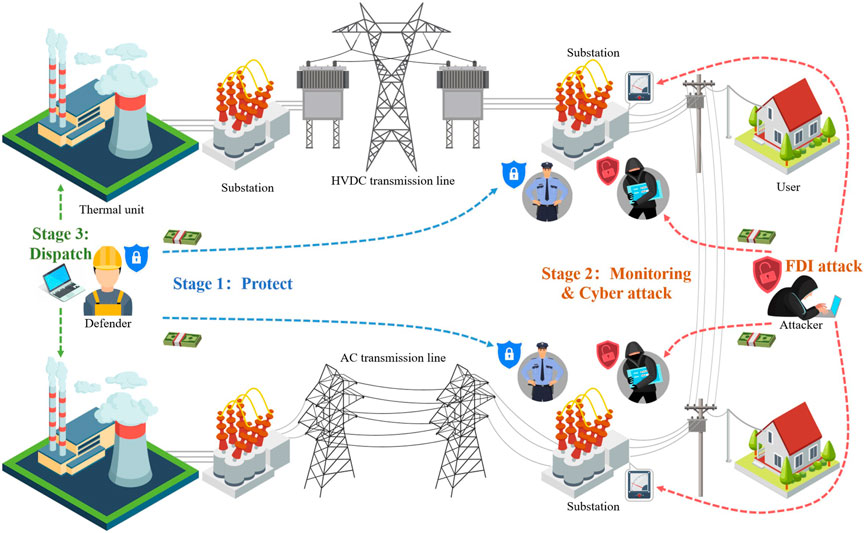
FIGURE 1. Illustration of three-stage physical-cyber attack and defense in an AC/DC hybrid transmission system.
The following basic assumptions are listed in modeling the proposed three-stage dynamic game framework.
1) The topology and all parameters of the power system are accessible to the attacker.
2) The defense strategies employed by the defender, namely the allocation of cyber defense and physical defense funds, are exposed to the attacker.
3) The attacker knows the optimal load shedding scheme that the defender will take if the attacks succeed.
4) The defender will consider the strategies of attackers before allocating defense funds.
Accordingly, the “defender-attacker-defender” three-stage game model established in this paper is a dynamic game with perfect information.
In order to further quantitatively evaluate the power grid risk under the coordinated physical-cyber attacks, a power grid attack risk index (GARI) is defined as follows, also representing the payoffs to the attacker and defender.
In this paper, the proposed GARI is computed as the product of the vulnerability of the substation under coordinated physical-cyber attacks and the corresponding consequences caused, which is expressed as
Regarding the cyber side, the defender can reduce the success probability of cyber attacks against substations by upgrading software, performing routine security checks, and purchasing data monitoring equipment. Especially in view of the fact that each substation improves its own communication network by applying for funds from the utility, and that there is an upper limit on these funds, a discrete allocation scheme of funds is designed in this paper to represent the deployment of defense funds, which is modeled as follows:
Regarding the physical side, the defender needs to prevent attacker from bribing substation staff and investigate the illegally installed monitoring devices around the substation to be attacked. Similarly, a discrete allocation scheme of defense funds is given as follows:
The set of defense fund deployment strategies for the defender can be determined after considering the allocation of funds for both cyber defense and physical security, which is given as follows:
As mentioned above, the main form of cyber attacks launched by attackers on the cyber side is the FDI attacks. In order to meet the conditions under which the FDI attacks can be performed, the attack team must hire a certain number of hackers to infiltrate the cyber network and falsify data. In this paper, it is assumed that the attack team pays different hacking service fees according to the skill level of the hired hackers. In view of this, a discrete hacking service fee scheme is designed to model the deployment of attack funds on cyber side, which is expressed as
To improve the success probability of performing FDI attacks against the AC/DC hybrid transmission system, it is essential to obtain some corresponding information of power grid, such as network topology and power flow data. More importantly, once the attack team obtains the SSH port number and password of measuring equipment in the target substations, it will be very easy to execute a stealthy FDI attack. Therefore, the attack team will spend certain funds to obtain power grid information by bribing substation staff and illegally installing some monitoring devices. Similarly, a discrete monitoring fee scheme is designed to model the deployment of attack funds on the physical side, which is expressed as
The set of attack fund deployment strategies for the attacker can be determined after considering the allocation of funds for both cyber attacks and physical monitoring, which is given as follows:
Once two players, the defender and the attacker, have deployed funds in sequential order, the probability of a successful cyber attack can be determined. Regarding the attack on the cyber side, the probability of an attacker successfully attacking the
In this paper, the probability
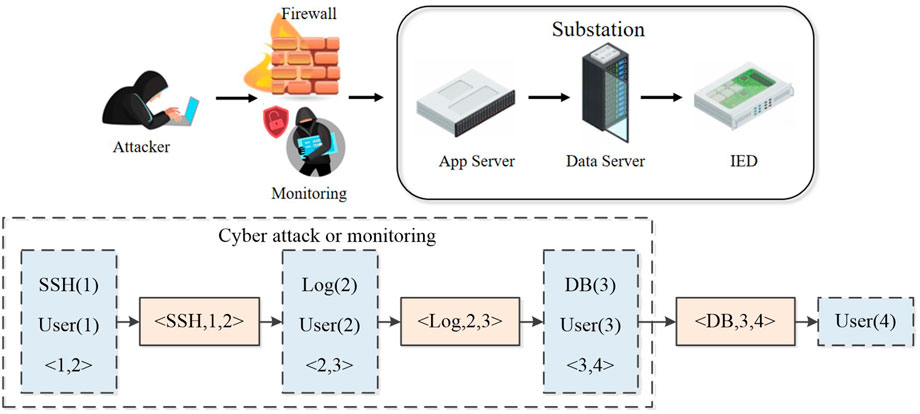
FIGURE 2. Bayesian attack graph model of substation under cyber attack.
In Figure 2, the hackers exploit the vulnerabilities < SSH1, 2>, <log2,3>, and <DB 3,4>, respectively, and get the control right of the substation, namely the right of User (4) in accordance with the <1,2>, <2,3>, and <3,4 > connectivity paths. The corresponding details of each vulnerability are shown in Table 1, and the value of each vulnerability can be calculated quantitatively based on the common vulnerability scoring system (CVSS) (National institute of standards and technology, 2022), which is a method used to provide qualitative measure of severity. In addition, the CVSS also provides a lot of information about each vulnerability, such as impact, attack vector, weakness, or other relevant technical information. The given information can help determine the number from 0 to 10 as the CVSS score, and the larger the number, the higher the severity of the vulnerability.
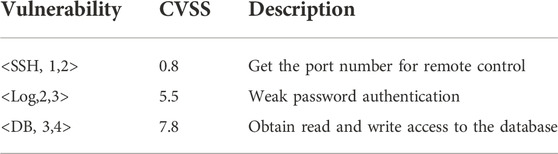
TABLE 1. Information on the vulnerabilities exploited during the attack.
The final success probability of an attacker falsifying the data of the
In this paper, the CVSS score is divided by 10 to implement the normalization as the success probability of a cyber attack, so the
For the connectivity probability
It should be noted that the value of
Regarding the attack on the physical side, the attacker can not only obtain the basic information of the power grid by monitoring data or bribing staff, but also obtain SSH port information and password of substation. Therefore, we propose the following expression to model the probability of obtaining SSH port and password by non-network intrusion means
It should be noted that the value of
To sum up, the actual success probability of the FDI attack on the
More specifically, the success probability of the attacker’s FDI attack on the AC/DC hybrid transmission system is the cumulative product of the success probability of the attack on all target substations, which can also be referred to the vulnerability of the power grid under cyber attacks
In the Stage 1 and Stage 2, once the deployment strategies of defense and attack funds are determined, the vulnerability of the substation attacked
In this situation, the defender only needs to take some actions in response to the consequence
Since the target of FDI attacks in this paper is the AC/DC hybrid transmission system, the attacker constructs the attack vectors based on AC state estimation to bypass the bad data detector in EMS system. Inspired by the existing FDI attack modeling for AC state estimation (Rahman and Mohsenian-Rad, 2013; Liu and Li, 2016), the corresponding FDI attack vector set
It should be noted that since the measurement devices in substation cannot measure the phase angle, so the actual attack vector does not contain
To ensure that the FDI attack based on AC state estimation can bypass the bad data detector, the attacker must obey the following rules:
1) The voltage magnitude of the generator node cannot be modified;
2) Only the voltage magnitude and phase angle of the zero-load node can be modified;
3) The voltage magnitude and phase angle of the node adjacent to non-attacked nodes (called edge nodes) cannot be modified;
4) The variation of all tampered data should be within a certain range;
5) The data of DC transmission lines cannot be tampered with.
Based on these rules described above, the FDI attack constraints are indicated as follows:
The corresponding
Similar to the FDI attack vector, the optimal load shedding vector set
Subject to the following constraints:
The corresponding
In this paper, the line commutated converter (LCC) model as shown in Figure 3 is applied to formulate the HVDC transmission line, which is given as follows (Kundur and Malik, 2022):
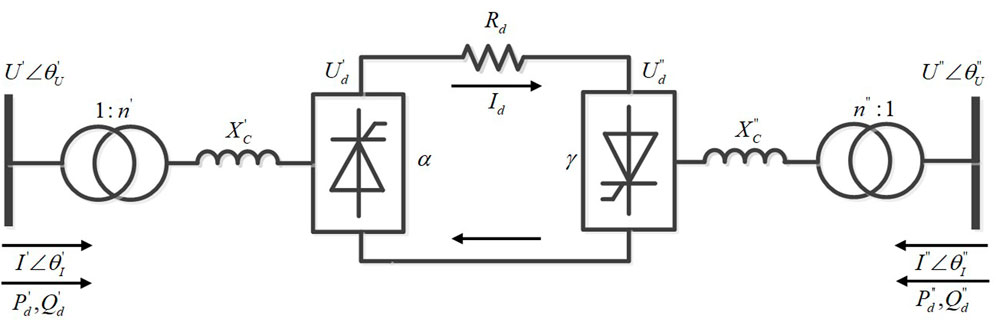
FIGURE 3. Schematic diagram of LCC-HVDC transmission model.
By solving the optimization problem shown in (Eq. 16) under the FDI attack vector constraints as given in (Eqs 18, 19) and the load shedding vector constraints as given in (Eqs 21–23), the optimal solutions, namely the optimal FDI attack vector set
According to the modeling analysis of each stage in the aforementioned three-stage dynamic game framework, the framework can be converted into a bi-level mathematical programming problem for solution. In this paper, firstly, an IPSO algorithm is constructed to solve the lower-level programming problem, aiming to obtain the optimal FDI attack and the optimal load shedding vectors. Secondly, the payoffs of the different attack and defense fund deployment strategies can be calculated once the system loss is determined based on the solution of the lower-level programming problem. For the solution of the upper-level programming problem, the sub-game perfect Nash equilibrium is solved by using the BI method (Aliprantis, 1999), and it is also helpful to calculate the deployment of funds under the certain fund constraints. Finally, the risk assessment analysis is carried out in accordance with the Nash equilibrium obtained under various fund constraints.
It should be noted that the FDI attack against the AC state estimation system proposed in this paper is essentially a reconstruction form of partial power flow. According to the rules of generating FDI attack vectors described in Section 2.3, the tampered data and other data in the attack area still meet the power flow constraints, and only some inequality constraints such as voltage magnitude and line capacity are violated in the attack area. From the perspective of power grid dispatcher (the defender), it can be considered that the load changes cause some grid measurement data to exceed the limits. Therefore, the tampered data can bypass the bad data detector and affect the system state estimation.
As the tampered power grid data still meets the power flow constraints, the potential attack selections can be searched through the numerical relationship between power system unknowns and equations. If the number of unknowns in the set of all attacked target substations exceeds the number of equations, the set is considered to be suitable for FDI attacks, that is, a potential attack selection. On the one hand, since the active power, reactive power, voltage magnitude, and phase angle of each attacked target substation node need to be calculated, the number of unknowns
Moreover, based on the (Eq. 18) and (Eq. 19), as well as the relationship between active power and reactive power of load, the number of the equations
In this paper, a depth-first search strategy (DFS) is leveraged to search for the potential attack selections, and if the number of all attacked target substation sets meets
The FDI attack vectors can be constructed based on a given potential attack selection. According to (Eq. 19) and the relationship between active power and reactive power of load, it can be seen that once the active power of each attacked target substation is determined, the other three unknowns can be calculated based on the active power data, and the attack vectors can be represented by the following active power injection vectors:
For a determined
In order to solve the aforementioned problem effectively, an open-source non-linear optimization solver IPOPT (Wächter and Biegler, 2006) is employed to obtain the optimal load shedding strategy of the AC/DC hybrid transmission system. The corresponding solution
Regarding the solution of the optimal attack vector, an IPSO is applied owing to the non-convex nonlinear characteristics of the optimization problem. It is known that the basic PSO algorithm is quite suitable for dealing with non-convex nonlinear optimization problems because of its simple implementation process and no need for gradient information (Nickabadi et al., 2011). In the PSO algorithm applied in this paper, the particles are designed as the part of the active power injection vectors
As mentioned above, the load shedding amount of each substation mainly depends on the attack vector, line capacity, node voltage, and generator output under a malicious FDI attack scenario. By analyzing the FDI attack vector, the following characteristics can be found, that is, the node with the highest amount of load shedding generally has the largest or the second largest value of the active power attack vector, which can be used to generate some specific attack vectors as initial particles to assist the PSO algorithm to find the optimal solution and accelerate the convergence speed. Considering these characteristics of the FDI vectors, an IPSO algorithm with an initial particle generation technology proposed in this paper is applied to accelerate the convergence speed of the basic PSO algorithm. Moreover, these specific attack vectors can be called auxiliary attack vectors (
Subject to (Eq. 18) and the relationship between active power and reactive power of load.
Here, the
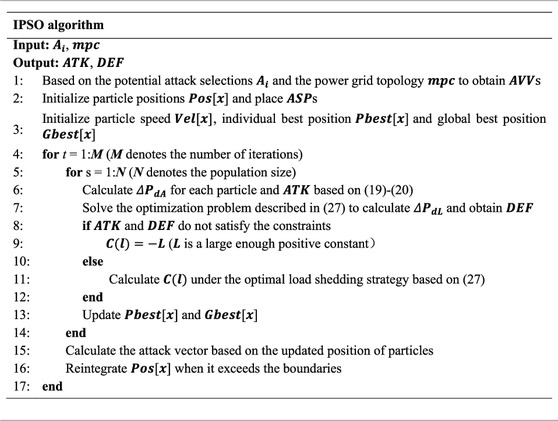
TABLE 2. Procedure of the proposed IPSO algorithm.
According to the load shedding results obtained by solving the lower-level programming problem mentioned above, the corresponding consequences caused by the coordinated physical-cyber attacks can be determined. Since the number of the attack and defense strategies under certain fund constraints is limited, it is easy to calculate all the payoffs between the attacker and the defender according to (Eq. 2), (Eqs 9–14). In this paper, once the payoffs are determined, the solution of the upper-level programming problem, namely the subgame perfect Nash equilibrium, can be obtained by using the BI method.
Considering that the proposed three-stage dynamic game framework is a zero-sum game problem, the payoff of the attacker can be expressed as
The payoff function of the defender can be expressed as
Then the subgame perfect Nash equilibrium can be written as
where
Strategy
In order to obtain the subgame perfect Nash equilibrium, the BI method is employed in this paper, which can be divided into the following two steps. In the first step, the attacker’s strategy under different defense strategy options is determined, which can be formulated as
In the second step, the defender predicts the attack strategies, so the second step can be formulated as
The solution process of the BI method for the subgame perfect Nash equilibrium can be illustrated in Figure 4.
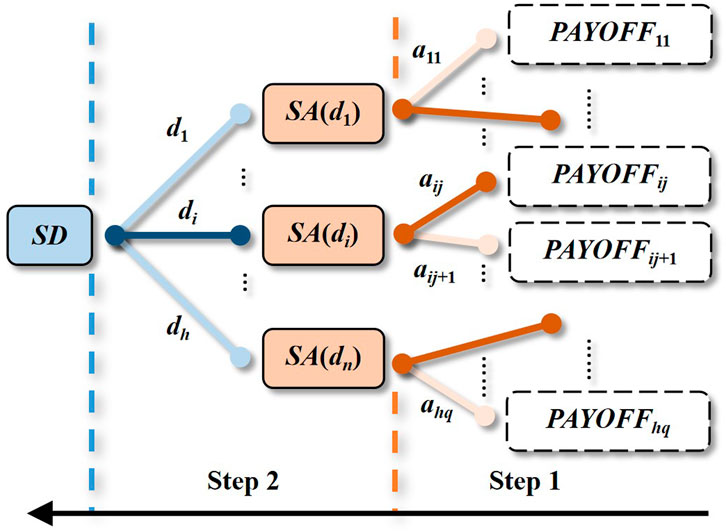
FIGURE 4. Solution process of the BI method.
In Figure 4, the attacker first selects the corresponding optimal attack strategy (marked by the dark red branch) based on each possible defense strategy. Once the attack strategy is determined, the payoff corresponding to the defense strategy is also determined. For example, the payoff of
Once the subgame perfect Nash equilibrium is obtained, it can be used to assess the power grid risk under the FDI attack with certain fund constraints.
According to the Nash equilibrium solved in the previous section, the probabilities of different strategies selected by the attacker and defender can be obtained. Therefore, the mixed attack and defense strategies can be expressed as
Based on the aforementioned probabilities and strategies, the expectations of fund deployment with a certain amount of fund constraints
Obviously, once the amount of funds changes, the expectation of fund deployment will also change. Therefore, the subgame perfect Nash equilibrium for various funds
Figure 5 illustrates the whole flow chart of the solutions for the upper-level and lower-level programming problems.
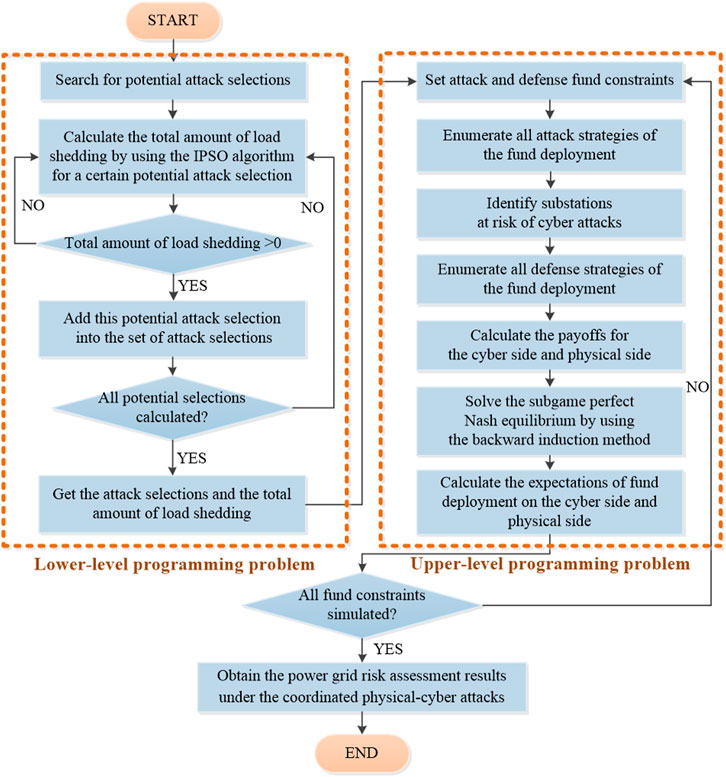
FIGURE 5. Flow chart of the converted bi-level programing model solution.
In this paper, the case studies are performed on a modified IEEE 14-node AC/DC hybrid transmission test system as shown in Figure 6 to verify the validity and effectiveness of the proposed model and algorithm. In the original IEEE 14-node system, the original AC transmission line between node 1 and node 5 is replaced by a ±500 kV HVDC transmission line to form an AC/DC hybrid transmission test system (Lotfjou et al., 2009). The corresponding system data including the parameters of the DC transmission line can be found in supplementary material. All simulations are performed under the Matlab™ environment, and the hardware configuration is as follows: CPU: Intel i7-10875H 8-Core, GPU: RTX 2060, RAM: 16 GB (8 GB × 2 GB) DDR4 3,200 MHz.
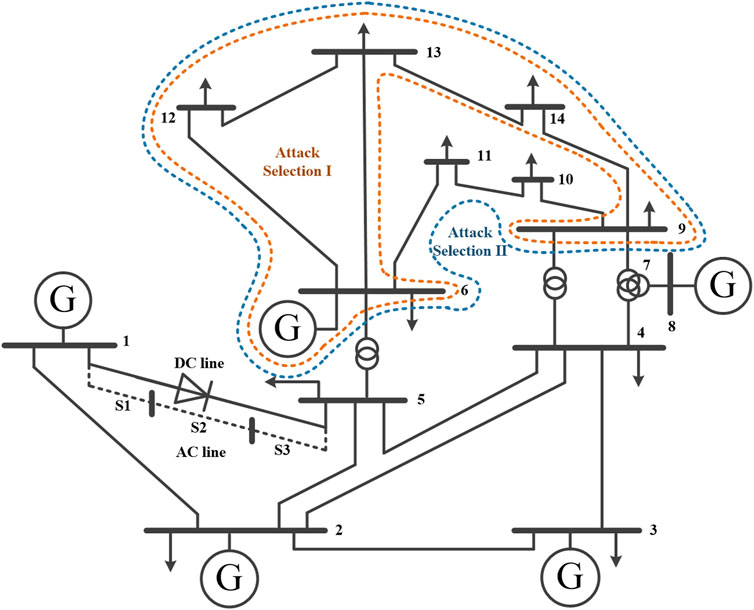
FIGURE 6. The modified IEEE14-node AC/DC hybrid transmission test system.
In this paper, the integer value of 1.25 times the rated apparent power of each line is taken as the upper bound of the capacity of the line. Meanwhile,
According to the derivation of the potential attack selections discussed in Section 3.1, a total of 772 potential attack selections can be found under the given FDI attack constraints. However, after calculating the corresponding consequences, 770 potential attack selections will only cause the changes in power flow, and the remaining two potential attack selections will lead to the load shedding. Therefore, these two attack selections are specifically utilized for load shedding analysis under FDI attack. As shown in Figure 6, there are two attack selections, namely Attack Selection I and Attack Selection II, in which the Attack Selection I contains five target substations: 6, 9, 12, 13, and 14, and the Attack Selection II contains seven target substations: 6, 9, 10, 11, 12, 13, and 14. By solving the lower programming problem described in Section 3.1, the optimal attack vector set
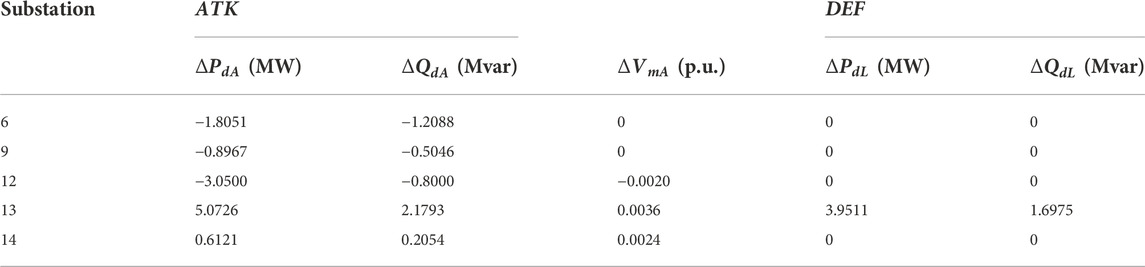
TABLE 3. Optimal
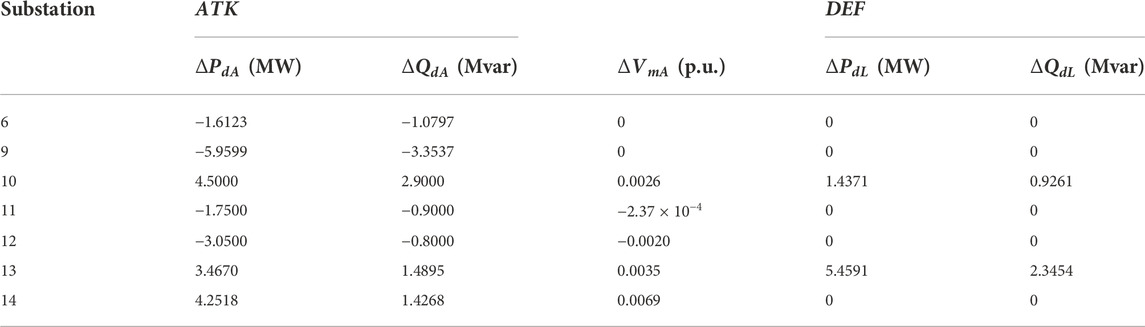
TABLE 4. Optimal
From Tables 3, 4, it can be observed that under the coordinated physical-cyber attack, the total load shedding amount occurred in the Attack Selection I is 3.9511 MW, and that in the Attack Selection II is 6.8962 MW. In addition, the largest load shedding occurs at Substation 13 in the two attack selections.
In order to further validate the effectiveness of the proposed initial particle generation technology and the stability of the IPSO algorithm, the corresponding simulation analysis is carried out based on the
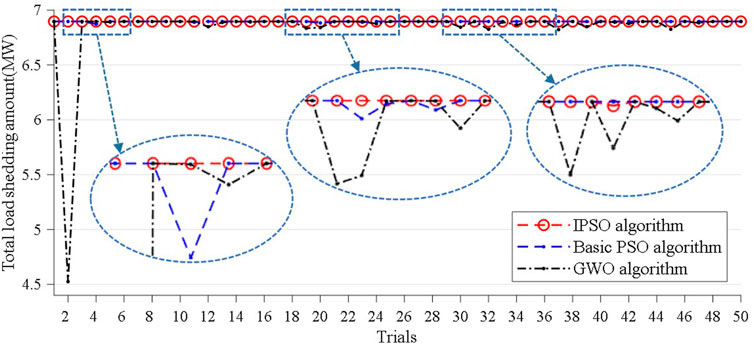
FIGURE 7. Comparison results of the total load shedding amount of three algorithms under 50 independent trials.
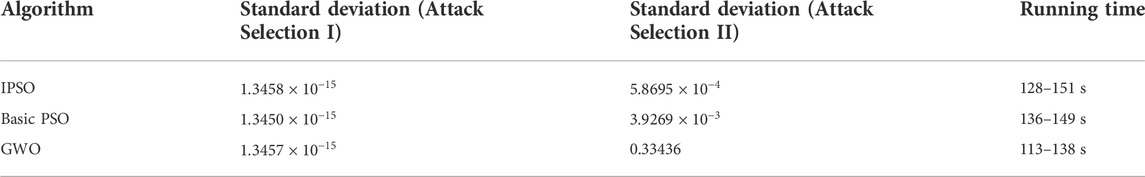
TABLE 5. Simulation results of three algorithms under 50 independent trials.

FIGURE 8. Convergence curves of three algorithms.
In order to explore and exploit the impact of DC transmission line on system risk under the coordinated physical-cyber attacks, the corresponding comparative analysis is conducted between an AC transmission system and the AC/DC hybrid transmission system as shown in Figure 6 under FDI attacks. Regarding the AC transmission system, an AC transmission line consisting of three segments is introduced between node 1 and node 5, and the corresponding line parameters are given in Table 6. Table 7 shows the system load shedding results for the two test systems mentioned above under different attack selections. Moreover, the detailed results of the AC transmission system are provided in Supplementary Material.

TABLE 6. Parameters of the AC transmission line (p.u.).
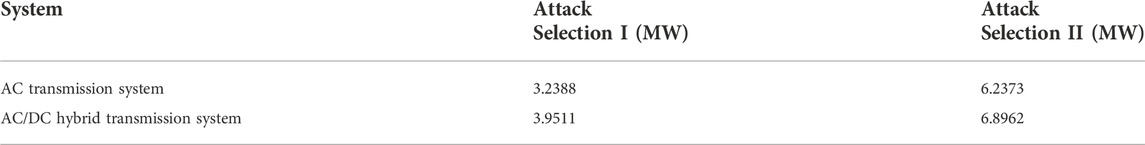
TABLE 7. System load shedding results.
It can be seen from Table 7 that when the attacker performs Attack Selection I, the total load shedding amount for the AC transmission system is 3.2388 MW, while that for the AC/DC hybrid transmission system is 3.9511 MW; when the attacker performs Attack Selection II, the total load shedding amount for the AC transmission system is 6.2373 MW, while that for the AC/DC hybrid transmission system is 6.8962 MW. It can also be found that when there is only a DC transmission line between node 1 and node 5, the total load shedding amount of the system caused by FDI attacks increases by 21.99% and 10.56%, respectively, compared with that when there is only an AC transmission line. Table 8 shows the operating conditions of the DC transmission line before and after the FDI attacks.
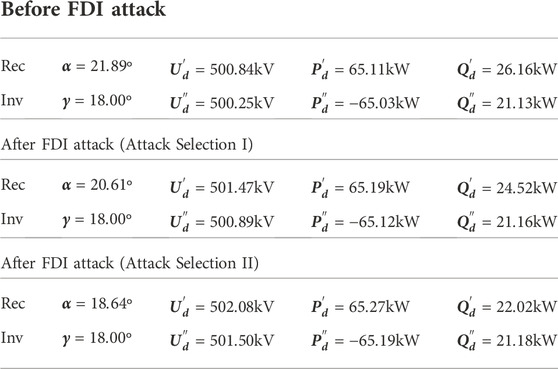
TABLE 8. Operating conditions of the DC transmission line before and after FDI attacks.
It can be found from Table 8 that only the ignition angle changes relatively after the attacker makes the Attack Selection II, and the other measurement data of the DC transmission line are basically not affected by the coordinated physical-cyber attacks. Since the data of DC transmission lines are considered to be untampered, the impact of the corresponding coordinated physical-cyber attack on the measurement data of the DC transmission lines is not significant. Thus, if the attacker could not directly tamper with the data of DC transmission lines, it is difficult to cause the DC blocking.
To sum up, it can be concluded that even if the DC transmission lines can be prevented from cyber attacks, the FDI attacks can still pose threat to the AC/DC hybrid transmission system, so it is necessary to conduct the security risk assessment.
Based on the risk assessment framework described in Section 2, the comprehensive system security risk is conducted in this section. In (Eq. 11), the inherent risk value
Based on the above parameter settings, the corresponding system security risk analysis is carried out, and the following simulation cases are analyzed and discussed elaborately.
1) Case 1: The relatively low budget of defense and attack funds, that is,
2) Case 2: The relatively high budget of defense and attack funds, that is,
3) Case 3: The budget of defense and attack funds is within a certain range, that is,
In case 1,
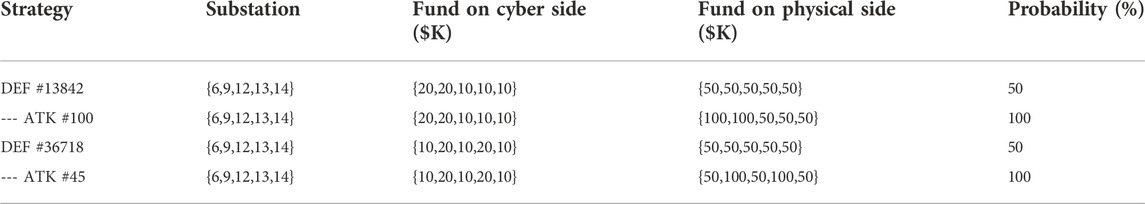
TABLE 9. Subgame perfect Nash equilibrium under specific fund constraints.
From Table 9, it can be found that the attacker will choose the attack strategies performed at Attack Selection I. The active power loss expectation of the test system under the current funding limitations is
In case 2,

TABLE 10. Subgame perfect Nash equilibrium under specific fund constraints.
From Table 10, it can be found that the active power loss expectation of the test system under the current funding limitations is
In case 3,
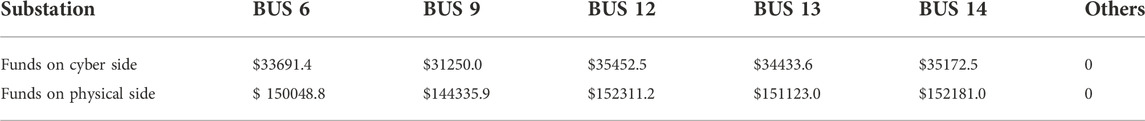
TABLE 11. Overall expectations of the fund deployment of attacker and defender.
From Table 11, it can be seen that the overall expectation of the fund deployment on the cyber side pertinent to the substation 12 is the highest, which means that the cyber side of the substation 12 is the most critical, and it is necessary to strictly investigate the vulnerabilities in the communication network. Meanwhile, the overall expectation of the fund deployment on the physical side pertinent to the substation 12 is the highest, which means that the physical side of the substation 12 is also the most critical, and it is necessary to strictly control the personnel entering and leaving the station, as well as to check the illegal monitoring equipment regularly. To sum up, the substation 12 is identified as the critical substation in the test system.
Figure 9 illustrates the impact of changes in attack and defense funds on the risk expectations of the test system. It can be found that from the attacker’s perspective, the more funds invested in the attack, the higher the risk of the test system caused by the attack. In particular, the more funds invested on the cyber side, the more effective the attack. Similarly, from the defender’s perspective, the more funds invested in the defense, the lower the risk of the test system, and the more funds invested on the cyber side, the better the defense effect, which provides a significant reference for power grid dispatcher to deploy the optimal defense funds.
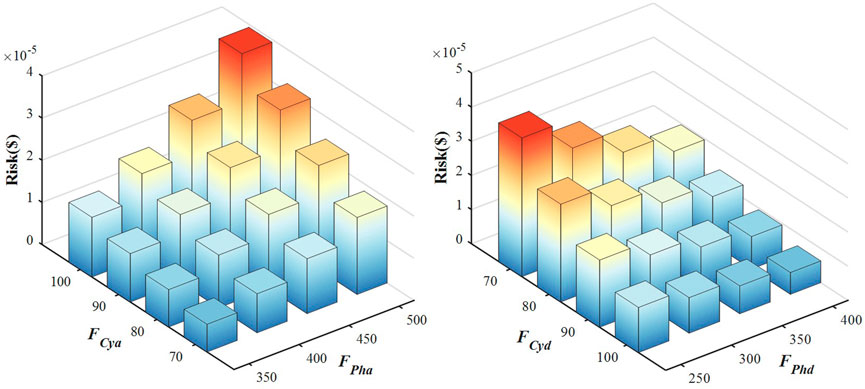
FIGURE 9. The impact of changes in attack and defense funds on the risk expectations of the test system.
This paper investigates the inherent vulnerability of AC/DC hybrid transmission system under the physical-cyber coordinated attacks, and a three-stage physical-cyber attack and defense risk assessment framework based on dynamic game theory is proposed. In the proposed framework, the corresponding deployment of defense funds in stage 1, the deployment of attack funds in stage 2 including how to quantify the success probability of the FDI attack on the substation, and the action of the defender including how to model the FDI attack strategy based on AC state estimation, are analyzed elaborately and carefully. Finally, the dynamic game risk assessment framework is converted into a bi-level programming problem, and the classic BI associated with an IPSO algorithm is applied for the solution of the problem. The simulation results performed on a modified IEEE 14-node AC/DC hybrid transmission test system demonstrate that under the coordinated physical-cyber attacks, the optimal
In the near future, the impact of high proportion of grid-connected clean energy on the system risk will be further investigated under the coordinated physical-cyber attacks.
The datasets presented in this study can be found in online repositories. The names of the repository/repositories and accession number(s) can be found in the article/Supplementary Material.
XL performed the model analysis and algorithm experiment, as well as wrote the manuscript. LS contributed to the model framework and revised the manuscript.
The authors declare that the research was conducted in the absence of any commercial or financial relationships that could be construed as a potential conflict of interest.
All claims expressed in this article are solely those of the authors and do not necessarily represent those of their affiliated organizations, or those of the publisher, the editors and the reviewers. Any product that may be evaluated in this article, or claim that may be made by its manufacturer, is not guaranteed or endorsed by the publisher.
The Supplementary Material for this article can be found online at: https://www.frontiersin.org/articles/10.3389/fenrg.2022.1082442/full#supplementary-material
Aliprantis, C. D. (1999). On the backward induction method. Econ. Lett. 64 (2), 125–131. doi:10.1016/S0165-1765(99)00068-3
Amir, G., Mohammad, M., Anurag, K. S., and Ali, M. S. (2019). “Cyber-physical vulnerability and security analysis of power grid with HVDC line (S. 1-6),” in 2019 North American Power Symposium (NAPS). doi:10.1109/NAPS46351.2019.9000209
Che, L., Liu, X., and Li, Z. (2018). Mitigating false data attacks induced overloads using a corrective dispatch scheme. IEEE Trans. Smart Grid 10 (3), 3081–3091. doi:10.1109/TSG.2018.2817515
Chung, H. M., Li, W. T., Yuen, C., Chung, W. H., Zhang, Y., and Wen, C. K. (2018). Local cyber-physical attack for masking line outage and topology attack in smart grid. IEEE Trans. Smart Grid 10 (4), 4577–4588. doi:10.1109/TSG.2018.2865316
Dai, Q., and Shi, L. (2020). “A game-theoretic analysis of cyber attack-mitigation in centralized feeder automation system,” in 2020 IEEE Power Energy Society General Meeting (PESGM). doi:10.1109/PESGM41954.2020.9281583
Gao, B., and Shi, L. (2020). Modeling an attack-mitigation dynamic game-theoretic scheme for security vulnerability analysis in a cyber-physical power system. IEEE Access 8, 30322–30331. doi:10.1109/ACCESS.2020.2973030
Gao, B., Shi, L., and Ni, Y. (2019). “A dynamic defense-attack game scheme with incomplete information for vulnerability analysis in a cyber-physical power infrastructure,” in 8th Renewable Power Generation Conference. doi:10.1049/cp.2019.0285
Hasan, S., Dubey, A., Karsai, G., and Koutsoukos, X. (2020). A game-theoretic approach for power systems defense against dynamic cyber-attacks. Int. J. Electr. Power & Energy Syst. 115, 105432. doi:10.1016/j.ijepes.2019.105432
Khanna, K., Panigrahi, B. K., and Joshi, A. (2017). Bi-level modelling of false data injection attacks on security constrained optimal power flow. IET Generation, Transm. Distribution 11 (14), 3586–3593. doi:10.1049/iet-gtd.2017.0226
Kundur, P. S., and Malik, O. P. (2022). Power system stability and control. McGraw-Hill Education. https://www.accessengineeringlibrary.com/content/book/9781260473544.
Lakshminarayana, S., Belmega, E. V., and Poor, H. V. (2021). Moving-target defense against cyber-physical attacks in power grids via game theory. IEEE Trans. Smart Grid 12 (6), 5244–5257. doi:10.1109/TSG.2021.3095083
Liang, G., Weller, S. R., Zhao, J., Luo, F., and Dong, Z. Y. (2016). The 2015 Ukraine blackout: Implications for false data injection attacks. IEEE Trans. Power Syst. 32 (4), 3317–3318. doi:10.1109/TPWRS.2016.2631891
Liu, X., and Li, Z. (2016). False data attacks against AC state estimation with incomplete network information. IEEE Trans. Smart Grid 8 (5), 2239–2248. doi:10.1109/TSG.2016.2521178
Liu, Z., and Wang, L. (2021). FlipIt game model-based defense strategy against cyberattacks on SCADA systems considering insider assistance. IEEE Trans. Inf. Forensics Secur. 16, 14. doi:10.1109/TIFS.2021.3065504
Lotfjou, A., Shahidehpour, M., Fu, Y., and Li, Z. (2009). Security-constrained unit commitment with AC/DC transmission systems. IEEE Trans. Power Syst. 25 (1), 531–542. doi:10.1109/TPWRS.2009.2036486
National institute of standards and technology (2022). Nvd - vulnerabilities. https://nvd.nist.gov/vuln (Accessed October 1, 2022).
Nickabadi, A., Ebadzadeh, M. M., and Safabakhsh, R. (2011). A novel particle swarm optimization algorithm with adaptive inertia weight. Appl. Soft Comput. 11 (4), 3658–3670. doi:10.1016/j.asoc.2011.01.037
Qiu, W., Sun, K., Yao, W., Wang, W., Tang, Q., and Liu, Y. (2021). Hybrid data-driven based HVdc ancillary control for multiple frequency data attacks. IEEE Trans. Industrial Inf. 17 (12), 8035–8045. doi:10.1109/TII.2021.3063270
Rahman, M. A., and Mohsenian-Rad, H. (2013). “False data injection attacks against nonlinear state estimation in smart power grids,” in 2013 IEEE Power & Energy Society General Meeting. doi:10.1109/PESMG.2013.6672638
Ranjbar, M. H., Kheradmandi, M., and Pirayesh, A. (2019). Assigning operating reserves in power systems under imminent intelligent attack threat. IEEE Trans. Power Syst. 34 (4), 2768–2777. doi:10.1109/TPWRS.2019.2897595
Sanjab, A., and Saad, W. (2016). Data injection attacks on smart grids with multiple adversaries: A game-theoretic perspective. IEEE Trans. Smart Grid 7 (4), 2038–2049. doi:10.1109/TSG.2016.2550218
Shan, X. G., and Zhuang, J. (2020). A game-theoretic approach to modeling attacks and defenses of smart grids at three levels. Reliab. Eng. Syst. Saf. 195, 106683. doi:10.1016/j.ress.2019.106683
Shao, C. W., and Li, Y. F. (2021). Optimal defense resources allocation for power system based on bounded rationality game theory analysis. IEEE Trans. Power Syst. 36 (5), 4223–4234. doi:10.1109/TPWRS.2021.3060009
Tian, M., Dong, Z., and Wang, X. (2021). Analysis of false data injection attacks in power systems: A dynamic bayesian game-theoretic approach. ISA Trans. 115, 108–123. doi:10.1016/j.isatra.2021.01.011
Wächter, A., and Biegler, L. T. (2006). On the implementation of an interior-point filter line-search algorithm for large-scale nonlinear programming. Math. Program. 106 (1), 25–57. doi:10.1007/s10107-004-0559-y
Wang, K., Du, M., Maharjan, S., and Sun, Y. (2017). Strategic honeypot game model for distributed denial of service attacks in the smart grid. IEEE Trans. Smart Grid 8 (5), 2474–2482. doi:10.1109/TSG.2017.2670144
Wang, Q., Tai, W., Tang, Y., Ni, M., and You, S. (2019). A two-layer game theoretical attack-defense model for a false data injection attack against power systems. Int. J. Electr. Power & Energy Syst. 104, 169–177. doi:10.1016/j.ijepes.2018.07.007
Wei, L., Sarwat, A. I., and Saad, W. (2016). Stochastic games for power grid protection against coordinated cyber-physical attacks. IEEE Trans. Smart Grid 9 (2), 684–694. doi:10.1109/TSG.2016.2561266
Xiang, Y., Wang, L., and Zhang, Y. (2018). Adequacy evaluation of electric power grids considering substation cyber vulnerabilities. Int. J. Electr. Power & Energy Syst. 96, 368–379. doi:10.1016/j.ijepes.2017.10.004
Xu, L., Guo, Q., Sheng, Y., Muyeen, S. M., and Sun, H. (2021). On the resilience of modern power systems: A comprehensive review from the cyber-physical perspective. Renew. Sustain. Energy Rev. 152, 111642. doi:10.1016/j.rser.2021.111642
Yuan, Y., Li, Z., and Ren, K. (2011). Modeling load redistribution attacks in power systems. IEEE Trans. Smart Grid 2 (2), 382–390. doi:10.1109/TSG.2011.2123925
Zhang, Z., Huang, S., Chen, Y., Li, B., and Mei, S. (2021). Cyber-physical coordinated risk mitigation in smart grids based on attack-defense game. IEEE Trans. Power Syst. 37 (1), 530–542. doi:10.1109/TPWRS.2021.3091616
Keywords: AC/DC hybrid transmission system, false data injection attack, game theory, Nash equilibrium, risk assessment
Citation: Liu X and Shi L (2023) A dynamic game model for assessing risk of coordinated physical-cyber attacks in an AC/DC hybrid transmission system. Front. Energy Res. 10:1082442. doi: 10.3389/fenrg.2022.1082442
Received: 28 October 2022; Accepted: 25 November 2022;
Published: 23 January 2023.
Edited by:
Zhiyi Li, Zhejiang University, ChinaReviewed by:
Jiwei Tian, Air Force Engineering University, ChinaCopyright © 2023 Liu and Shi. This is an open-access article distributed under the terms of the Creative Commons Attribution License (CC BY). The use, distribution or reproduction in other forums is permitted, provided the original author(s) and the copyright owner(s) are credited and that the original publication in this journal is cited, in accordance with accepted academic practice. No use, distribution or reproduction is permitted which does not comply with these terms.
*Correspondence: Libao Shi, c2hpbGJAc3oudHNpbmdodWEuZWR1LmNu
Disclaimer: All claims expressed in this article are solely those of the authors and do not necessarily represent those of their affiliated organizations, or those of the publisher, the editors and the reviewers. Any product that may be evaluated in this article or claim that may be made by its manufacturer is not guaranteed or endorsed by the publisher.
Research integrity at Frontiers
Learn more about the work of our research integrity team to safeguard the quality of each article we publish.