 Rui Su1
 Guobin He
- 1Dali Power Supply Bureau of Yunnan Power Grid Co., Ltd., Dali, China
- 2Electric Power Research Institute of Yunnan Power Grid Co., Ltd., Kunming, China
- 3Grid Planning Research Center of Yunnan Power Grid Co., Ltd., Kunming, China
In recent years, with the rapid development of renewable energy, the penetration rate of renewable energy generation in the active distribution network (ADN) has increased. Because of the instability of renewable energy generation, the operation stability of ADN has decreased. Due to the ability to cut peak load and fill valley load, battery energy storage systems (BESSs) can enhance the stability of the electric system. However, the placement and capacity of BESSs connected to ADN are extremely significant, otherwise, it will lead to a further decline in the stability of ADN. To ensure the effectiveness of the BESSs connected to the grid, this work uses the fuzzy kernel C-means (FKCM) method for scene clustering. Meanwhile, a multi-objective optimization model of BESS configuration is established with the objective of BESS configuration cost, voltage fluctuation, and load fluctuation, and solved by non-dominated sorting genetic algorithm-II (NSGA-II). In this work, the grey target decision method based on the entropy weight method (EWM) is used to obtain the optimal compromise solution from the Pareto non-dominated set. Moreover, the proposed method is tested and verified in the extended IEEE-33 node system and the extended IEEE-69 node system. The results show that the BESSs configuration scheme obtained by NSGA-II can effectively reduce the fluctuation of voltage and load, and improve the stability of ADN operation.
1 Introduction
With the continuous development and progress of society and technology, traditional energy sources based on fossil fuels have become difficult to meet the needs of human society. Nowadays, thermal power generation is still the main way for people to obtain electric energy. However, the harmful gases emitted by the combustion of fossil fuels have become a problem, and the combustion of fossil fuels is aggravating environmental pollution and global warming (Company, 2021; Zandalinas et al., 2021). At present, energy storage and environmental pollution issues have become two serious challenges to the sustainable development of society. It is urgent to reduce carbon emissions and build a new type of power system with renewable energy sources as the main body (He et al., 2021; Dong et al., 2022).
The new power grid with photovoltaic and wind energy as the main energy structure has the advantage of a flexible power supply, so it is a better solution to the power supply problem of the grid (Bin et al., 2019; Li et al., 2022a). However, photovoltaic, wind power has obvious characteristics of randomness, volatility, and intermittency, its intermittency, and volatility will harm the quality of the power supply. And photovoltaic, wind power needs to go through the power electronic equipment to achieve energy control and does not have the power grid frequency, voltage regulation, and other functions. Renewable energy also has the characteristics of dispersion, when the renewable energy to a high penetration rate into the grid will aggravate the impact caused by the volatility, such as voltage deviation, power loss, etc. (Hu et al., 2022; Xiao and Pan, 2022).
Distributed generation (DG) and energy storage systems (ESSs) play an important role in power grids with high renewable energy generation penetration rates (Wu et al., 2021a; Shi et al., 2022). On the one hand, as an independent power supply compatible with the environment on the user side, DG can meet the peaking demand of the power system and supply power to remote users, and commercial and residential areas, it also can save transmission investment and reduce transmission losses. On the other hand, because the DG is mostly renewable energy generation, its output has obvious randomness and intermittency, which affects the voltage stability of the active distribution network (ADN), changes the direction of the ADN power flow, and causes the system power flow to be random. When large-scale renewable energy generation access to ADN will cause power flow and voltage over-limit, change the voltage characteristics, and reduce the stability of ADN. Furthermore, the role of DG in ADN is mostly used as a backup power supply, which is easy to cause the voltage and frequency of the ADN to drop and exceed the limit during the power switching process. Even so, DG is still considered by many energy and power system experts as the main way to increase the utilization of renewable energy and improve the stability and flexibility of ADN (Yang et al., 2021; Wu et al., 2022).
ESSs can effectively solve various energy supply and demand balance problems and improve energy utilization efficiency through their peak-shaving and flexible energy management capabilities. Meanwhile, the ESSs can effectively solve serious problems such as power flow reverse and voltage over-limit which occur in the ADN after DG access, and ensure the normal operation of the distribution network (Li et al., 2018). Battery energy storage systems (BESSs), which use batteries as energy storage carriers, have become a hot topic of current research due to their high energy density, fast response time, and modularity (Das et al., 2018; Wu et al., 2021b). BESS can effectively solve various supply-demand imbalance and power quality problems by using high energy density to cut peaks and fill valleys on the network and using high power density to smooth out random power fluctuation (Liu et al., 2016; Zheng, 2018; Ren et al., 2019; Yang et al., 2020).
After the ESSs are connected to the ADN, the operating state of the ADN and the ability of peak cutting are affected by the access mode, location, and capacity. In recent years, many scholars have studied the planning of ESSs, however, most of the research models are single-objective models, and these models are difficult to consider the stability of the network and the economics of energy storage at the same time. Reference (Yan et al., 2013) established an optimal value assessment model of BESSs with net income as the objective function. The reference (Su et al., 2016) established a planning model for the location and capacity of distributed power and energy storage devices with the cost input of ADN as the objective function. Literature (Lee and Chen, 1995) constructed an energy storage planning model with the cost of electricity purchased by customers as the objective function. Reference (Ghatak et al., 2019) established an energy storage planning model with battery storage life as the objective function and quantified the battery characteristic parameters by combining three characteristics of battery discharge depth, discharge rate, and effective discharge volume. In reference (Chen, 2020), an energy storage planning model has been established with the objective function of accurately tracking real-time meteorological conditions, and an improved logistic regression model was used to evaluate the impact of real-time numerical meteorological conditions on the device. All the above research models are single-objective planning models, which do not consider the coupling problem between ESSs planning and network operation conditions. The reference (Fu et al., 2022) established a multi-objective optimal configuration model with the economic benefits of ESSs and voltage quality as the optimization objectives. However, the voltage quality does not fully reflect the real operating condition of the network after accessing ESSs. Therefore, building a multi-objective optimal allocation model for ESSs can not only fully exploit the potential of ESSs, but also achieve a better balance between the economic benefits of ESSs and network stability.
In most papers, the multi-objective optimization problem is weighted into a single objective problem by the weighting method. However, it is difficult to guarantee the objectivity of the planning scheme solved by this method. In this regard, some studies used a bi-level planning model to solve the different problems of BESSs location and capacity sizing (Li et al., 2022b). The reference (Meng et al., 2021) proposed a bi-layer BESSs planning scheme considering renewable energy and load uncertainties. The optimal solution of this model can solve the problem of objectivity in the single-objective model, but the two-layer model is complex, and difficult to obtain the optimal solution. ESSs location and capacity sizing is a high-dimensional, multi-objective, complex constraints problem. The solution process of traditional planning methods is complex and easy to fall into local optimum. Therefore, it is very important to establish a Pareto-based multi-objective model. This model can well adjust the balance between various optimization variables in multi-objective optimization problems and ensure that the results have good objectivity.
This work is based on the non-dominated sorting genetic algorithm-II (NSGA-II), which shows a high optimization performance under several standard function test environments. The main content of this work is as follows:
(1) A multi-objective planning optimal location and capacity model based on the Pareto of BESSs is established with three objectives, and NSGA-II is used to solve this multi-objective model;
(2) The clustering algorithm is used to cluster the daily load, wind power, and photovoltaic (PV) output curves of the whole year, and the typical scenarios are obtained based on the combination of time series characteristics. Simulation calculations are performed in different typical scenarios to obtain the sum of each objective function throughout the year;
(3) The simulation based on the extended IEEE-33 node system and the extended IEEE-69 node system verifies that the proposed method can effectively obtain the optimal BESSs configuration method.
2 Battery energy storage systems configuration model
2.1 Objective function
In this work, the total investment operating cost of the BESSs, the total load fluctuation of ADN, the total voltage fluctuation of ADN, and the BESSs configuration optimization model based on Pareto can be established as follows:
where
2.1.1 Total investment operating cost
The research object of this work is the ADN that has been built, so the total investment cost of BESS can be described as follow:
where
(1) Equivalent investment cost
where
(2) Operation and maintenance cost
where
(3) Government subsidies
where
(4) Wind and solar abandonment cost
where
(5) Cost of power loss
(6) Cost of carbon emissions from peak shaving of conventional power sources
where
2.1.2 Total load fluctuation of active distribution network
where
2.1.3 Total voltage fluctuation of active distribution network
where
3 Constraints
3.1 Node voltage
where
where,
3.2 Installation node
where
3.3 Wind and solar abandonment
where
4 Non-dominated sorting genetic algorithm-II for optimal battery energy storage systems placement and sizing
4.1 Non-dominated sorting genetic algorithm-II
NSGA-II has diverse populations and high-accuracy optimization results. Firstly, the algorithm uses a fast non-dominated sorting method to classify the population into different ranking levels. Secondly, the crowding distance between individuals with the same ranking level is calculated, and individuals with a larger crowding distance are selected. The results can be evenly distributed in the target space, thus maintaining the diversity of the population. Finally, the optimal solution in the Pareto solution set is effectively saved by the elite strategy (Wu et al., 2014).
(1) Non-dominated solution set ranking
The non-dominated solution in the population can be determined by calculating the value of the objective function. According to the non-dominated level of each individual in the population, the whole population is sorted hierarchically.
(2) Calculate the crowding distance
To further select individuals at the same non-dominated level, the crowding distance between individuals needs to be calculated.
where
Then through the binary tournament selection method, two individuals are randomly selected, and the individuals with higher non-dominated levels can enter the next population. If the level is the same, choose the more crowded population.
(3) Elite strategy selection method
The simulated binary method is used to cross and polynomially mutate the population. Finally, the parent population and offspring population are combined to form a new population. The above steps should be repeated until the maximum number of iterations is reached, and output the Pareto optimal solution set.
4.2 Pareto solution set processing
In the process of NSGA-II algorithm optimization, the Pareto solution set will be continuously updated and put into a limited scale storage pool. When the algorithm iteratively obtains a new non-dominated solution, it needs to compare it with the non-dominated solution set in the storage pool, and then determine whether the new non-dominated solution is liberated into the storage pool. The judgment process is as follows (Faramarzi et al., 2020):
(1) If the new solution dominates the storage pool, it is replaced with the new solution;
(2) If the new solution is dominated by at least one solution in the storage pool, the new solution is discarded;
(3) If there is no dominant relationship between the new solution and the storage pool, the new solution is liberated into the storage pool.
To increase the diversity of solutions, when the number of non-dominated solutions in the archive set is higher than the upper limit, the redundant solutions must be removed. In this work, we use the crowded distance ranking method to select a densely distributed set of non-dominated solutions and eliminate redundant solutions by the roulette wheel method.
4.3 Multi-objective gray target decision based on entropy weight method
A multi-objective gray target decision based on the entropy weight method (EWM) is designed. Firstly, the evaluation indexes of each solution are set to build the sample matrix, and the decision matrix can be built by normalizing the sample matrix. Then, the weights of evaluation indexes of all Pareto non-dominated solutions and their distances from the target are obtained based on EWM and their distances from the target, and the solution with the closest distance to the target is determined as the best compromise solution for the BESS optimal allocation scheme (He et al., 2021).
(1) Establishing the sample matrix
To evaluate the similarity and equilibrium of each solution, this method adds two indicators in the sample matrix. One is the Euclidean distance (ED) between each solution and the ideal point, and the other is the Mahalanobis distance (MD) between each solution and the equilibrium point. Therefore, the sample matrix of effects containing five evaluation metrics can be expressed as:
where E and M denote the ideal point distance matrix and equilibrium point distance matrix of all solutions, respectively. The ED between the
where
(2) Design of decision matrix
According to the principle of rewarding good and punishing bad, the following operator is designed:
where
Then the decision matrix is established, as follows:
The target is identified in the gray decision region formed by the decision matrix as follows:
(3) Grey target decision based on EWM
First, the target weight of the
Next, the entropy values of the
Among them, the smaller the entropy value of the indicator tends to contain more information, so the entropy weight is larger. The entropy weight of the
Then, the distance of each solution to the target can be calculated as follows:
Finally, the target distance of each solution is sorted, and the solution closest to the target is selected as the best decision. The specific process of Table 1 NSGA-II solving the optimization problem of BESSs is shown in Figure 1. The basic principles and procedures of NSGA-II are as follows:
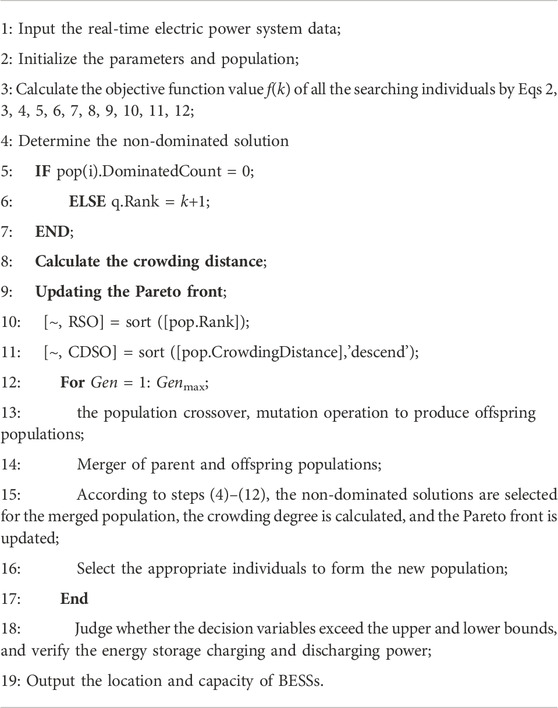
TABLE 1. The basic principles and procedures of NSGA-II.
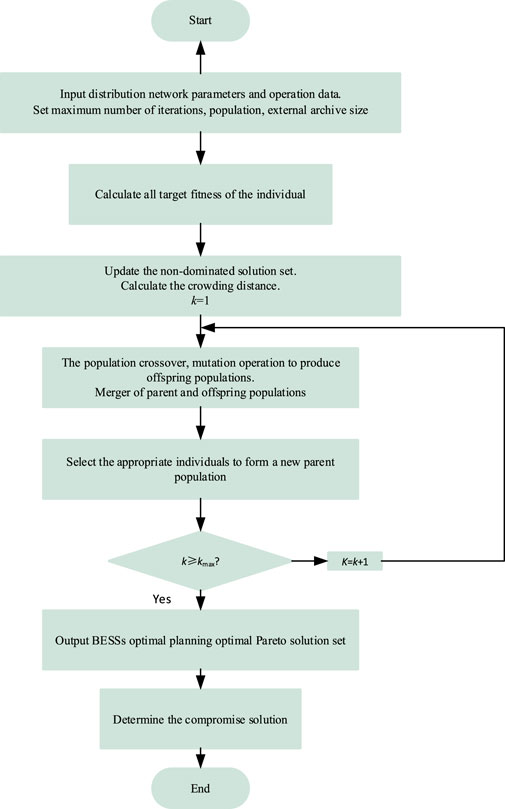
FIGURE 1. The flowchart diagram of the NSGA-II used for BESSs.
5 Fuzzy kernel C-means-based scene clustering
The most well-known and commonly used clustering methods are the K-means (Kanungo et al., 2002) clustering algorithm and the fuzzy C-means (FCM) clustering algorithm (Pal and Bezdek, 1995), (Askari, 2021). The K-means is simpler and more efficient, with the advantages of fast convergence and low linear complexity, but it is not applicable when the data set size is large and is sensitive to the initial clustering center. Moreover, its membership degree is either 0 or 1, which is a hard classification. In contrast, the membership degree of the FCM takes any value in the range of [0,1], and the criterion function is differentiable, which can The FCM clustering algorithm has any value in the range of [0, 1], and the criterion function is differentiable so that it can accurately cluster data with the non-convex distribution. To avoid the influence of non-uniform sample distribution on clustering results, this work uses a fuzzy kernel C-means (FKCM) clustering algorithm based on the Mercer kernel function to cluster ADN source-load scenarios.
The clustering principle of the FKCM clustering algorithm in the feature space is to minimize the weighted distance squared between a sample and its clustering center squared sum, which is described as follows:
where
The typical days of wind power and photovoltaic in each season can be obtained by the FKCM clustering algorithm, and then the clustering results of typical days in each season are combined. Therefore, there are a total of 36 source-load combination scenario sets in the four seasons (for example, spring wind power output 1, spring photovoltaic output 2, and spring load can be combined into one scenario set). Although various ADN operation scenarios can make the planning results more reasonable, it will significantly increase the solution time of the configuration model. Therefore, this paper uses the probability distribution method to reduce the large number of operation scenarios generated based on the FKCM clustering algorithm, and finally fits out the source-load scenarios of four seasons.
First, the probability of each scenario in each season can be calculated as follows:
where
Then, based on the probability distribution of each scenario, the typical scenarios of each season are fitted to obtain four scenarios of spring, summer, autumn, and winter considering source-load uncertainty. The scenario fitting for each season is as follows:
where
The fitted wind, photovoltaic, and load curves of four typical scenarios in spring, summer, autumn, and winter are shown in Figure 2.
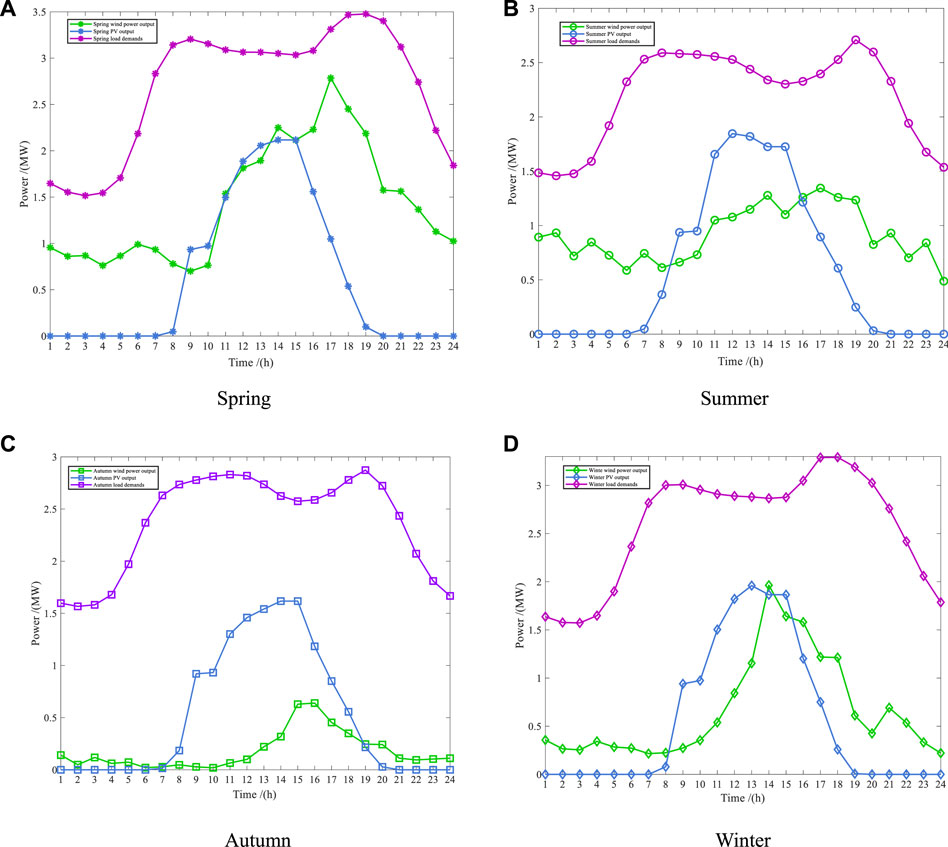
FIGURE 2. Typical diurnal curves of load, wind and PV power. (A) Spring. (B) Summer. (C) Autumn. (D) Winter.
6 Case studies
In this work, the extended IEEE-33 node test system and the extended IEEE-69 node test system are used to prove that NSGA-II can get the correct BESSs configuration scheme. And this scheme can effectively improve the voltage quality problem in ADN caused by the high renewable energy generation penetration rate. Table 2 shows the main parameters of the ADN.
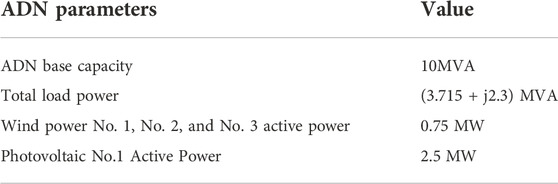
TABLE 2. Main parameters of ADN.
6.1 IEEE-33 node test system
The extended IEEE-33 node test system topology is shown in Figure 3. Wind power No. 1, No. 2, and No. 3 are connected at nodes 8, 24, and 17, respectively, and PV is connected at node 31. Table 1 shows the main parameters of ADN.
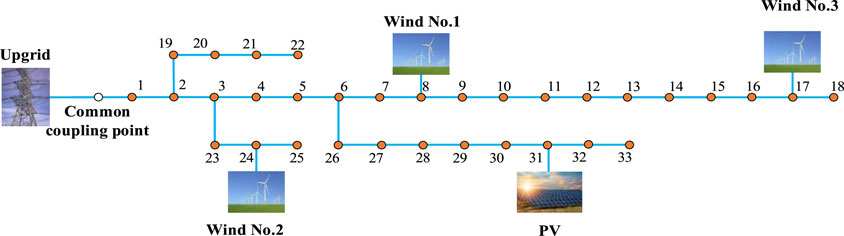
FIGURE 3. Topology of the extended IEEE-33 node test system.
Table 3 shows the specific configuration scheme of BESSs. Table 4 shows the numerical changes of specific indicators in ADN before and after the access of the BESSs configuration scheme obtained by NSGA-II. By comparing the data in Table 4, after accessing BESSs, specifically, daily voltage fluctuation decreased by 4.8484 p. u. (the improvement rate is 38.54%), and the load fluctuation decreased by 2.4941 MW (the improvement rate is 37.77%). The total cost of BESSs is $-1.92e+03, which means a profit of $ 1.92e+03 a year after BESSs configuration. Moreover, Figure 4 compares the changes of three technical indicators of the ADN before and after the access of BESSs. As shown in Figure 4A, after BESSs is connected to the active distribution network, the node voltage level generally has an upward trend (at 1p.u. nearby). Meanwhile, it can be seen from Figure 4B that the average voltage fluctuation of nodes in the ADN decreases in 1 day. This means that BESSs can effectively improve the voltage quality of ADN. At last Figure 5 shows the charge and discharge power of BESSs in a day.
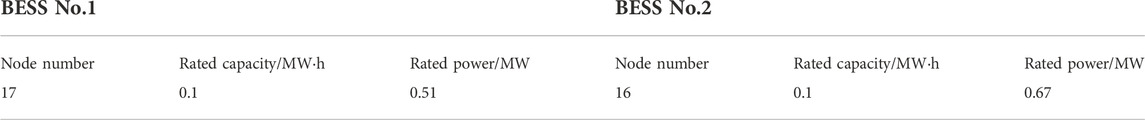
TABLE 3. BESSs optimal configuration scheme.
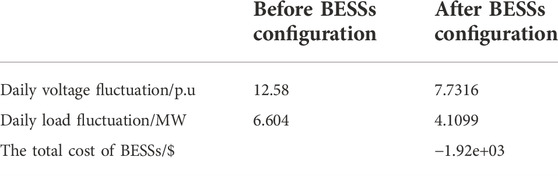
TABLE 4. Comparison before and after BESSs configuration.
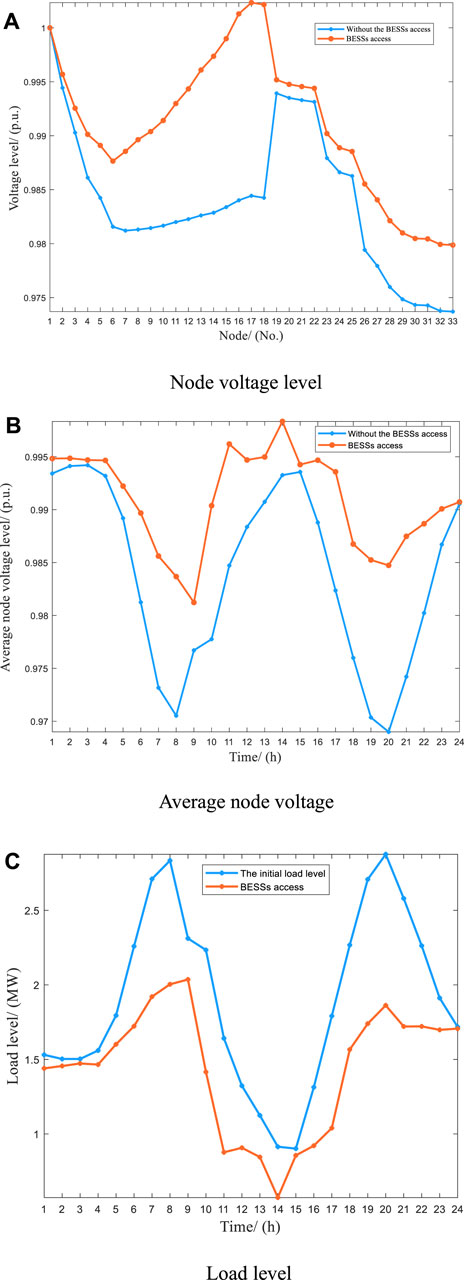
FIGURE 4. Optimization results of network obtained by NSGA-II in the extended IEEE-33 node test system. (A) Node voltage level. (B) Average node voltage. (C) Load level.
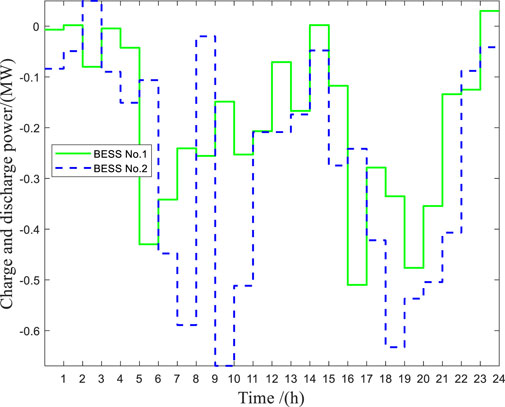
FIGURE 5. BESSs charge and discharge power in a day under IEEE-33 node system.
6.2 IEEE-69 node test system
The extended IEEE-69 node test system topology is shown in Figure 6. Wind power No. 1, No. 2, and No. 3 are connected at nodes 24, 34, and 44, respectively, and PV is connected at node 64.
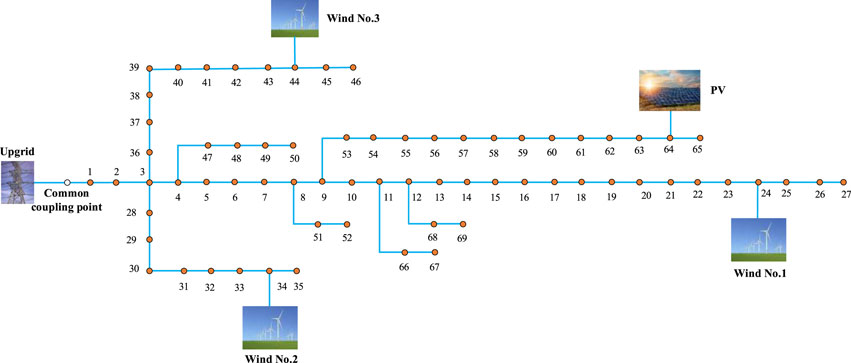
FIGURE 6. Topology of the extended IEEE-69 bus system.
Table 5 shows the specific configuration scheme of BESSs. By comparing the data in Table 6, after accessing BESSs, specifically, the daily voltage fluctuation decreased by 8.095 p. u. (the improvement rate is 22.058%), and the load fluctuation decreased by 2.4481 MW (the improvement rate is 37.07%). Moreover, Figure 7 compares the changes in three technical indicators of the ADN before and after the access of BESSs. The total cost of BESSs is $ -1.2e+03. Figure 7 shows the three technical indicators before and after the access of BESSs. In Figure 7A, the node voltage level of node 57-node 65 has been greatly improved, and the curve in Figure 7B also shows that the voltage fluctuation of ADN has been effectively reduced after BESSs access. It can be concluded that by installing BESSs in the ADN, the power quality in the ADN has been improved, and the revenue can be $1.2e+03. And Figure 8 shows the charge and discharge power in a day under the extended IEEE-69 node system.
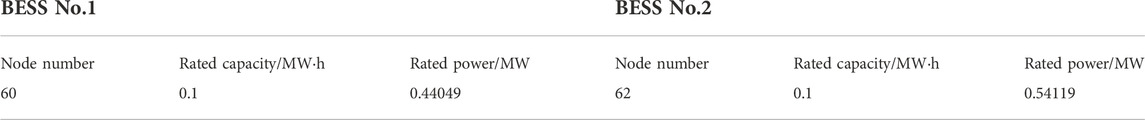
TABLE 5. BESSs optimal configuration scheme.
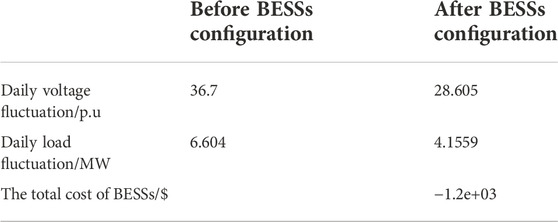
TABLE 6. Comparison before and after BESSs configuration.
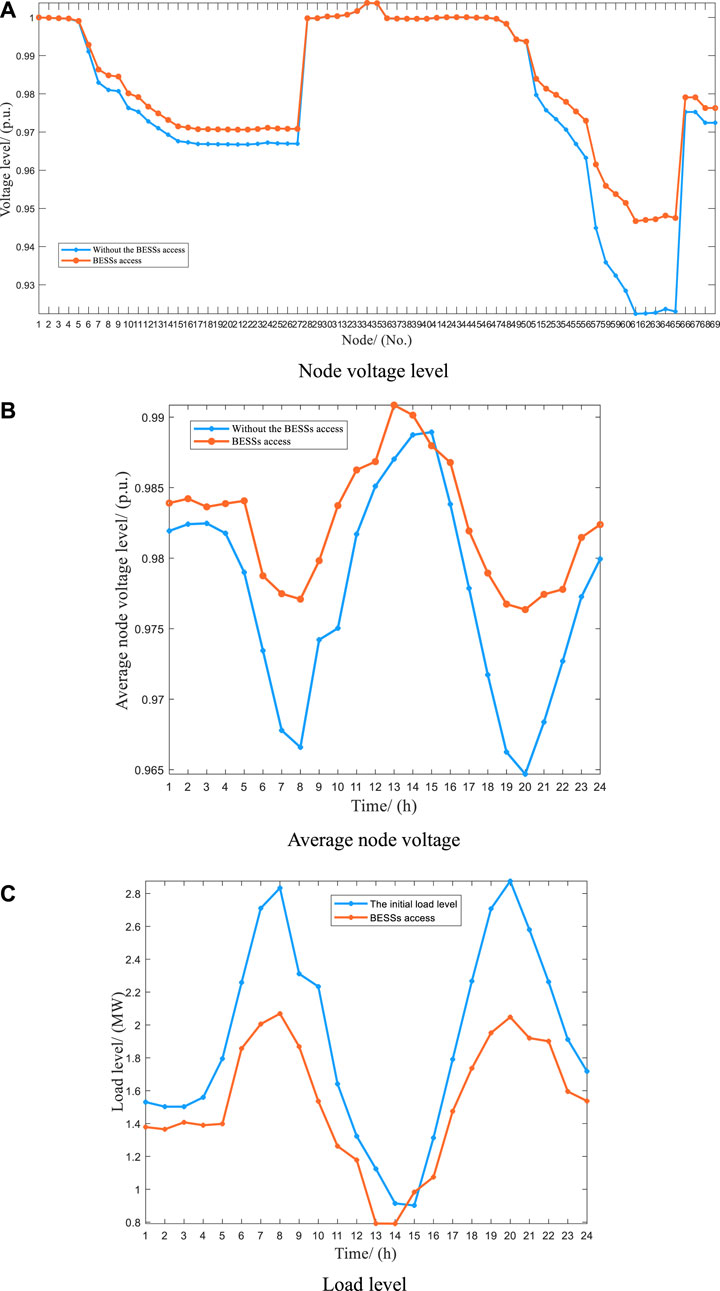
FIGURE 7. Optimization results of network obtained by NSGA-II under the extended IEEE-69 node test system. (A) Node voltage level. (B) Average node voltage. (C) Load level.
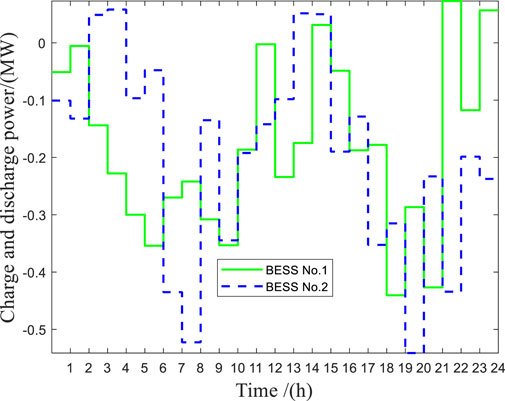
FIGURE 8. BESSs charge and discharge power in a day under the extended IEEE-69 node test system.
6.3 Comparison of algorithms
In this section, we use multi-objective particle swarm optimization (MOPSO) as a comparison algorithm to verify the superiority of NSGA-II. Table 7 shows the result obtained by two algorithms.
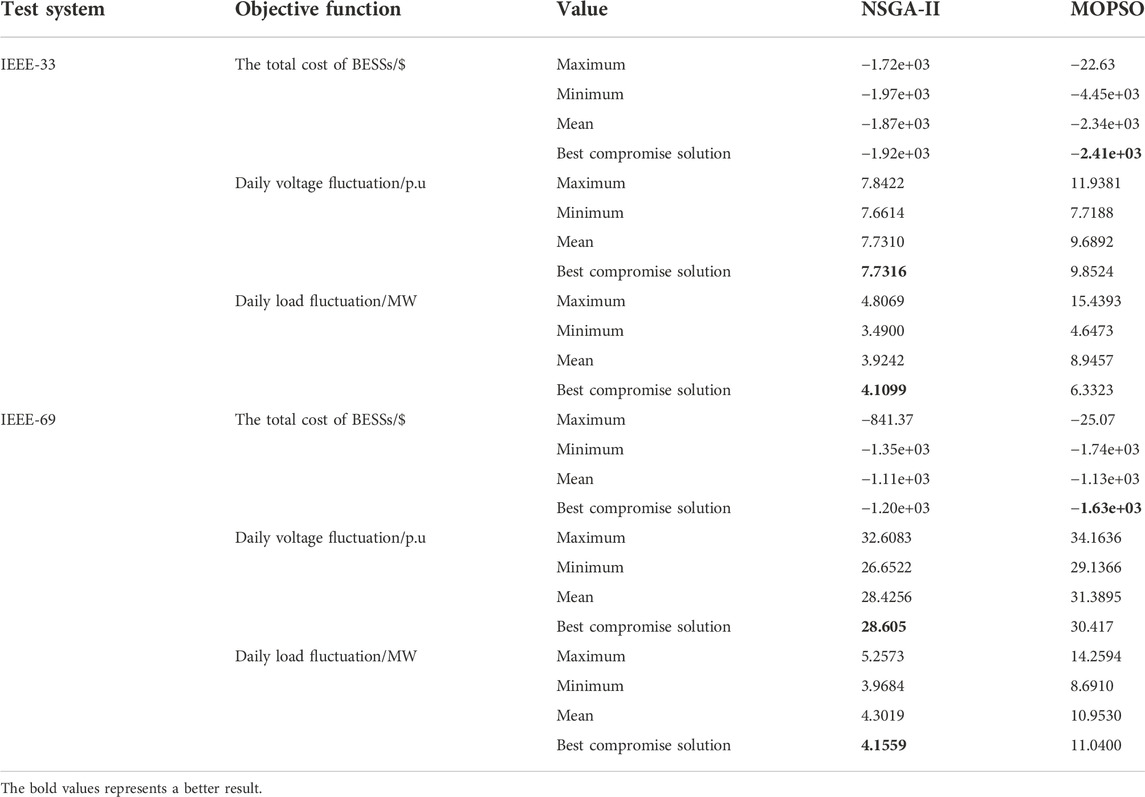
TABLE 7. Pareto optimization results of the model obtained by two algorithms.
By comparing the results in Table 7, it can be seen that NSGA-II has the smallest daily voltage fluctuation and daily load fluctuation except for the total cost of BESSs. Meanwhile, the cost results obtained by the two algorithms are not much different. Therefore, it can be concluded that NSGA-II can obtain a more reasonable Pareto non-dominated solution set and provide the best candidate for decision makers.
6.4 Discussion
Figure 9 shows the Pareto front distribution obtained by NSGA-II in the simulation experiments based on the extended IEEE-33 node test system and the extended IEEE-69 node test system. It can be seen from Figure 9 that the NSGA-II can obtain a widely distributed Pareto front. This proves the effectiveness and powerful optimizing ability of NSGA-II algorithm.

FIGURE 9. The Pareto front distribution obtained by NSGA-II. (A) The Pareto front distribution based on the extended IEEE-33-node test system. (B) The Pareto front distribution based on the extended IEEE-69-node test system.
To verify the rationality of the EWM-based grey target decision, this work uses the method in Reference (Hu et al., 2014) to map the
where
Figure 10 shows a two-dimensional plane (
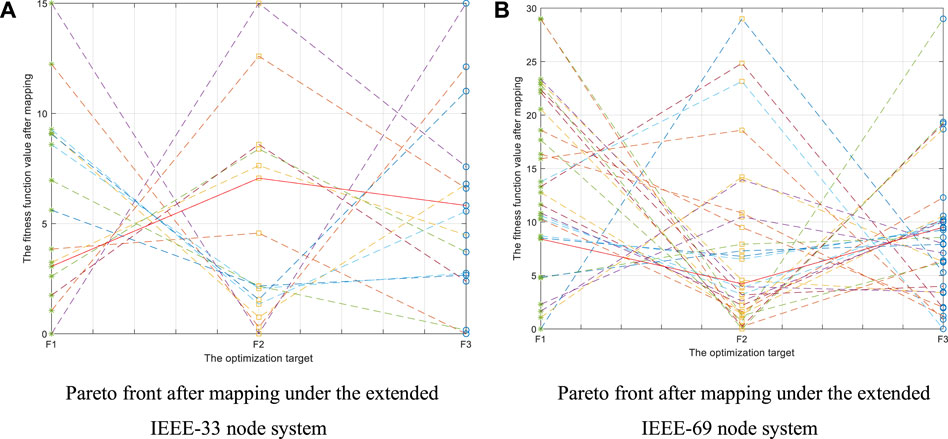
FIGURE 10. The Pareto front of the parallel coordinate system under the extended IEEE-33 node system and the extended IEEE-69 node system. (A) Pareto front after mapping under the extended IEEE-33 node system. (B) Pareto front after mapping under the extended IEEE-69 node system.
It should be noted that at 1 p.m. of Figure 4C and 1 and 2 p.m. of Figure 7C, the load level of the ADN with BESS drops to a very low level. This is because when configuring BESSs, the cost of configuring BESSs is considered an important factor. At 1 and 2 p.m. every day, it is in the peak load period. At this time, the load of the ADN increases, and the BESSs will deliver more electricity to the ADN to obtain more benefits while ensuring the stability of the ADN. The net load
where
7 Conclusion
To deal with the low stability of the ADN caused by the high proportion of renewable energy generations, this work proposes a configuration method of a Pareto multi-objective battery ESSs based on NSGA-II to improve the stability of the ADN. The main contributions of this work are:
(1) The clustering algorithm based on FKCM is used to cluster the load and wind-solar output, and four clustering scenarios are obtained.
(2) The grey target decision based on EWM is used to obtain the optimal compromise solution from the Pareto front, to get rid of the unreasonable favoritism caused by weighting multiple objectives with subjective weights.
(3) The extended IEEE-33 node system and the extended IEEE-69 node system are used for simulation experiments. The experimental results show that NSGA-II can balance the economy of BESSs configuration and stabilize the power and voltage levels of the ADN. Therefore, the BESSs configuration scheme obtained by the method described in this work is effective and can improve the stability of ADN operation.
In practice, the scale of ADN is large and more constraints need to be considered, which is a great challenge to the performance of the algorithm. At the same time, the heuristic algorithm has strong randomness, and the best compromise solution obtained each time is different. Therefore, it is more subjective to select the final solution from multiple optimal compromise solutions. However, compared with traditional optimization methods, heuristic algorithms do not require accurate models and a large amount of data. The algorithm structure is simple and efficient, which greatly improves the calculation speed and efficiency, and it is easier to obtain the global optimal solution, making the configuration of ESSs more reasonable. Therefore, considering the accuracy, effectiveness and time cost of the algorithm, the heuristic algorithm has more advantages than other traditional methods.
In future research, the NSGA-II algorithm will be applied to the BESSs planning problem considering the demand side response and the optimization problem of the electricity-hydrogen hybrid ESSs.
Data availability statement
The original contributions presented in the study are included in the article/supplementary material, further inquiries can be directed to the corresponding author.
Author contributions
RS: writing the manuscript; GH: discussion of the objective functions; SS: discussion of the constrains; YD: discussion of the algorithm; JC and HC: completion of the experimental test; KW: editing; CZ: discussion of the topic.
Acknowledgments
The authors gratefully acknowledge the support of Enhancement Strategy of Multi-type Energy Integration of Active Distribution Network (YNKJXM20220113).
Conflict of interest
RS, GH, SS, YD, JC, HC, KW, and CZ were employed by Dali Power Supply Bureau of Yunnan Power Grid Co., Ltd., Electric Power Research Institute of Yunnan Power Grid Co., Ltd., Grid Planning Research Center of Yunnan Power Grid Co., Ltd.
Publisher’s note
All claims expressed in this article are solely those of the authors and do not necessarily represent those of their affiliated organizations, or those of the publisher, the editors and the reviewers. Any product that may be evaluated in this article, or claim that may be made by its manufacturer, is not guaranteed or endorsed by the publisher.
References
Askari, S. (2021). Fuzzy C-Means clustering algorithm for data with unequal cluster sizes and contaminated with noise and outliers: Review and development. Expert Syst. Appl. 165, 113856. doi:10.1016/j.eswa.2020.113856
Bin, Y., Xu, L., Wang, J., Zhu, S. Y., Qiu, X. F., Yin, C. X., et al. (2019). Research on investment input-output benefit of distribution network planning considering micro-grid and multi-load development under the new power reform. IOP Conf. Ser. Earth Environ. Sci. 237 (6), 062013–62013. doi:10.1088/1755-1315/237/6/062013
Chen, X. L. (2020). Operational reliability evaluation of power generation and transmission combined system considering multiple meteorological elements and retired battery energy storage. Chongqin, China: Chongqing University, doi:10.27670/d.cnki.gcqdu.2020.000145
Company, B. P. (2021). Statistical review of world energy 2021. https://www.bp.com/en/global/corporate/energy-economics/statistical-review-of-world energy. html.[R/OL]. [2021-07-09]
Das, C. K., Bass, O., Kothapalli, G., Mahmoud, T. S., Habibi, D., Hu, D. C., et al. (2018). Overview of energy storage systems in distribution networks: Placement, sizing, operation, and power quality. Renew. Sustain. Energy Rev. 91, 1205–1230. doi:10.1016/J.RSER.2018.03.068
Dong, X., Wu, J., Xu, Z. B., Liu, K., and Guan, X. (2022). Optimal coordination of hydrogen-based integrated energy systems with combination of hydrogen and water storage. Appl. energy 308, 118274. doi:10.1016/j.apenergy.2021.118274
Faramarzi, A., Heidarinejad, M., Stephens, B., and Mirjalili, S. (2020). Equilibrium optimizer: A novel optimization algorithm. Knowl. Based. Syst. 191, 105190. doi:10.1016/j.knosys.2019.105190
Fu, L., Dong, L. T., and Zhang, Y. (2022). Research on optimal configuration of energy storage system in distribution network considering voltage quality. Electr. Autom. 44 (1), 24–26. doi:10.3969/j.issn.1000-3886.2022.01.008
Ghatak, S. R., Sannigrahi, S., and Acharjee, P. (2019). Multi-objective approach for strategic incorporation of solar energy source, battery storage system, and DSTATCOM in a smart grid environment. IEEE Syst. J. 13, 3038–3049. doi:10.1109/JSYST.2018.2875177
He, T. Y., Li, S. N., Wu, S. J., Li, C., and Xu, B. (2021). Biobjective optimization-based frequency regulation of power grids with highparticipated renewable energy and energy storage systems. Math. Problems Eng. 2021, 1–16. doi:10.1155/2021/5526492
Hu, D. C., Zhang, S., Han, T., et al. (2022). Low-carbon transition path of power generation sector under carbon neutral target. Clean. Coal Technol. 28, 23–33. doi:10.13226/j.issn.1006-6772.cn22032102
Hu, W., Yen, G. G., and Zhang, X. (2014). Multiobjective particle swarm optimization based on Pareto entropy. J. Softw. 25 (5), 1025–1050. doi:10.13328/j.cnki.jos.004496
Kanungo, T., Mount, D. M., Netanyahu, N. S., Piatko, C., Silverman, R., and Wu, A. (2002). An efficient k-means clustering algorithm: Analysis and implementation. IEEE Trans. Pattern Anal. Mach. Intell. 24 (7), 881–892. doi:10.1109/TPAMI.2002.1017616
Lee, T. Y., and Chen, N. M. (1995). Determination of optimal contract capacities and optimal sizes of battery energy storage systems for time-of-use rates industrial customers. IEEE Trans. energy Convers. 10 (3), 562–568. doi:10.1109/60.464883
Li, J. L., Guo, Z. D., Ma, S. L., et al. (2022). Summary of "Source-Network-Load Storage" architecture and evaluation system in new power system. High. Volt. Eng., 1003–6520. doi:10.13336/j.1003-6520.hve.20220532
Li, Y., Feng, B., Li, G. Q., Qi, J., Zhao, D., and Mu, Y. (2018). Optimal distributed generation planning in active distribution networks considering integration of energy storage. Appl. Energy 210, 1073–1081. doi:10.1016/j.apenergy.2017.08.008
Li, Y., Feng, B., Wang, B., and Sun, S. (2022). Joint planning of distributed generations and energy storage in active distribution networks: A Bi-level programming approach. Energy 245, 123226. doi:10.1016/j.energy.2022.123226
Liu, M. J., Li, W. R., and Wang, S. C. (2016). Reliability evaluation of microgrid with tidal power generation and battery storage in islanded mode. Power Autom. Equip. 36 (11), 33–39. doi:10.16081/j.issn.1006-6047.2016.11.005
Meng, Q. Q., Li, X. Q., Yu, H. F., et al. (2021). Optimal planning of energy storage power station considering source-charge uncertainty. Acta Energiae Solaris Sin. 42 (10), 415–423. doi:10.19912/j.0254-0096.tynxb.2019-1023
Pal, N. R., and Bezdek, J. C. (1995). On cluster validity for the fuzzy c-means model. IEEE Trans. Fuzzy Syst. 3 (3), 370–379. doi:10.1109/91.413225
Ren, Z. P., Lu, B. C., Zhao, Y. L., et al. (2019). Modeling and simulation of photovoltaic virtual synchronous generator. Power Syst. Prot. Control 47 (13), 92–99. doi:10.19783/j.cnki.pspc.180963
Shi, W. H., Qu, J. X., Luo, K., et al. Grid-integration and operation of high-proportioned new energy. Strategic Study CAE 2022, 1–12. doi:10.15302/J-SSCAE-2022.07.006
Su, H. F., Hu, M. J., and Liang, Z. R. (2016). Distributed power planning with energy storage device based on timing characteristics. Power Autom. Equip. 36 (6), 56–63. doi:10.16081/j.issn.1006-6047.2016.06.009
Wu, Q., Luo, J., and Lin, J. (2014). Production job multi-objective scheduling optimization based on set pair analysis and NSGA-II. Appl. Res. Comput. 31 (5), 1414–1417. doi:10.3969/j.issn.1001-3695.2014.05.031
Wu, Y. J., Liang, X. Y., Huang, T., Lin, Z., Li, Z., and Hossain, M. F. (2021). A hierarchical framework for renewable energy sources consumption promotion among microgrids through two-layer electricity prices. Renew. Sustain. Energy Rev. 145, 111140. doi:10.1016/j.rser.2021.111140
Wu, Y. J., Lin, Z. W., Liu, C. J., Chen, Y., and Uddin, N. (2021). A demand response trade model considering cost and benefit allocation game and hydrogen to electricity conversion. IEEE Trans. Ind. Appl. 58, 2909–2920. doi:10.1109/TIA.2021.3088769
Wu, Y. J., Lin, Z. W., Liu, C. J., Huang, T., Chen, Y., Ru, Y., et al. (2022). Resilience enhancement for urban distribution network via risk-based emergency response plan amendment for ice disasters. Int. J. Electr. Power & Energy Syst. 141, 108183. doi:10.1016/j.ijepes.2022.108183
Xiao, L. Y., and Pan, J. F. Suggestions on building a wide area virtual power plant based on photovoltaic power generation and physical energy storage. Bull. Chin. Acad. Sci. 2022, 549–558. doi:10.16418/j.issn.1000-3045.20220120001
Yan, Z. M., Wang, C. M., Zheng, J., et al. (2013). Value assessment model of battery energy storage system in distribution network. Electr. Power Autom. Equip. 33 (2), 57–61. doi:10.3969/j.issn.1006-6047.2013.02.010
Yang, B., Wang, J. T., Chen, Y. X., Li, D., Zeng, C., et al. (2020). Optimal sizing and placement of energy storage system in power grids: A state-of-the-art one-stop handbook. J. Energy Storage 32, 101814. doi:10.1016/j.est.2020.101814
Yang, B., Yu, L., Chen, Y. H., Ye, H., Shao, R., Shu, H., et al. (2021). Modelling, applications, and evaluations of optimal sizing and placement of distributed generations: A critical state-of-the-art survey. Int. J. Energy Res. 45 (3), 3615–3642. doi:10.1002/er.6104
Zandalinas, S. I., Fritschi, F. B., and Mittler, R. (2021). Global warming, climate change, and environmental pollution: Recipe for a multifactorial stress combination disaster. Trends Plant Sci. 26 (6), 588–599. doi:10.1016/j.tplants.2021.02.011
Keywords: battery energy storage systems, fuzzy kernel C-means, non-dominated sorting genetic algorithm-II, entropy weight method, active distribution network
Citation: Su R, He G, Su S, Duan Y, Cheng J, Chen H, Wang K and Zhang C (2023) Optimal placement and capacity sizing of energy storage systems via NSGA-II in active distribution network. Front. Energy Res. 10:1073194. doi: 10.3389/fenrg.2022.1073194
Received: 18 October 2022; Accepted: 22 November 2022;
Published: 10 January 2023.
Edited by:
Yingjun Wu, Hohai University, ChinaReviewed by:
Hongcai Zhang, University of Macau, ChinaTao Chen, Southeast University, China
Changgang Li, Shandong University, China
Yang Li, Northeast Electric Power University, China
Copyright © 2023 Su, He, Su, Duan, Cheng, Chen, Wang and Zhang. This is an open-access article distributed under the terms of the Creative Commons Attribution License (CC BY). The use, distribution or reproduction in other forums is permitted, provided the original author(s) and the copyright owner(s) are credited and that the original publication in this journal is cited, in accordance with accepted academic practice. No use, distribution or reproduction is permitted which does not comply with these terms.
*Correspondence: Guobin He, R3VvYmluSGUxMUBvdXRsb29rLmNvbQ==