 Hanbo Wang
 Yingming Liu1
 Liming Wang
95% of researchers rate our articles as excellent or good
Learn more about the work of our research integrity team to safeguard the quality of each article we publish.
Find out more
ORIGINAL RESEARCH article
Front. Energy Res. , 06 January 2023
Sec. Smart Grids
Volume 10 - 2022 | https://doi.org/10.3389/fenrg.2022.1067896
This article is part of the Research Topic Flexibility Analysis and Regulation Technology of Clean Energy System View all 17 articles
This paper proposes a dynamic synthetic inertia control method, considering the fatigue loads of the wind turbine. The control objectives include reducing the rate of change of frequency and frequency nadir of the power system and the fatigue load of the shaft and tower of the wind turbine. A frequency regulation model of the power system containing the primary operating dynamics of the wind turbine is established. The dynamic synthetic inertia control method is proposed according to the relationship between fatigue load, wind velocity, and frequency. Case studies are conducted with a wind turbine fatigue load under a synthetic inertia control with different weights for different wind velocities and system loads. Therefore, the dynamic weights are obtained. Comparing the rate of change of frequency and frequency nadir and equivalent damage load, the efficacy of the proposed method is verified.
In recent years, with the rapid development of renewable energy technology, wind power constitutes an increasing proportion of the power system (Wu et al., 2021a; Shamlou et al., 2021; Huang et al., 2022). However, as the wind turbine (WT) does not contribute to the inertia of the power system, the total equivalent inertia of the power system will become smaller (Mahish and Pradhan, 2019; Wu et al., 2021b; Lin et al., 2022; Wu et al., 2022). Therefore, large-scale grid connection of the WT brings considerable challenges to the frequency stability of the power system (Arani and El-Saadany, 2013;Mohammad et al., 2017). Although the current WT inertia control methods can improve the inertia of the power system (Ma et al., 2021), these methods do not focus on the fatigue load of the WT. Studies show that participating in inertia control will increase the fatigue load of the WT drivetrain (Ye et al., 2015), which will greatly shorten its service life. Therefore, studying the inertia control method of the WT, considering the fatigue load, can not only improve the inertia of the power system but also extend the service life of the WT.
For a long time, researchers have conducted a series of studies on reducing the frequency nadir (FN) and the rate of change of frequency (ROCOF) of the power system based on the introduction of inertial control (Mandal and Chatterjee, 2021) (Xu et al., 2019). In order to get rid of the inherent adverse effects of the inertial control strategy with constant parameters, Hwang et al. (2016), Pradhan et al. (2018), Wu et al. (2018), and Yang et al. (2020) proposed an inertial control method based on dynamic gain to improve the frequency stability of the system under fixed wind conditions. Sato et al. (2022) designed a novel virtual inertia control strategy based on fuzzy logic controller (FLC) to reduce the FN. Lu et al. (2021) performed a comprehensive analysis of the existing inertia and droop controllers applicable to offshore WT. However, the aforementioned references only consider the stability of frequency of the system itself and completely ignores the fatigue load of the low-speed shaft and tower of the WT that participate in the system frequency adjustment, which will pose a certain threat to the stability of the WT itself.
The fatigue load of the low-speed shaft and tower of WT has significant influence on its service life (Zhao et al., 2017). The fatigue load of the low-speed shaft is particularly sensitive to the change in energy, and the active power reference value of WT with inertia control will frequently change according to the change in system frequency, thus aggravating the fatigue load of the low-speed shaft (Zhang et al., 2020). The study showed the following: 1) both the droop and virtual inertia methods can expose the shaft of a wind generator to forces capable of stimulating its natural resonance frequencies. 2) The mechanical resonance in a frequency-regulating wind generator should be studied as a part of the integrated power system dynamics. The time-domain simulation results verified the analytical results and discussion (Arani and Mohamed, 2016).
In addition, studies have pointed out that the instantaneous torque response may stimulate the tower of WT, resulting in tower resonance (Attya and Dominguez-Garcia, 2018). It can be seen from the aforementioned analysis that participation in frequency response may lead to the increase in the WT fatigue load. However, there is no inertia control method that considers the WT fatigue load.
It can be seen from the aforementioned analysis that few studies can take into account the ROCOF, FN, and fatigue load simultaneously. Therefore, in this study, the main goal of the control scheme is to minimize these three indicators at the same time. However, since the WT participating in the frequency regulation must frequently change the power reference value to adapt to the frequency change in the power system, it is not easy to reduce the aforementioned three control indicators. Therefore, the following two control results are also acceptable: one is to minimize the ROCOF and FN of the system without affecting the fatigue load; and the other is to minimize the fatigue load without affecting the ROCOF and FN.
Therefore, a WT dynamic synthetic inertia control (DSIC) method, considering fatigue load, is proposed:
1) The frequency regulation model is established. The model includes a WT with central operating dynamics, considering shaft torque and tower bending moment.
2) The WT fatigue load is analyzed under different turbulent winds and active power reference values.
3) The changes in the ROCOF and FN of the system and fatigue load under different inertia gains are analyzed.
Based on the analysis result, the dynamic gain range is determined. By simulating the model and method, the advantages of the proposed DSIC method are verified.
The main contributions are as follows:
The fatigue loads of the WT drivetrain and tower caused by frequency response are analyzed, which can help guide the construction of corresponding methods for WT and frequency control. The DSIC control method is proposed, which can simultaneously reduce the ROCOF and FN of the power system and the fatigue loads of the WT.
In this section, the power system and WT models are established, which can be used for the analysis of fatigue load and the establishment of the inertia control method. The research mainly focuses on a doubly fed induction generator (DFIG), so the DFIG is mainly described.
Under normal operation of the power system, the load fluctuates only in a small range. Compared with the dynamic characteristics of voltage and power angle, the dynamic response characteristics of system frequency are relatively slow. Therefore, when studying the long period behavior of the power system frequency under small disturbances (such as primary frequency regulation and secondary frequency regulation), the research on the dynamic characteristics of voltage and power angle is usually ignored. The frequency of the whole power system is considered to be uniform. In order to study the relationship between the frequency change of the power system, the wind turbine inertia, and fatigue load, the model is established as shown in Figure 1. The researched system consists of wind power, hydropower, and thermal power. The selection of the model and parameters refers to Wang et al. (2020). The penetration rates of thermal, hydropower, and wind power are 60%, 20%, and 20%, respectively. Both thermal power and hydropower use power reserves to participate in the primary frequency regulation and secondary frequency regulation of the power system.
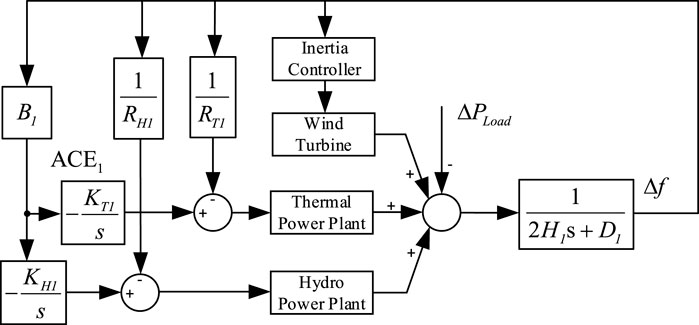
FIGURE 1. Frequency regulation model of the power system with the WT.
The main parameters of the power system are shown in Table 1. The main parameters of the wind turbine are shown in Table 2.
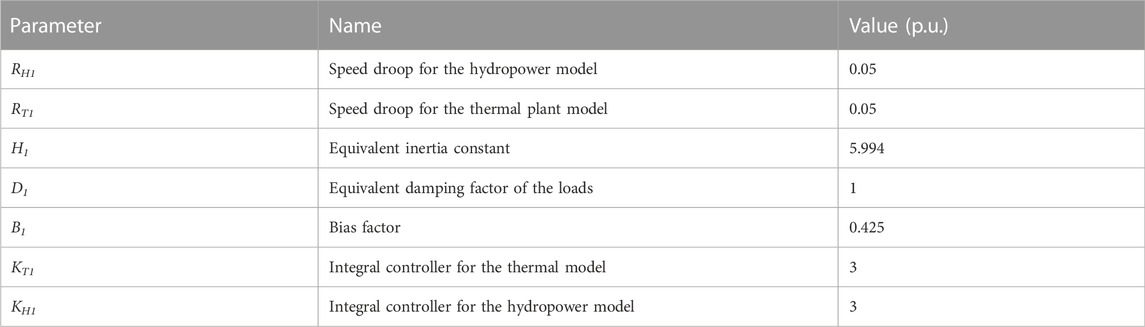
TABLE 1. Parameters for the frequency regulation model.
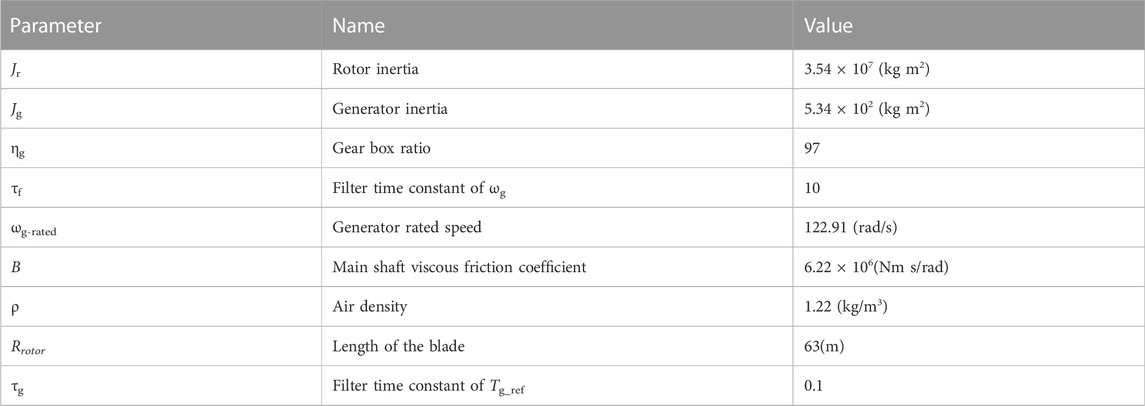
TABLE 2. Main parameters of the wind turbine.
Since this research considers the fatigue load of the low-speed shaft torque Ms and the tower bending moment Mt of the WT, the main dynamics need to be considered when modeling the WT. The WT model used in this paper can be simplified as shown in Figure 2, which is developed by NREL (Jonkman et al., 2009). The main dynamics of the wind turbine are simulated by the FAST (Fatigue, Aerodynamics, Structures, and Turbulence) Code (Jonkman et al., 2005).
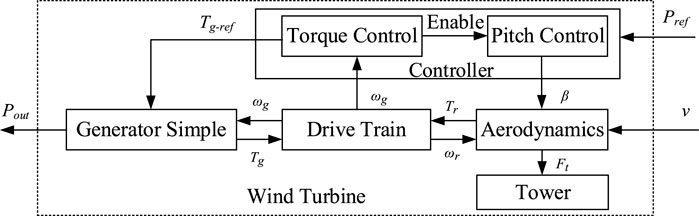
FIGURE 2. Wind turbine block diagram, considering the low-speed shaft torque Ms and the tower bending moment Mt.
The aerodynamic torque Tr can be expressed by:
where ρ is the air density, v is the wind speed, Rrotor is the length of the blade, Cp is the power coefficient, and ωr is the rotor speed.
The tower thrust force Ft can be expressed by:
where Ct is the thrust coefficient.
The tower bending moment Mt can be calculated by:
where Htower is the tower height.
In order to more accurately describe the dynamics of Ms, a dual mass model is used. The model can be expressed by:
where ωg is the generator speed, B is the main shaft viscous friction coefficient, Ms is the shaft torque, Jr is the rotor mass, and Jg is the generator mass.
The generator model can be expressed by:
where Tg-ref is the generator torque reference value. The maximum power of the generator is 5.3 MW, which can exceed the rated power by 6%.
It should be noted that in this research, the wind power only provides inertia frequency regulation without the power reserve. In addition, because the WT fatigue load is lower than the rated wind speed, this research only focuses on the fatigue load of the wind turbine higher than the rated wind speed.
In this section, the fatigue loads caused by inertial response is discussed. First, the changes in the WT fatigue load under different wind speeds and power references are analyzed. The relationship between fatigue load, power reference, and wind velocity is clarified, which makes it clear that the influence of fatigue load can be used for the establishment of DSIC. The corresponding analysis was rarely reported in other research studies, so it is the first time to be analyzed. Then, the fixed-gain inertia control method is introduced. Also, the DSIC method is proposed, considering the wind turbine fatigue load. Finally, a quantitative index that can evaluate the performance of the control method is proposed.
First, TurbSim is used to generate two wind-velocity curves. The curves are shown in Figure 3. The average wind velocity (Vavg) of Wind1 is 17 m/s, and the turbulence intensity (Itur) is 0.11. The Vavg of Wind2 is 15 m/s, and the Itur is 0.04. The simulation time is 100 s. Since the WT is mainly in the starting stage during the first 15 s, in order to accurately compare the results of different control methods, the fatigue load performance of the WT is mainly studied after 20 s. The dynamic behavior of the WT in a simulated wind field yields time series of loads or stresses. Through post-processing, the fatigue cycles based on the rainflow counting method are derived to evaluate the performance of the proposed scheme (TonyNickDavidErvin, 2011). In addition, the WT fatigue load is evaluated by DEL. DEL is calculated according to Miner’s rule. The rule depends on the material properties specified by the slope of the S-N curve (Spudi´ c et al., 2011). The DEL calculation is performed using the MCrunch code.
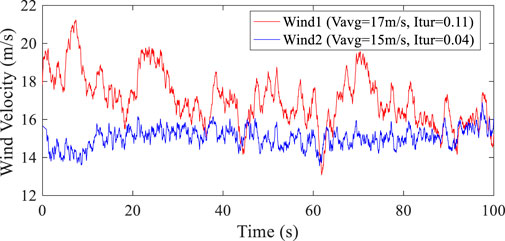
FIGURE 3. Two wind-velocity curves.
In the case of Wind2, four different reference powers shown in Figure 4 are used for this research. Pref2 has a smaller power change and slower recovery (called small positive changes). Pref3 has a larger power change and faster recovery (called large positive changes). The total energy of these two reference power changes is the same. The change of Pref4 is opposite to Pref3 (called large negative changes).
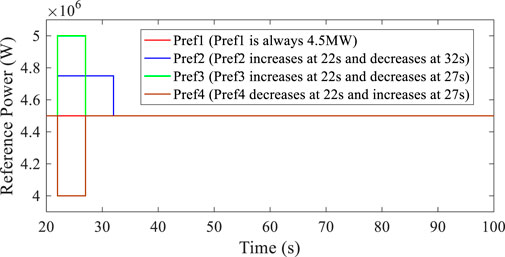
FIGURE 4. Four different reference power values used for testing under Wind1 and Wind2 conditions.
Figure 5 shows the cumulative rainflow cycle results of the WT shaft torque and tower bending moment under different wind velocities and reference power values. In a relatively stable wind speed, relative to the constant load Pref1, a variable load will increase the fatigue load of the WT. It can be seen from the results of Pref2 and Pref3 that the cycles of Pref3 with large positive changes are larger than those of Pref2 with small positive changes, which implies that the fatigue load of Pref2 is smaller.
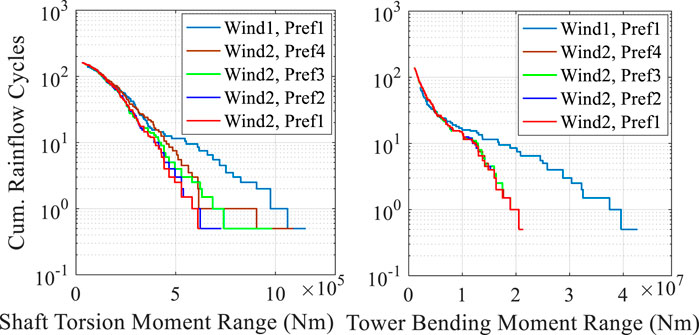
FIGURE 5. Cumulative rainflow cycle result of the WT shaft and tower under different wind velocity and reference power values.
Therefore, under the same stable wind condition, the greater the load fluctuation, the greater the fatigue load of the shaft.
Compared with Pref3 with large positive changes, Pref4 with large negative changes would cause the shaft to have a great fatigue load. The main reason is that the WT controller will increase the pitch angle to release the obtained air kinetic energy after reducing the power reference value. Therefore, Ms will decrease, but its fluctuation is greater. The change curves of Ms are shown in Figure 6.
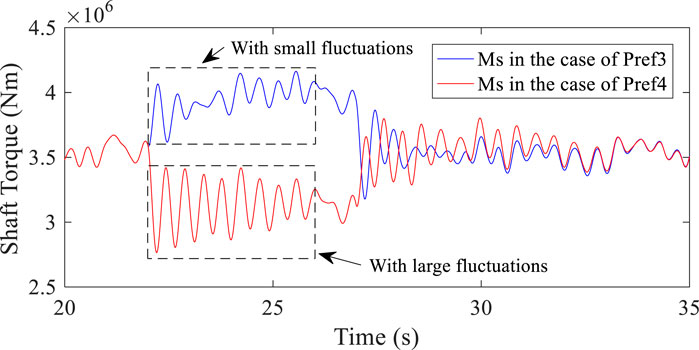
FIGURE 6. Change curves of Ms under different reference power values.
Figure 5 also shows the cumulative rainflow cycle results under Wind1 and Pref1. It can be seen from the figure that under the same power reference value, the fatigue loads of Ms and Mt are 200% of those under Wind2. The main reason is that the fluctuation of Wind1 is greater.
Therefore, under the same reference power value, the greater the average wind speed and turbulence, the greater the fatigue load. Therefore, it is necessary to pay more attention to the fatigue loads when the turbulence intensity is higher or wind velocity is increasing.
As shown in Figure 7, two different power reference values are used for testing under Wind1 conditions. Figure 8 shows cumulative rainflow cycle results of the WT shaft and tower under different reference power and wind velocity values. The difference from the case of Wind2 is that when the reference power fluctuates in the reverse direction (decreases first and then increases), the fatigue loads of the shaft and tower of the wind turbine both decrease instead of showing an increase. The reason is that Wind1 also undergoes significant changes. At this moment, the wind velocity falls first and then rises, consistent with the power change trend. If the power reference value increases at this time, it will cause the air kinetic energy to decrease relative to the steady wind speed. Therefore, the WT controller will reduce the pitch angle to obtain more energy, and shaft torque and tower bending moment will increase and fluctuate more.
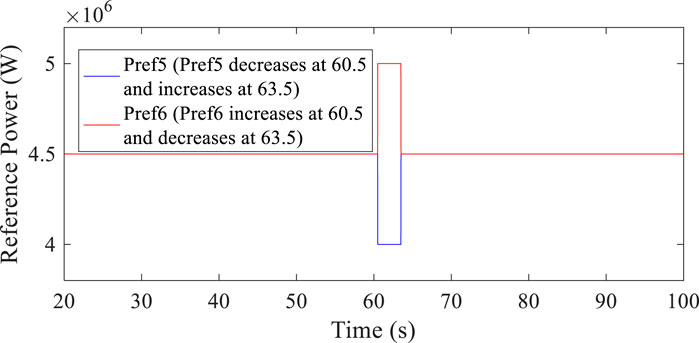
FIGURE 7. Two different reference power values used for testing under Wind1 conditions.
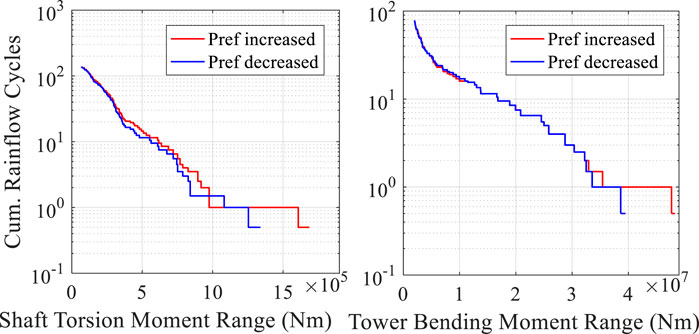
FIGURE 8. Cumulative rainflow cycle results of the WT shaft and tower under different reference power and wind velocity values.
Therefore, when the changing trend of the reference power is the same as the changing trend of the wind velocity, it is beneficial to reducing the fatigue load of the wind turbine. Some experience is obtained: 1) when the wind velocity decreases, the reference power of the WT should be reduced as much as possible, or the increased power of the WT should be reduced. 2) Similarly, when the wind velocity increases, the reference power should be increased, or the decreased power should be reduced.
This part mainly describes the fixed-gain inertia control method, as shown in Figure 9. In order to regulate the output of the wind turbine according to the power system frequency, the frequency of the power system must be measured and filtered through a low-pass filter to reject the measurement noise. Since the derivative of frequency is used for calculation, sufficient filtering is required. Differentiation of a noisy signal may lead to large variations in the value of ΔPin, which is undesired because it may cause heavy torque pulsations in the WT drivetrain.
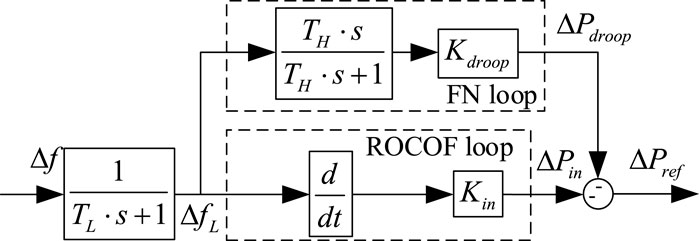
FIGURE 9. Conventional fixed-gain inertial control of a DFIG.
The inertial control scheme based on ROCOF and FN loops is used simultaneously in VDV et al. (2016). As shown in Figure 9, ΔPref consists of two terms: ΔPdroop and ΔPin. In the initial stage of the disturbance, the ROCOF loop dominates and is proportional to the frequency change rate. In contrast, the FN loop dominates near the frequency nadir. The FN loop has two functions: 1) to counteract the control effect of MPPT and 2) to limit the frequency deviation by increasing the WT power output proportional to the frequency deviation. The WT should return to the operating point before the disturbance after the inertial response. Therefore, the period of overproduction during the inertial response period should be followed by a period of underproduction or recovery. To allow recovery of the WT, a high-pass filter, which prevents a contribution of the droop controller in a steady state, is added:
where Th is the time constant of the high-pass filter.
The output of the droop loop ΔPdroop can be expressed by:
where Kdroop is the weight coefficient of the FN loop.
The output of the ROCOF loop ΔPin can be expressed by:
where Kin is the weight coefficient of the ROCOF loop.
The loop gain of these schemes is fixed, so a more significant gain can ensure that the FN and ROCOF are reduced. However, it can be known from the analysis of Part 3.1 of this section that more extensive power changes may cause larger fatigue loads. Therefore, it is necessary to change the gains when the frequency regulation method has a more significant impact on the fatigue loads of the WT to minimize the effect of frequency regulation on the fatigue loads.
This DSIC scheme aims to: 1) reduce the FN and ROCOF; and 2) mitigate the fatigue loads of a DFIG caused by frequency regulation. This scheme dynamically adjusts the weight based on the wind velocity increase or decrease and the frequency deviation increase or decrease. The main reasons analyzed in Part 3.1 of this section are the following two points:
1) The fatigue load experienced by the shaft torque of WT is related to the wind speed and increase or decrease in the reference power change. The reference power of the WT participating in frequency regulation is mainly determined by the change in the power system frequency.
2) Under the exact reference power change, the fatigue load of the WT is related to the change in wind velocity and its increase or decrease. When the wind velocity is in the rising phase, the falling reference wind power should be reduced, and the increasing reference power should continue to increase. When the wind velocity decreases, the decreasing value should continue to decrease, and the increasing value should be reduced.
The proposed DSIC method is shown in Figure 10. Figure 10A shows the implementation method of DSIC. Figure 10B shows an overall block diagram of a control system. In the actual operation and control of the WT, it is not easy to accurately sample the wind speed with a shorter step length. Therefore, the increases or decreases in wind velocity and frequency are used to change the gains.
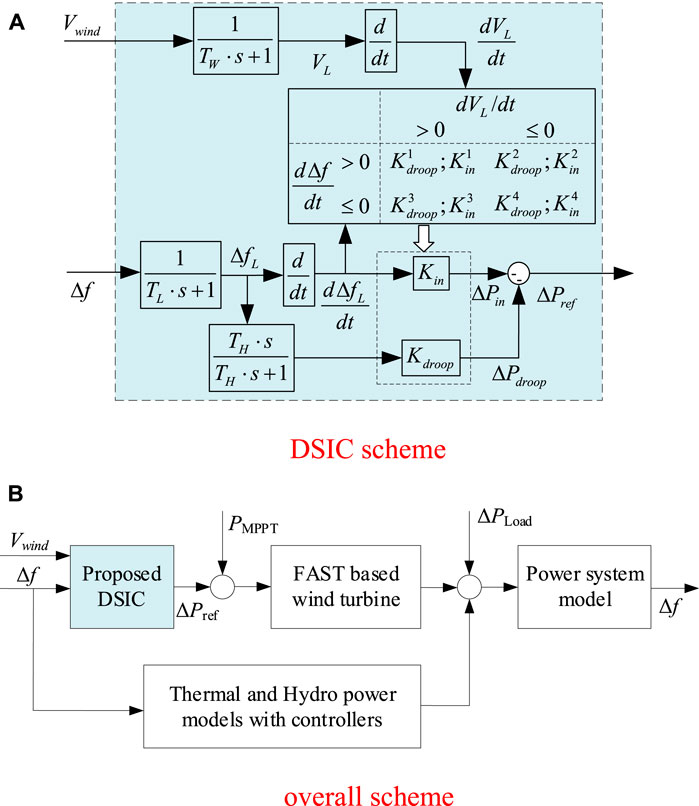
FIGURE 10. Proposed DSIC scheme for DFIG participating in the power system frequency regulation. (A) DSIC scheme. (B) Overall scheme.
The following equation expresses the increase or decrease in wind velocity:
where VL is the filtered wind speed. The main function of the filter is to eliminate the interference of low-frequency wind fluctuations to judge the increase or decrease in the wind speed.
The increase or decrease in Δf is expressed by:
where ΔfL is the filtered frequency deviation.
The weight of K (K is short for Kdroop and Kin) depends on the increase or decrease in frequency deviation and the increase or decrease in wind velocity. Since the fatigue load is related to the speed of the power change, the weight cannot have rapid fluctuations. In this study, K changes every 1s. Moreover, different K values cannot differ too much. Otherwise, it would cause the reference power to change too much and increase the fatigue load experienced by the WT.
This study has three control objectives: FN, ROCOF, and fatigue load. A quantitative analysis of these three goals is needed when comparing controller performance. Since the ROCOF and FN constantly change during the simulation process, equations are needed to quantify. DEL mainly compares the fatigue load.
The quantification of ROCOF is mainly shown in Equation 12. The quantification method is to mainly evaluate the ROCOF integral during the simulation operation cycle to evaluate the ROCOF situation for a period of time.
The quantization of FN mainly considers the absolute value of the maximum frequency deviation. Moreover, every time an extreme value occurs, it will be accumulated.
where Δfext is the extremum of Δf. Every time an extremum value appears, it will be accumulated once.
The fatigue load of the tower and shaft is evaluated using DEL. Following the fatigue load evaluation method in Zhang et al. (2018), the fatigue loads of the tower and the shaft are combined, and the calculation method of the total DEL is as follows:
where DELMs represents the equivalent damage load of Ms, which is used to evaluate the fatigue load of the shaft. DELMt represents the equivalent damage load of Mt, which is used to evaluate the fatigue load of the tower. KMs and KMt are tunable weightings and can be tuned according to the costs and the designed lifetime of the shaft and the tower. In this paper, KMt is chosen as 1, and KMs is chosen as 2 (Zhang et al., 2016), since the shaft stress is higher than the tower stress when participating in frequency regulation. Since the DEL value of the tower is much larger than the DEL value of the shaft, the DELs of the tower are normalized with base 5 × 10⁷, and the DELs of the shaft are normalized with base 2 × 10⁶. In this way, the DEL values of both series are all transferred to per unit values.
In the Wind2 scenario, the system load increases and decreases by 5% p. u. at 35 s. The control objectives are given in the following paragraphs. In the next two sections, we would focus on the influence of control variables on the WT fatigue load.
The ROCOF and FN of the system are shown in Figure 11. The same is that ROCOF and FN decrease with the increase in K, and the decreasing trend is the same. In addition, when the load increases, the decreasing trend of ROCOF and FN becomes insignificant after K increases to a certain level (such as (6, 10), (7, 9), and (8, 8)). This is due to the limitation of the wind power output. In this case, the benefit of continuing to increase K is not obvious to the system.
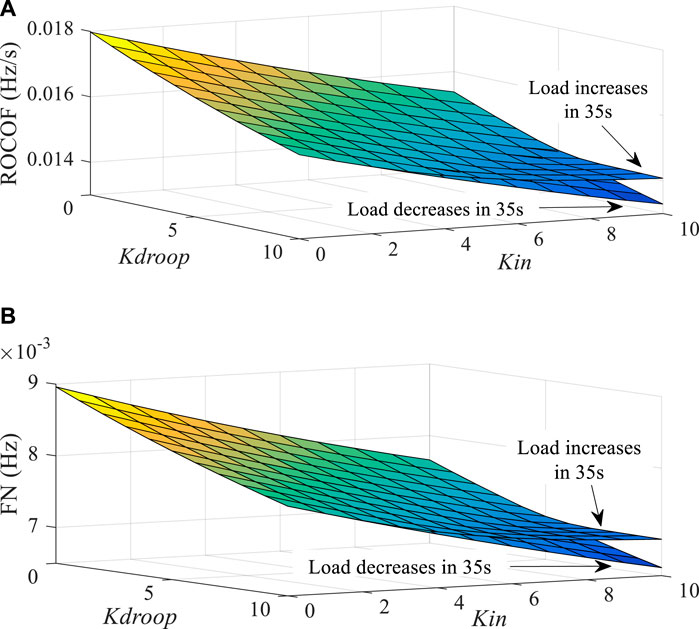
FIGURE 11. ROCOF and FN of the system. (A) ROCOF results under the change in K when the system load increases and decreases by 5% at 35 s. (B) FN results under the change in K when the system load increases and decreases by 5% at 35 s.
Figure 12 shows the results of DELMs under this condition. It can be seen from the figure that under stable wind speed, the DELMs increases no matter how the frequency changes. Also, the larger the K, the more obvious the increasing trend, and the maximum increase is 16.9% within the weight range. This is because the fatigue load of the shaft under this working condition mainly depends on the reference power fluctuation. The greater the K, the greater the fluctuation of the reference power under the same frequency fluctuation, which will cause an increase in the fatigue load.
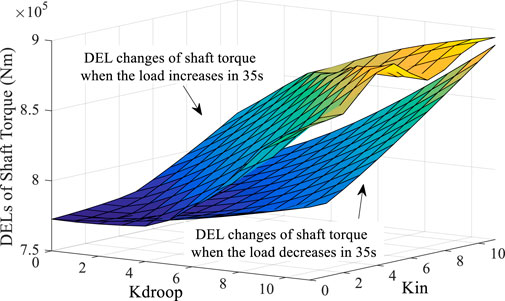
FIGURE 12. DELMs results under the change in K when the system load increases and decreases by 5% at 35 s.
Figure 13 shows the results of DELMt under this condition. DELMt shows a slight downward trend when the load increases. When K is changed within the range of 11, the tower DEL is reduced by up to 0.4%. DELMt increases with the increase in Kdroop when the load decreases. Also, the more significant the Kdroop, the more pronounced the increasing trend. Compared with Kdroop, Kin has less effect on DELMt, which implies that the FN loop has a more significant impact on tower fatigue than the ROCOF loop. Figure 14 shows the results of DELtot under this condition. Under this working condition, the evaluation result of DELtot shows that DELtot increases with the increase in K, which implies that the increase in K will increase the total fatigue load of the WT.
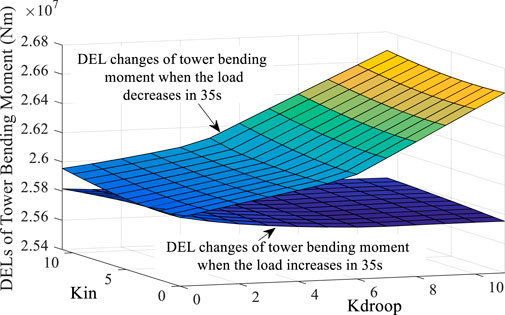
FIGURE 13. DELMt results under the change in K when the system load increases and decreases by 5% at 35 s.
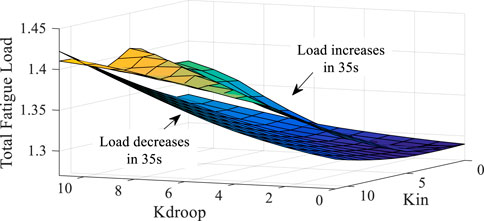
FIGURE 14. DELtot results under the change in K when the system load increases and decreases by 5% at 35 s.
According to the analysis in this part, K should not be too large or too small. If K is too large, the fatigue load will increase. If K is too small, the frequency regulation performance will be poor. Therefore, the range of K is set between 6 and 11 in this research.
In Wind1, the system load increases and decreases by 5% at 60.5 s (that is, the load also changes when the wind velocity is about to change significantly). In the study of this working condition, the changing trend of the ROCOF and FN is the same as in the previous section, so the analysis is not repeated.
After the load decreases at 60.5 s, the frequency will increase to a specific value and decrease. The changing frequency trend will be opposite to the changing trend of wind velocity. At this time, DELMs and DELMt will decrease as K increases. Consistent with the results of the previous analysis, the changing trend of the reference power is the same as the wind speed change trend, reducing the fatigue load. Similarly, there is almost no effect on DELMt by Kin after Kdroop reaches a value greater than 8. Furthermore, DELMt will decrease with the increase in Kdroop.
Under the same Kdroop condition, the changing trend of DELMs increases with the increase in Kin. The reason is that Kin mainly limits the frequency change rate. The increase in Kin will make the power fluctuations become larger, which will cause the fluctuations in Ms to increase the fatigue load. However, in the case of the same Kin, DELMs decreases first and then increases with the increase in Kdroop. Ms under different Kdroop values is shown in Figure 15.
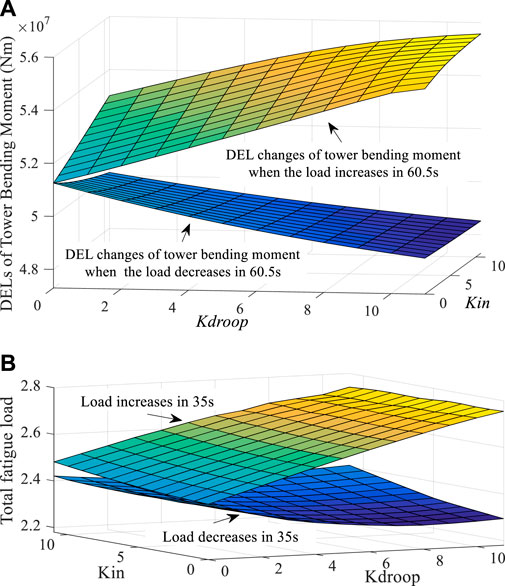
FIGURE 15. Ms under different Kdroop values when the system load increases and decreases by 5% at 60.5 s.
Between 60.5 s and 65 s, Ms increases with the increase in Kdroop. However, this does not mean that DELMs increases with the increase in Kdroop before 65 s. DELMs up to three different times is shown in Figure 15.
It can be seen from Table 3 that only DELMs values of the 0–62.5 s time period increase with the increase in Kdroop. It shows that increasing Kdroop leads to the increase in DELMs when the load changes within 2 s. When Kdroop increases to 9, DELMs increases by 0.83%. However, due to the inertia of the power system and WT, it takes time for changes in the system load to be converted into the output power of WTs. For load changes exceeding 2 s, the fatigue load of Ms will still decrease first and then increase as Kdroop increases. This is because the fluctuation in Ms will increase with the increase in Kdroop after Kdroop exceeds a certain value.
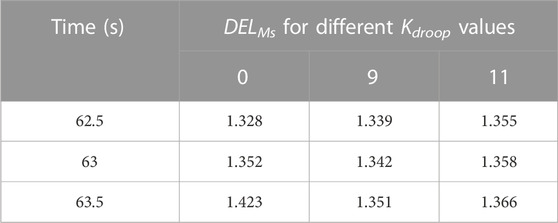
TABLE 3. DELMs up to three different times under different Kdroop values when the system load increases and decreases by 5%.
As shown in Figure 16 and Figure 17A, when the change trends of wind velocity and frequency are the same, the fatigue load of the shaft and tower will increase with the increase in Kdroop. Considering the changing trends of FN and ROCOF, Kdroop is selected as 8. Since the fatigue load of the shaft and the tower does not change much when Kin increases, Kin can be increased as much as possible when the wind speed decreases, and Kin is selected as 11. This does not increase the fatigue load. However, when the wind velocity increases, in order to reduce the burden on the shaft and tower, Kin should not be too large, and Kin is selected as 7 in this case. When the changing trend of wind speed is opposite to the changing trend of frequency, Kin should not be selected too large. So, when the wind speed increases, Kin is selected as 6. When the wind velocity decreases, Kin can be increased appropriately, and Kin is selected as 9. When the frequency increases, Kdroop can be increased as much as possible, and Kdroop is selected as 11. When the frequency decreases, Kdroop is selected as 9. The K weights under different working conditions are shown in Table 4.
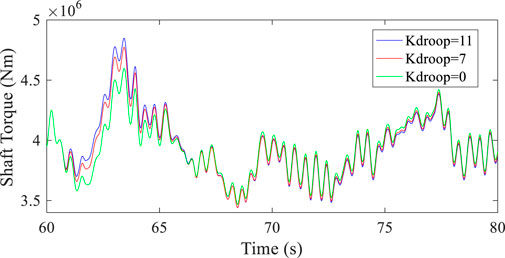
FIGURE 16. DELMs results under the change in K when the system load increases and decreases by 5% at 60.5 s.
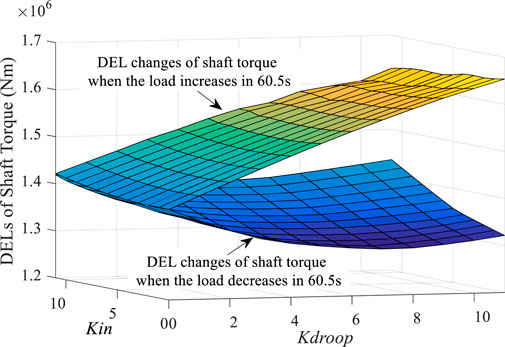
FIGURE 17. DELMt and DELtot results under the change in K when the system load increases and decreases by 5% at 60.5 s. (A)DELMt results under the change in K when the system load increases and decreases by 5% at 60.5 s. (B)DELtot results under the change in K when the system load increases and decreases by 5% at 60.5 s.
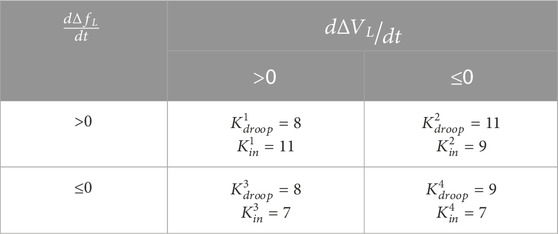
TABLE 4. Kdroop and Kin weights under different working conditions.
In this case, the random system load that changes every 2 s is applied to Wind1 to verify the advantages of the proposed method. In addition, the performances of FN and ROCOF, and DEL under different fixed gains are compared. The choice of fixed gain mainly considers ROCOF, FN, and DEL, so values from 7 to 9 are selected, respectively. The load changes from 25 s to 100 s are shown in Figure 18A, and the K changes for DSIC are shown in Figure 18B. The ROCOF and FN and the fatigue loads are compared under the fixed gain and the DSIC methods, respectively. The results are shown in Table 5 and Table 6.
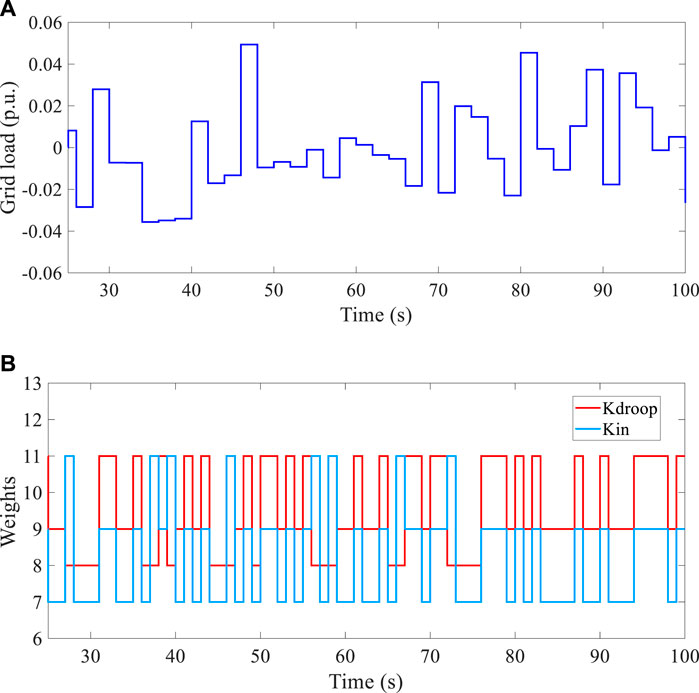
FIGURE 18. Load change from 25 s to 100 s, and K change in the corresponding DSIC scheme. (A) Random system load that changes every 2 seconds. (B) Kdroop and Kin changes for the DSIC scheme when a random white noise system load appears.
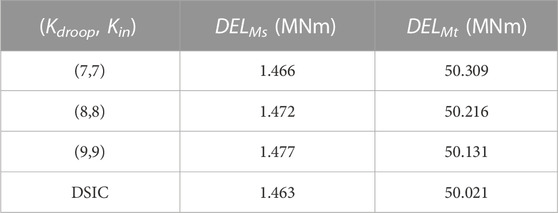
TABLE 5. DELs of shaft torque and tower bending moment under the fixed gain and DSIC methods.
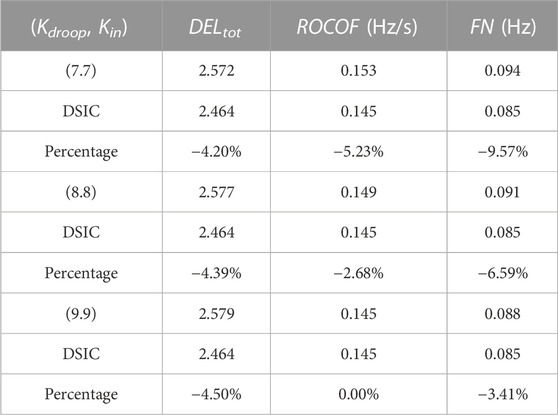
TABLE 6. DELtot and ROCOF and FN under the fixed gain and DSIC methods.
It can be seen from Table 5 that DELMs and DELMt under the DSIC method are lower than those of the inertia control based on a fixed gain. It can be seen from Table 6 that DELtot under the DSIC method is lower than that of the inertia control of fixed gain. The reduction range is about 4%, which can significantly mitigate the wind turbine drivetrain fatigue load. For the FN, the reduction ranges from −3.41% to 9.57%. The ROCOF decreases from 0 to 5.23%. It can be known from the aforementioned data that the proposed DSIC method can significantly reduce ROCOF and FN while reducing fatigue load. This shows that the proposed DSIC scheme has good performance in reducing fatigue load and ROCOF and FN at the same time.
In order to further clarify the dynamic behavior of wind turbine under different parameters, power output, rotor speed, and torque of drive chain are compared. Figure 19A shows the output power under different parameters. It can be seen that the rise in parameters increases the fluctuation of power output. The increase in output power is beneficial to the stability of system frequency. The DSIC method can have higher output power, so it can make the system frequency deviation and rate of change of frequency smaller.
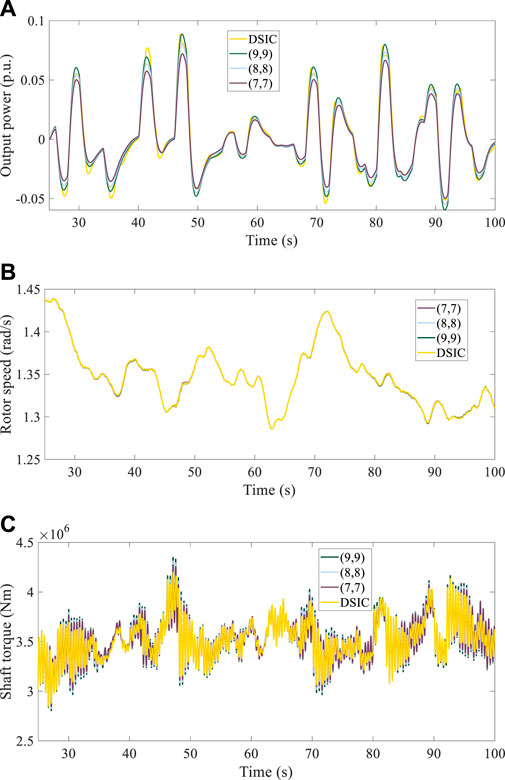
FIGURE 19. Dynamic behavior of the wind turbine. (A) Power output under different control parameters. (B) Rotor speed under different control parameters. (C) Shaft torque under different control parameters.
The rotor speed under different parameters is shown in Figure 19B. It can be seen that the rotor speed difference is small, which indicates that the proposed method will not affect the stable operation of the wind turbine. Figure 19C shows the drive chain torque. It can be seen that with the increase in the parameters of the traditional method, the torque fluctuation of the transmission chain increases. This is because larger parameters are easy to cause torsional vibration of the transmission chain. The proposed DSIC method further changes the generator torque by dynamically adjusting the output power, which can restrain the torsional vibration of the drive chain to a certain extent. Therefore, the proposed method can reduce the fatigue load of the WT. In conclusion, the results show that the proposed DSIC method can reduce the fatigue load of the wind turbine while improving the frequency regulation capability of the WT.
A WT DSIC method, considering fatigue load, is proposed. This method uses two loops of the ROCOF and FN, and the loop gain would change dynamically according to wind speed and frequency. This method can simultaneously reduce the system’s FN and ROCOF and the wind turbine’s fatigue load.
The analysis shows that the K weight under different working conditions should not be too different to prevent the power reference value from changing too much and causing the DEL to increase. For working conditions with significant changes in wind velocity, the FN loop has a more significant impact on the DEL than the ROCOF loop. When the changing trend of wind velocity is opposite to the changing trend of frequency, the weight of inertia control can be increased, which helps to reduce the DEL. The results show that compared with the conventional scheme, the proposed DSIC scheme can significantly reduce the FN and ROCOF while reducing the DEL. The reduction in DELtot is about 4%. The reduction in the ROCOF ranges from -5.23% to 0%. The reduction in the FN ranges from −9.57% to −3.41%.
The original contributions presented in the study are included in the article/Supplementary Material; further inquiries can be directed to the corresponding author.
All authors listed have made a substantial, direct, and intellectual contribution to the work and approved it for publication.
This work was supported by the Development and Industrialization of Intelligent Wind Farm Holographic State Accurate Perception and Optimization Decision System Project (2021JH1/10400009) and Liaoning Provincial Central Government Guides Local Science and Technology Development Fund Projects (2021JH6/10500166).
The authors declare that the research was conducted in the absence of any commercial or financial relationships that could be construed as a potential conflict of interest.
All claims expressed in this article are solely those of the authors and do not necessarily represent those of their affiliated organizations, or those of the publisher, the editors, and the reviewers. Any product that may be evaluated in this article, or claim that may be made by its manufacturer, is not guaranteed or endorsed by the publisher.
Arani, M., and El-Saadany, E. (2013). Implementing virtual inertia in DFIG-based wind power generation. IEEE Trans. Power Syst. 28, 1373–1384. doi:10.1109/TPWRS.2012.2207972
Arani, M. K. M., and Mohamed, Y-R. (2016). Analysis and mitigation of undesirable impacts of implementing frequency support controllers in wind power generation. IEEE Trans. Energy Convers. 31, 174–186. doi:10.1109/tec.2015.2484380
Attya, A. B. T., and Dominguez-Garcia, J. L. (2018). Insights on the provision of frequency support by wind power and the impact on energy systems. IEEE Trans. Sustain. Energy 99, 719–728. doi:10.1109/tste.2017.2759503
Huang, T., He, Q., Qi, J., Hu, Q., Wang, R., Cai, G., et al. (2022). Multinodes interval electric vehicle day-ahead charging load forecasting based on joint adversarial generation. Int. J. Electr. Power & Energy Syst. 143, 108404. doi:10.1016/j.ijepes.2022.108404
Hwang, M., Muljadi, E., Park, J. W., Sorensen, P., and Kang, Y. C. (2016). Dynamic droop–based inertial control of a doubly-fed induction generator. IEEE Trans. Sustain. Energy 7, 924–933. doi:10.1109/TSTE.2015.2508792
Jonkman, J. M., Buhl, J., Musial, w., and Scott, G. (2005). FAST user's guide. United States. doi:10.2172/15020796
Jonkman, J., Butterfield, S., Musial, W., and Scott, G. (2009). Definition of a 5-MW reference wind turbine for offshore system development. United States: National Renewable Energy Laboratory. NREL/TP-500-38060. doi:10.2172/947422
Lin, L., Cheng, C., Wei, B., Li, H., Shi, J., Zhang, J., et al. (2022). Residential electricity load scenario prediction based on transferable flow generation model. J. Electr. Eng. Technol. doi:10.1007/s42835-022-01172-6
Lu, G. L., Lin, C. H., and Yk, Wu. (2021). Comparison of communication-based and coordination-based frequency control schemes for HVDC-connected offshore wind farms. IEEE Trans. Ind. Appl. 57, 3352–3365. doi:10.1109/tia.2021.3079233
Ma, J., Gu, Y., Shen, Y., Zhou, Y., Phadke, A. G., and Cheng, P. (2021). Stability analysis of power grid connected with direct-drive wind farm containing virtual inertia based on integrated dissipation energy model. IEEE Trans. Sustain. Energy 12, 2378–2392. doi:10.1109/TSTE.2021.3095171
Mahish, P., and Pradhan, A. K. (2019). Distributed synchronized control in grid integrated wind farms to improve primary frequency regulation. IEEE Trans. Power Syst. 99, 362–373. doi:10.1109/TPWRS.2019.2928394
Mandal, R., and Chatterjee, K. (2021). Virtual inertia emulation and RoCoF control of a microgrid with high renewable power penetration. Electr. Power Syst. Res. 194, 107093. doi:10.1016/j.epsr.2021.107093
Mohammad, D., Mokhlis, H., and Mekhilef, S. (2017). Inertia response and frequency control techniques for renewable energy sources: A review. Renew. Sustain. Energy Rev. 69, 144–155. doi:10.1016/j.rser.2016.11.170
Pradhan, C., Bhende, C. N., and Samanta, A. K. (2018). Adaptive virtual inertia-based frequency regulation in wind power systems. Renew. Energy 115, 558–574. doi:10.1016/j.renene.2017.08.065
Sato, T., Alsharif, F., Umemura, A., Takahashi, R., and Tamura, J. (2022). Stability improvement of power system by cooperative virtual inertia control and reactive power control of pmsg wind generator and battery. Electr. Eng. Jpn. 1, 215. doi:10.1002/eej.23362
Shamlou, A., Feyzi, M. R., and Behjat, V. (2021). Winding deformation classification in a power transformer based on the time-frequency image of frequency response analysis using Hilbert-Huang transform and evidence theory. Int. J. Electr. Power & Energy Syst. 129, 106854. doi:10.1016/j.ijepes.2021.106854
Spudi´ c, V., Jelavi´ c, M., and Baoti´ c, M. (2011). Wind turbine power references in coordinated control of wind farms. Automatika 52, 82–94. doi:10.1080/00051144.2011.11828408
TonyNickDavidErvin, B. J. S. B. (2011). Wind energy handbook. Wiley Online Library. doi:10.1002/9781119992714
Vdv, Jan., Jdm, Kooning., Meersman, B., Vandevelde, L., and Vandoorn, T. L. (2016). Droop control as an alternative inertial response strategy for the synthetic inertia on wind turbines. IEEE Trans. Power Syst. 31, 1129–1138. doi:10.1109/TPWRS.2015.2417758
Wang, X., Wang, Y., and Liu, Y. (2020). Dynamic load frequency control for high-penetration wind power considering wind turbine fatigue load. Int. J. Electr. Power & Energy Syst. 117, 105696. doi:10.1016/j.ijepes.2019.105696
Wu, Y., Liang, X., Huang, T., and Zw Lin, M. F. Hossain (2021). A hierarchical framework for renewable energy sources consumption promotion among microgrids through two-layer electricity prices. Renew. Sustain. Energy Rev. 145, 111140. doi:10.1016/j.rser.2021.111140
Wu, Y., Lin, Z., Liu, C., Chen, Y., and Uddin, N. (2021). A demand response trade model considering cost and benefit allocation game and hydrogen to electricity conversion. IEEE Trans. Ind. Appl. 99, 2909–2920. doi:10.1109/TIA.2021.3088769
Wu, Y., Lin, Z., Liu, C., Huang, T., Chen, Y., Ru, Y., et al. (2022). Resilience enhancement for urban distribution network via risk-based emergency response plan amendment for ice disasters. Int. J. Electr. Power & Energy Syst. 141, 108183. doi:10.1016/j.ijepes.2022.108183
Wu, Y., Yang, W., Hu, Y., and Dzung, P. (2018). Frequency regulation at a wind farm using time-varying inertia and droop controls. IEEE Trans. Ind. Appl. 55, 213–224. doi:10.1109/TIA.2018.2868644
Xu, X., Huang, L., Wang, Z., He, J., and Xin, H. (2019). Analysis on impact of virtual inertia control of DFIG-based wind turbine on electromechanical oscillation of power system. Automation Electr. Power Syst. 43, 11–17. doi:10.7500/AEPS20180925001
Yang, D., Jin, E., You, J., and Hua, L. (2020). Dynamic frequency support from a DFIG-based wind turbine generator via virtual inertia control. Appl. Sci. (Basel). 10, 3376. doi:10.3390/app10103376
Ye, H., Pei, W., and Qi, Z. (2015). Analytical modeling of inertial and droop responses from a wind farm for short-term frequency regulation in power systems. IEEE Trans. Power Syst. 31, 3414–3423. doi:10.1109/TPWRS.2015.2490342
Zhang, B., Soltani, M., Hu, W., Hou, P., Huang, Q., and Chen, Z. (2018). Optimized power dispatch in wind farms for power maximizing considering fatigue loads. IEEE Trans. Sustain. Energy 99, 862–871. doi:10.1109/TSTE.2017.2763939
Zhang, X., He, W., and Hu, J. (2020). Impact of inertia control of DFIG-based WT on torsional vibration in drive train. IEEE Trans. Sustain. Energy 99, 2525–2534. doi:10.1109/TSTE.2020.2964837
Zhang, B., Mohsen, S., Hu, W., Hou, P., and Chen, Z. (2016). A wind farm active power dispatch strategy for fatigue load reduction. Proceedings of the American Control Conference. Boston, MA, USA, 5879–5884. doi:10.1109/ACC.2016.7526591
Keywords: wind turbine, frequency regulation, fatigue load, synthetic inertia, power system
Citation: Wang H, Liu Y, Wang X, Guo G and Wang L (2023) Dynamic synthetic inertial control method of wind turbines considering fatigue load. Front. Energy Res. 10:1067896. doi: 10.3389/fenrg.2022.1067896
Received: 12 October 2022; Accepted: 18 November 2022;
Published: 06 January 2023.
Edited by:
Nantian Huang, Northeast Electric Power University, ChinaReviewed by:
Kenneth E. Okedu, National University of Science and Technology (Muscat), OmanCopyright © 2023 Wang, Liu, Wang, Guo and Wang. This is an open-access article distributed under the terms of the Creative Commons Attribution License (CC BY). The use, distribution or reproduction in other forums is permitted, provided the original author(s) and the copyright owner(s) are credited and that the original publication in this journal is cited, in accordance with accepted academic practice. No use, distribution or reproduction is permitted which does not comply with these terms.
*Correspondence: Hanbo Wang, d2FuZ2hiQHNtYWlsLnN1dC5lZHUuY24=
Disclaimer: All claims expressed in this article are solely those of the authors and do not necessarily represent those of their affiliated organizations, or those of the publisher, the editors and the reviewers. Any product that may be evaluated in this article or claim that may be made by its manufacturer is not guaranteed or endorsed by the publisher.
Research integrity at Frontiers
Learn more about the work of our research integrity team to safeguard the quality of each article we publish.