- 1Exploration and Development Research Institute of Daqing Oilfield Co. Ltd., Daqing, China
- 2Heilongjiang Provincial Key Laboratory of Reservoir Physics & Fluid Mechanics in Porous Medium, Daqing, China
- 3Key Laboratory of Enhanced Oil Recovery of Education Ministry, Northeast Petroleum University, Daqing, Heilongjiang, China
This study examined an enhanced foam-flooding system incorporating nanoparticles and polymers under geological conditions of a reservoir of the Shu 16 block in the Yushulin oilfield. The system is mainly comprised of an anionic foaming agent (CQS-1) and a nonionic surfactant (FH-1). We screened 17 foams by evaluating their foaming volumes and foam half-lives using a Waring-blender and dynamic foam analysis methods, and nanoparticles were selected after examining each foam’s concentration, the ratio of the main agent to the auxiliary agent, and the dosage of the foam stabilizer. Then, we analyzed the selected system’s microstructure and rheological properties, including the adaptability of the reservoir to its temperature resistance, salt tolerance, and adsorption resistance. As a result, this study supports the field application of CO2 foam flooding.
1 Introduction
Foam-flooding technologies and methods have become important for stabilizing and increasing production in China’s oilfields (Zhang et al., 2015; Wang et al., 2016; Liu et al., 2021), but the key to the widespread application of this technology is whether the foam can exhibit good stability in the reservoir. Specifically, 0.1% polyacrylamide (HPAM) was previously investigated, and although it increased the half-life of foam precipitation 2.7 times, its foaming capacity decreased. Additionally, it reduced the foaming capacity and was unconducive to actual production demand, while adding HPAM provided foam stability. Betaine was also found to increase the foam breakage half-life at 60°C by more than 1.7 times (Liu et al., 2010). Therefore, surfactants (Basheva et al., 1999; Dhanuka et al., 2006) have been incorporated into CO2 foams. Again, investigations revealed that while the apparent viscosity of SC–CO2 foams stabilized with surfactants and polymers was significantly higher (by several orders of magnitude) than that of a pure gaseous foam (Da et al., 2018), the strength or solubility of surfactants started to degrade under high temperatures and salinity and resulted in poor foam stability.
Conversely, since nanoparticles (NPs) make foam flooding more efficient (Yousef et al., 2017), they have been identified as the most effective agent to stabilize CO2 foams because of their high chemical stability at high temperatures and salinity (Alzobaidi et al., 2017). For example, compared with conventional methods, extraction effects significantly improved after adding nano SiO2 particles under severe formation conditions (Ding et al., 2019), but different formation conditions had different requirements for each foam-flooding system. Specifically, in low-permeability reservoirs, fractures usually develop to varying degrees as in well-developed cases, where the CO2 preferentially flows along the most dominant fractures/channels and forms “bypassed” regions (Ding et al., 2019). Hence, since the bypassed oil in these regions was not efficiently retrieved because there were no direct physical displacements, the dominant mechanisms responsible for recovering such oils were the interactions with the CO2-crude oil systems (usually based on extraction, gas dissolution, etc.) (Jin et al., 2017a,b). Hence, foaming agents must be selected for each case by evaluating all factors, such as the chemical stability under reservoir conditions, environmental concerns because of potential toxicity, economic aspects governed by the price, the volume of the foaming agent needed, and the foaming agent ability to generate a sufficiently strong and stable foam. Therefore, researchers have been investigating chemically modified CO2 systems to select the system that best improves the performance of CO2 when it is used for low-permeability oils since the gas channeling problem is inevitable for less fractured reservoirs.
As part of these ongoing studies to address the problem of gas channeling, this study investigated a suitable foam system in Yushulin using a Waring-blender and dynamic foam analysis (DFA) methods, after which the temperature resistance, salt resistance, adsorption resistance, rheological property, and microstructure were evaluated and characterized.
2 Materials and methodology
2.1 Materials
The anionic foaming agents used in this study were CQS-1 and SDS (analytical grade, Aladdin reagent), while the anionic–nonionic foaming agents were CST-1, CST-2, and CCT-1 (analytical grade, Aladdin reagent). In contrast, MOA-7 (primary alcohol ethoxylate, analytical grade, Aladdin reagent), NP-7 (alkylphenol ethoxylates, analytical grade, Aladdin reagent), Triton X-100 (analytical grade, Aladdin reagent), Triton OS (analytical grade, Aladdin reagent), Triton LAO-30 (amine oxide, analytical grade, Aladdin reagent), Triton NP-7 (analytical grade, Aladdin reagent), and Triton CAD-40 (analytical grade, Aladdin reagent) were used as the nonionic foaming agents. In addition, we used the cationic foaming agent DTAC (dodecyl trimethyl ammonium chloride, analytical grade, Aladdin reagent), Zwitterionic foaming agents LH-1 (betaine type, analytical grade, Aladdin reagent), CAB-35 (industrial products, Shandong Yousuo Chemical), LH-2 (betaine type, analytical grade, Aladdin reagent), and FH-1 (betaine type, analytical grade, Aladdin reagent), and foam stabilizers DQL (industrial product, Daqing Refinery, and the Chemical Company), NS-2 (7–40nm, Aladdin reagent), TEA-18 (analytical grade, Wuxi Yatai), TEA-20 and TEA-22 (analytical pure, Yifa Biotechnology), TEA-24 (analytical pure, Tianjin Comeo), and benzethonium chloride (analytical pure, Shanghai Zhanyun Chemical Co. Ltd.). As a result, the simulated formation water in the Yushulin oilfield was mainly comprised of CO32–, HCO3–, Cl−, SO42–, Ca2+, Mg2+, and Na+ with a total salinity of 4,765.6 mg/L.
2.2 Methodology
2.2.1 Instruments
Three parallel tests were conducted in subsequent experiments using the following instruments: an LBJ-625 high-speed agitator (Guangdong Lobe), a JD90-D powerful electric agitator (Shanghai Specimen), a KQ-200VDE ultrasonic numerical control cleaning machine (Kunshan Shumei), an SHZ-B constant temperature water bath oscillator (Shanghai Hetian), a DFA-100 dynamic foam analyzer (KRUSS, Germany), a HAAKE RS6000 rotational rheometer (Germany Thermo Fisher), and a Quanta 450 field emission environmental scanning electron microscope (FEI, United States). Three parallel tests were set up in the following experiments.
2.2.2 The Waring-blender method
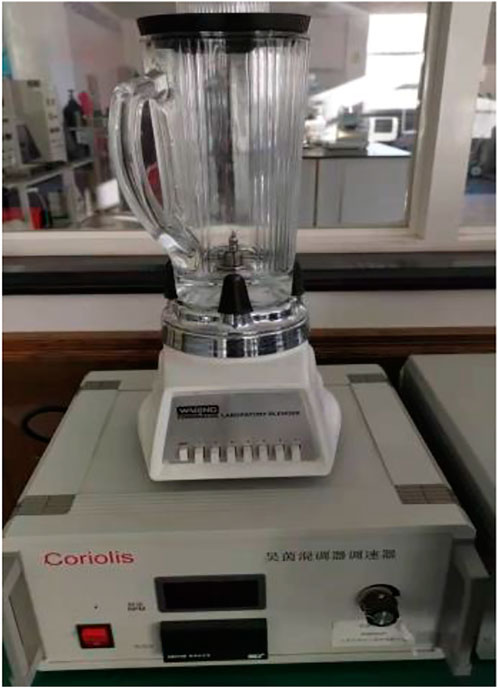
A 100 ml solution was added to the measuring cup and stirred at a constant speed (18,000 r/min) for 60 s. Next, the solution was poured into a 1,000 ml measuring cylinder and we recorded the produced foam volume as V0, including the time t1/2 when the discharged liquid reached 50 ml in the foam. Then, the foam composite index FCI was obtained from Eq. 1. The experimental apparatus is also shown in Figure 1.
where FCI is the comprehensive index of the foam (ml·min), V0 is the maximum foaming volume (ml), and t1/2 is the precipitation half-life (min).
2.2.3 The DFA method
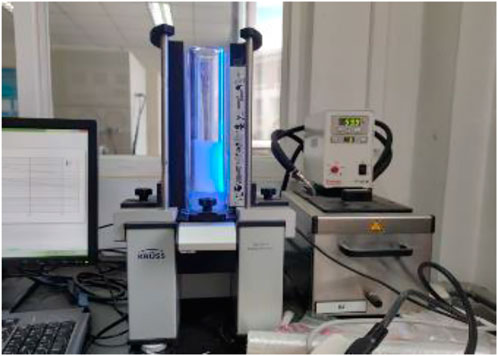
Here, the foam solution (100 ml) was measured at a medium temperature and ventilated at a certain temperature (60–90 °C) according to certain gas–liquid ratios. Then, we recorded the foam’s maximum height H0 (mm) and half-life (s). Finally, the foam’s volume was calculated according to the diameter of the measuring cylinder, after which the comprehensive foam index was also calculated according to Eq. 1. The experimental apparatus is shown in Figure 2.
2.2.4 Screening of the main foam method
We used simulated formation water to prepare 100 ml of the foaming agent solutions with concentrations of 0.1%, 0.3%, 0.5%, and 0.7%. Then, at room temperature, the Waring-blender method was used to stir for 1 min, and then the foam was poured into the measuring cylinder to observe and record the foam’s maximum foaming volume and half-life. Finally, and according to Eq. 1, the foam comprehensive index of the foam system was calculated, followed by an evaluation of foam performance using the DFA-100 dynamic foam analyzer and according to the gas–liquid 1:1 ratio intake.
2.2.5 Evaluation of the antisorption performance
For this analysis, 2 g of oil sand was accurately weighed and added to the conical flask. After fully wetting with an appropriate amount of simulated mineralized water (total mineralization was approximately 4,765.6 mg/L), the aqueous foam solution was added (foam solution concentration was follows: 0.1%wt, 0.3%wt, 0.5%wt, and 0.7%wt). After shaking at 90 °C for 24 h, we subjected it to centrifugation. Then, we collected 1 ml of the supernatant and determined the main foaming agent’s content before and after adsorption by two-phase titration [8]. Finally, the adsorption capacity was calculated using Eq. 2:
where V0 is the volume of the benzethonium chloride solution consumed by 1 ml of the foam solution before the adsorption experiment (ml), V is the volume of the benzethonium chloride solution consumed by 1 ml of the foam solution after the adsorption experiment (ml), C is the concentration of the benzethonium chloride solution (mol/L), and M is the relative molecular mass of the foaming agent (g/mol).
2.2.6 Steady-state shear test
A steady state shear test was conducted with the HAAKE RS6000 rotary rheometer (90 °C, constant shear rate of 10 s−1). The apparent viscosity of the solution at stability was measured (90 °C and the shear rate ranged from 0.001 to 1000 s−1). Shear experiments were conducted on the optimal foam formula system, and logarithmic points were collected to obtain the shear rate scanning curve. The apparent viscosity curve of the foam system was obtained by scanning at a constant temperature of 90 °C and a constant shear rate of 10 s−1.
2.2.7 Viscoelasticity measurements
This measurement was performed to obtain the energy storage modulus (G’) and the energy dissipation modulus (G”) at 90 °C and a dynamic frequency range of 0.05–10 Hz.
2.2.8 Characterization of the microstructure
The foam samples of the compound system were placed in a thermostat at 90 °C. After aging for 1 day, the high-temperature and high-pressure foam working fluids were bubbled using a test device. The experimental temperature T was −180 °C and pressure p was 0–40 MPa. After the samples’ temperatures in the observation box were rapidly lowered to −60 °C by adding liquid nitrogen, the samples were observed on a quanta 450 field emission environmental scanning electron microscope.
3 Results and discussion
3.1 Screening for the best foaming system
3.1.1 Screening of the main foams
Foam properties are usually evaluated based on the foaming volume (the foaming capacity of the surfactant) and half-life (stability of the foam).
It was evident from Figures 3A,B that within the concentration range of 0.1%–0.7%, the foaming volume and half-life gradually increased with a concentration increase. However, when the concentration of the foaming agent increased to 0.5%, the foaming volume no longer grew as fast, because with the increase in foam concentrations (Nguyen et al., 2003), the surfactant molecules were enriched on the surface of the solution and formed a dense surface film. As a result, the liquid film’s surface strength increased, the liquid film drainage was blocked, and the foam surface’s viscosity increased, which increased the foaming volume and made the foam more stable. When the foam concentration continued to increase (Barbian et al., 2005), the foaming agent on the foam liquid-membrane surface concentration became too large, the density increased, and the formation of the foam liquid content was reduced. However, with an increase in “rigidity,” liquid film drainage increases and ultimately decreases the stability of the foam.
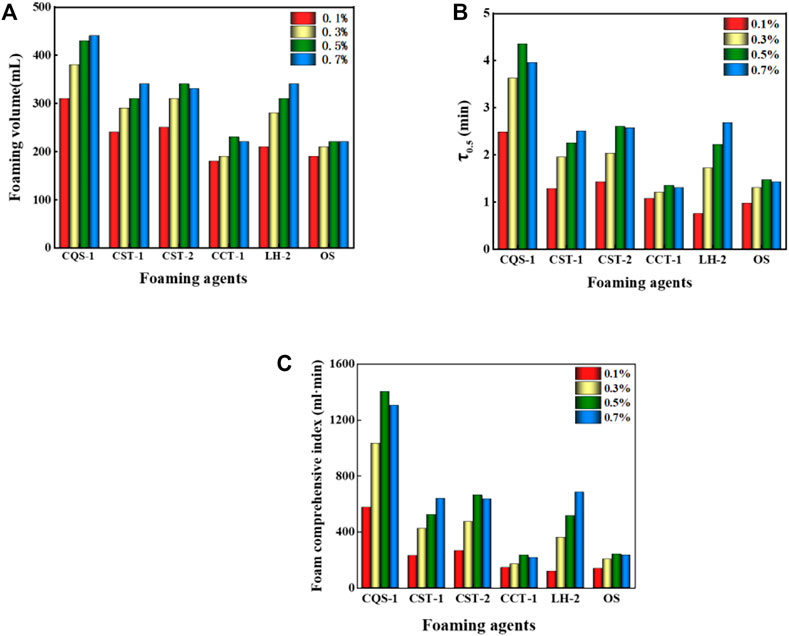
FIGURE 3. (A) Volumes of different foams with different concentrations. (B) The half-life of different foams with different concentrations. (C) Comprehensive indices of different foams and concentrations.
Next, we comprehensively analyzed the foam performance. The performance order for several foams was anionic > amphoteric > nonionic, which is consistent with the determination results of a previous article (Ma et al., 2014). However, of the anionic foams, CQS-1, CST-1, and CST-2 had better overall performance with the comprehensive foam index at 0.5% for the CQS-1 solution and reached greater than 1,000 ml·min, which made it the best foaming agent. In contrast, while the comprehensive foam index of 0.7% CST-1 and CST-2 solutions was approximately 700 ml·min, the CST-2 was slightly better than CST-1, but there was a big gap compared with CQS-1. For the anionic–nonionic OS and CCT-1 foams, while the foam-integrated index was low, only 1/5 of CQS-1, the foam grade was relatively small. Finally, the amphoteric LH-2 foam with a comprehensive foam index close to CST-1 at the 0.7% concentration (680 ml·min) was selected as a compounding agent. Interestingly, the selected foam had a consistent optimal concentration range that was 0.5%.
3.1.2 Effect of viscosity increasing stabilizers and liquid film reinforcing agent concentrations on foam performance
Foam stability improvements are mainly achieved by adding foam stabilizers (Jiang et al., 2011), where the surface adsorption strength or foam liquid phase viscosity is increased to form an elastic film. Therefore, we chose a 0.5% CQS-1 solution and added a DQL thickening stabilizer and the NS-2 nanoparticle liquid-film enhancer to prepare a ternary composite reinforced foam system. Under the same concentrations of DQL and NS-2, the effect of the tackifier and stabilizer concentrations on the performance of the foam system was then investigated. Figure 4 shows the experimental results.
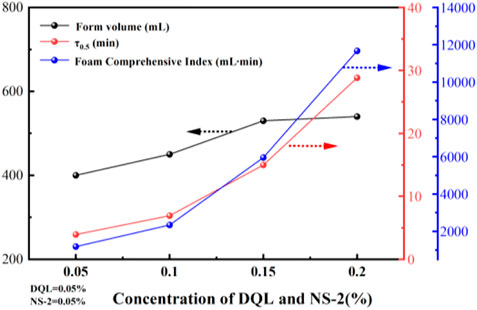
FIGURE 4. Effect of the foam stabilizer concentrations on the performance of the 0.5% CQS-1 foam system.
It is evident from Figure 4 that with an increase in the concentrations of DQL and NS-2, the foam performance of the 0.5% CQS-1 foam system was significantly improved. However, when the concentrations of DQL and NS-2 were both at 0.15%, the half-life sharply increased and the comprehensive foam index suddenly changed. Generally, studies have confirmed that the stability of foam depends on the liquid film discharge rate (Wang et al., 2008; Yu et al., 2014; Guo and Aryana, 2016; Nazari et al., 2017). Similarly, we recorded that as the addition of two foam stabilizers increased, the foaming solution’s viscosity and the liquid film’s surface strength, which delayed the drainage time, reduced the liquid film’s thinning rate. This enhanced the mechanical strength of the foam film. This finding was proposed because the hydroxyl groups on the surface of the NS-2 nanoparticles combined with the carboxyl and amide groups in the DQL molecule through hydrogen bonds and Vander Waals forces to form a more stable spatial network structure.
Conversely, when the concentrations of the two foam stabilizers were 0.2% each, the comprehensive foam indices reached 11,672 ml·min, and the half-life and foaming volume results were 28.82 min and 540 ml, respectively. Moreover, compared with the single agent with a concentration of 0.5% CQS-1, we also observed that the half-life increased eight times, the stability significantly increased, the foam level of the foam system was very strong, and it was part of the best three-component reinforced foam system. However, considering the stratum injection, the foaming system with 0.5% CQS-1/0.15% DQL/0.15% NS-2 should be selected.
3.1.3 Effect of concentration, thickening type, and stabilizing foam promoter on foam performance
Four thickening foam stabilization accelerators (TEA-18, TEA-20, TEA-22, and TEA-24) were selected and compounded with the 0.15% CQS-1/0.1% DQL/0.1% NS-2 system (noted as 1#) to further enhance the foam stabilization performance of the foaming system. Then, the performances of the foam system were investigated when the accelerator concentrations were 0.05%, 0.1%, 0.15%, and 0.2%, followed by the selection of a thickening and stabilizing agent with the best foam stability. Figure 5 shows the experimental results.
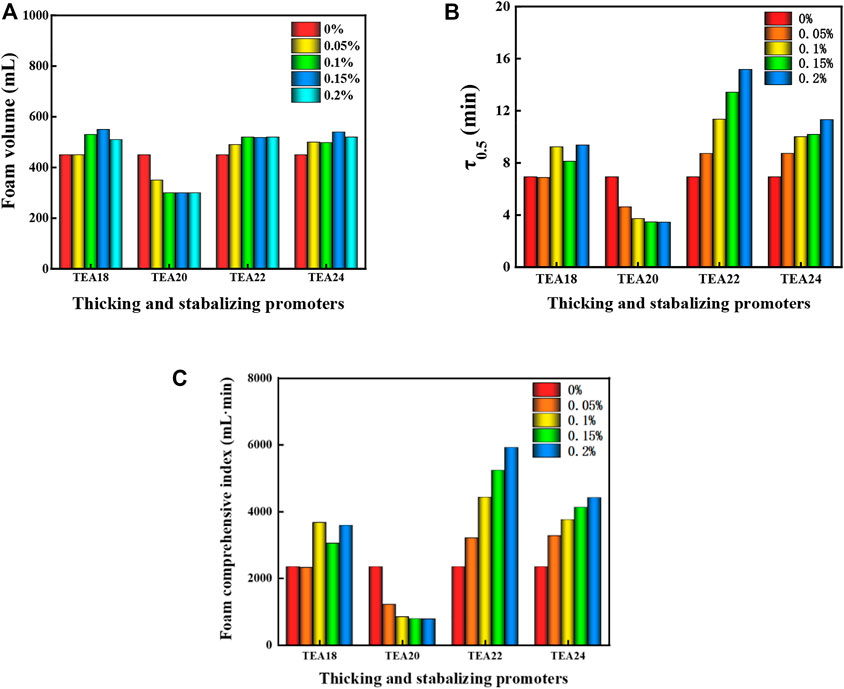
FIGURE 5. Effects of different thickening and stabilizing accelerator concentrations on the performance of the 1# foam system. (A) The foaming volume for different foam types with different concentrations. (B) The half-life of different foam types with different concentrations. (C) Comprehensive indices of different foam types with different concentrations.
According to the comparison in Figure 5, except for TEA-20, the foaming volume and half-life increased by varying degrees with increasing accelerator concentrations. Specifically, TEA-22 significantly changed when the concentration reached 0.2%; the foam composite index reached the maximum value, the foam composite index was 5,916 ml·min, which was 2.5 times higher than that without TEA-22, and the foam performance was excellent. Therefore, compared with TEA-20 and TEA-18 and since TEA-22 has greater advantages, it was selected as the accelerator for system 1#.
3.2 Dynamic method for screening the best foaming system
3.2.1 Screening foam type and dosage
Figure 6A shows that within the investigated concentration range, the foaming volume did not significantly change with the concentration, most of which were concentrated from 110–140 ml. However, while the foaming volume of CQS-1, CST-1, OS, NP-7, DTAC, and CAD-40 increased with an increase in concentration, SDS, CST-2, and FH-1 showed an obvious downward trend. Thus, we judged that the best concentration range was 0.3%–0.5% to ensure sufficient foaming volume. In addition, since CQS-1 showed obvious increasing changes, we determined that a higher concentration could be used to achieve better foaming volume when the cost allows. Therefore, CQS-1 was selected as the main foaming agent. This conclusion is consistent with Section 2.2.5.
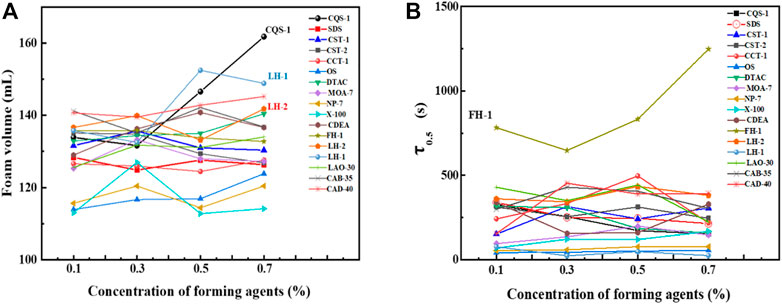
FIGURE 6. Effects of foam concentrations on the foam volume (A) and foam half-life (B) of several foams.
As observed in Figure 6B, the foam stability of CQS-1 and LH-1 with excellent foaming properties decreased with increasing concentration. We also observed that while the foaming properties of the nonionic surfactant FH-1 and the four amphoteric surfactants were rich and fine, with good viscoelasticity, the foam was the most stable. However, with an increase in the concentration, the foam decreased first and then increased, and the 0.7% FH-1 composite index was the highest, reaching 2071 ml·min. Therefore, combining the 0.5% aqueous solution foam performance of the surfactant series shown in Figure 7 with the foaming performance, foam stabilizing performance, and cost factors, the optimal foam stabilizing compound was FH-1.
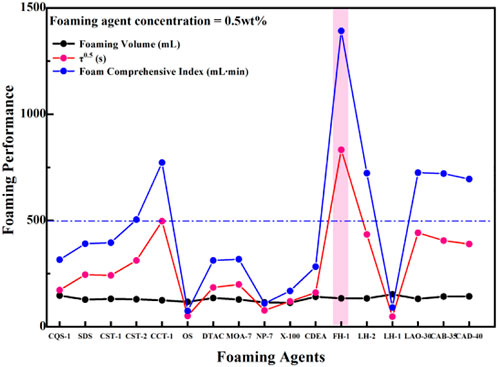
FIGURE 7. Comparison between the foam performance of a 0.5% aqueous solution and a series surface active agent.
3.2.2 Influence of the mass ratio of the main and auxiliary foam agents on foam performance
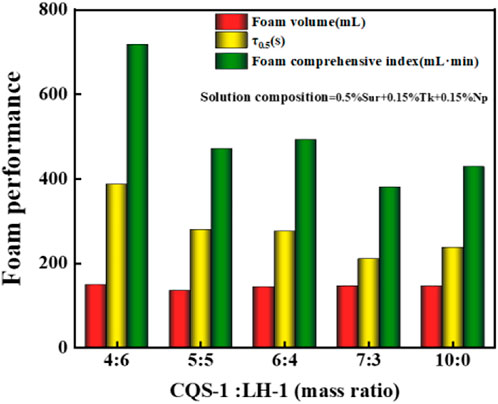
Since the synergism between surfactants can enhance the effect of foaming and stabilizing bubbles, we chose CQS-1 and FH-1 to make the foaming-agent mixture. We investigated the effect of the mass ratio of CQS-1 and compound additives on the foam properties of the composite foam system. Experiments were conducted according to the 0.5% foaming agent/0.15%DQL/0.15%NS-2 solution using the DFA method and the ratio of gas to liquid of 1:1. Figure 8 shows the experimental results.
It was evident from Figure 8 that when the mass ratio of CQS-1 to FH-1 was less than 1:1, it had good compound and positive synergistic effects and effectively stabilized the foam. Hence, considering the cost of use, we determined that while the suitable compounding ratio was CQS-1:FH-1 = 4:6, the composition of the compounding foam ternary composite reinforced foam system was 0.5% (CQS-1:FH-1 = 4:6)/0.15% DQL/0.15% NS-2 and was recorded as the 2# system.
3.3 Reservoir suitability evaluation of the preferred foam system
3.3.1 Temperature resistance of the ternary composite reinforced 2# system
With a DFA-100 dynamic foam meter and according to a gas–liquid ratio of 1:1, the temperature resistance performance of the 2# system (0.5% (CQS-1:FH-1 = 4:6)/0.15% DQL/0.15% NS-2) was measured at 60 °C, 70 °C, 80 °C, and 90 °C. Figure 9 shows the experimental results.
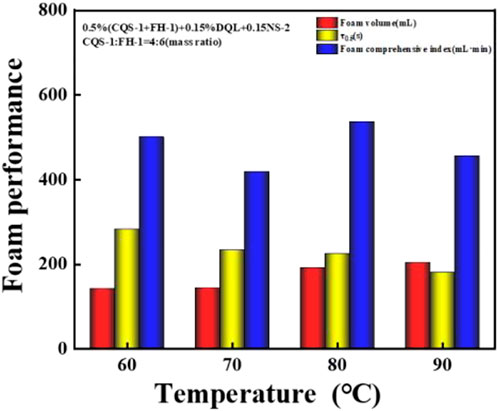
FIGURE 9. Effect of temperature changes on the foam performance of the CQS-1/FH-1 compounding system.
As shown in Figure 9, the 2# system had excellent temperature resistance with an increase in temperature related to higher foaming ability, but this also caused the foam stability to slightly fluctuate. Similarly, the foam index was not great at the 60–90 °C interval and fluctuated slightly at 500 ml·min; and therefore, the 2# system has excellent temperature resistance.
3.3.2 Salt resistance of a ternary composite reinforced 2# system
The 2# system was mineralized with a salinity of 1,000 mg/L, 3,000 mg/L, 5,000 mg/L, 8,000 mg/L, 12,000 mg/L, and 15,000 mg/L after which the 2# foam system with 0.15% TEA-22 was added. The influence of salinity on the foam performance of the 2# system was also investigated at 90 °C using the DFA-100 dynamic foam tester. Figure 10 shows the experimental results.
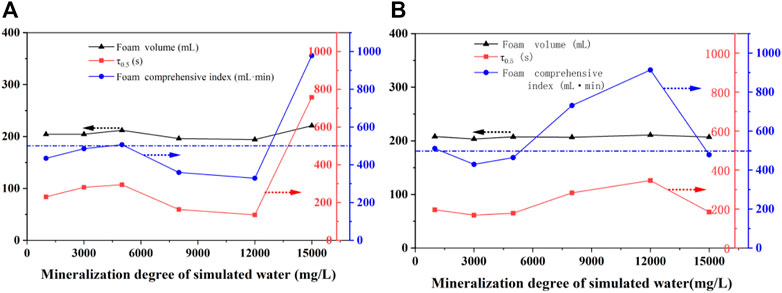
FIGURE 10. Effect of mineralization degree on the foam performance of a 2# foaming system without (A) and with (B) TEA-22.
It was evident from Figure 10A that with an increase in the salinity of simulated water, the foaming ability of the 2# system and its TEA-22 strengthening system were hardly affected. However, in the range of 1,000–5,000 mg/L and as the salinity increased, the foam half-life of the 2# system slightly increased, the salinity continued to increase, and the half-life decreased. Finally, at 12,000 mg/L, the half-life dropped to a minimum of 136 s. This is because the addition of a strong electrolyte led to the diffusion of the electric double layer on the surface of the liquid film and decreased the zeta potential, which resulted in poor foam stability. In contrast, the half-life increased sharply to 355 s when the salinity was 15,000 mg/L and caused the foam composite index to be 980 ml·min.
Figure 10B shows that while the foaming volume changed little after adding TEA-22 to the 2# system, the half-life of the foam increased with an increase in salinity. As a result, while high foam performance was produced when the salinity was 12,000 mg/L (a half-life of 350 s and a comprehensive foam index of 910 ml·min), the high foam performance was maintained in the salinity range of 5,000–15,000 mg/L (comprehensive foam index >500 ml·min).
Within the mineralization degree of 1,000–15,000 mg/L and while the comprehensive foam index of the 2# system was higher than the 350 ml·min, the optimal formulation system showed better salt resistance after TEA-22 reinforcement, which indicates that the preferred 2# composite foam system had excellent salt resistance. However, TEA-22 was considered if improvements were required.
3.3.3 Static adsorption performance of the ternary composite reinforced 2# system
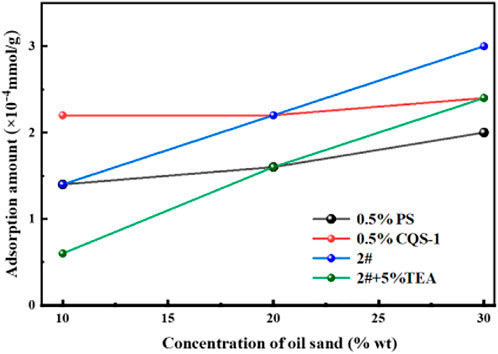
The core adsorption and retention conditions indicate the industrial application feasibility of an oil-repellent system. After separately weighing 2 g of oil sand and adding the appropriate amount of water to wet it, the sand-foaming liquid system with a solid-liquid ratio of 1:9, 1:4, and 3:7 was prepared and the adsorption was shaken at 90 °C for 24 h. Then, the adsorption capacity of the main foaming agent on the core was measured by two-phase titration. A comparison of the petroleum sulfonate PS with the main foam agent CQS-1 2# system and the TEA-22 enhanced 2# system and CQS-1 adsorption on oil sands is shown in Figure 11.
However, from Figure 11 we observed that within the investigated range, while the adsorption of the main foam CQS-1 on the oil sand increased with an increase in the solid-liquid ratio, the adsorption amount varied from 1.4 to 3.0 × 10⁻⁴ mmol/g. This finding shows that the preferred system strengthened by TEA-22 was slightly helpful in reducing the adsorption loss. However, the system’s viscosity further increased, which decreased the foaming agent’s diffusion speed to the oil sand’s surface.
3.4 Analysis of the foam system’s rheology
Under the oil reservoir conditions of Block Shu 16 (90 °C with a total mineralization degree of 4,765.6 mg/L), a comparative rheological experiment was conducted for the preferred 2# foaming system. Then, the HAAKE RS6000 rotary rheometer was used to conduct rheological comparison experiments to study the foam system, after which we understudied the foam system’s apparent viscosity, shear thinning, and viscoelasticity. Figure 12 shows the experimental results.
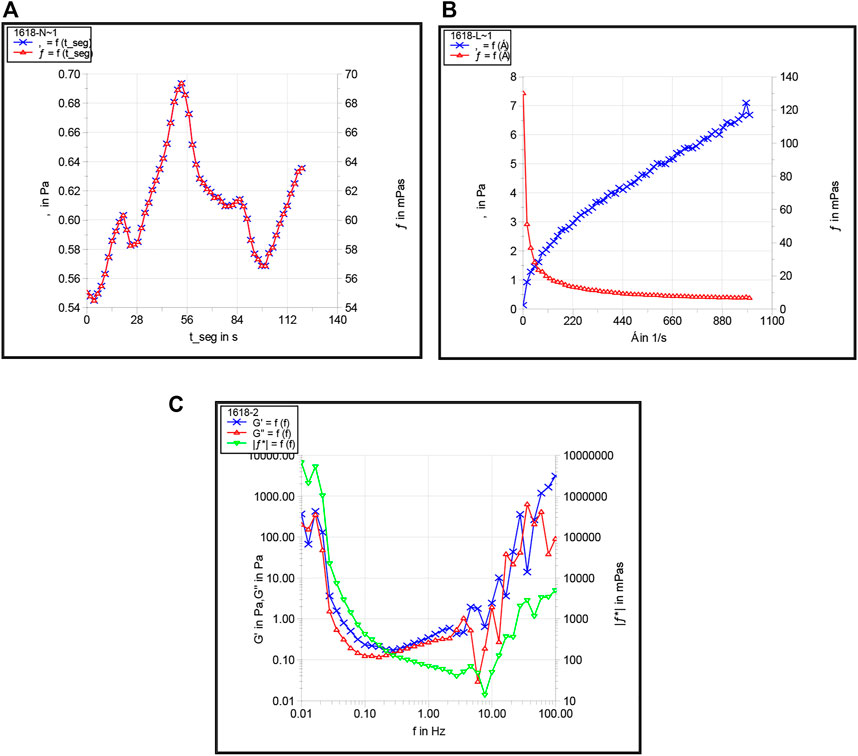
FIGURE 12. Apparent viscosity (A), shear thinning (B), and viscoelasticity (C) of the preferred foam system.
It was evident from Figure 12 that with an increase in shearing time, the viscosity of the foam system was stable at 60 mPa·s under 90 °C. However, with an increase in shear rate, the apparent viscosity of the foam system showed a downward trend with certain characteristics of the Bingham model and a certain degree of shear dilution, which indicated that the greater the shear stress, the greater the degree of decrease in viscosity. We also observed that the 2# syntactic foam system had good shear resistance and good viscoelasticity with the foam system and gradually increased in the range of the middle frequency band and showed better elastic behavior.
3.5 Microstructural characterization of the foam system
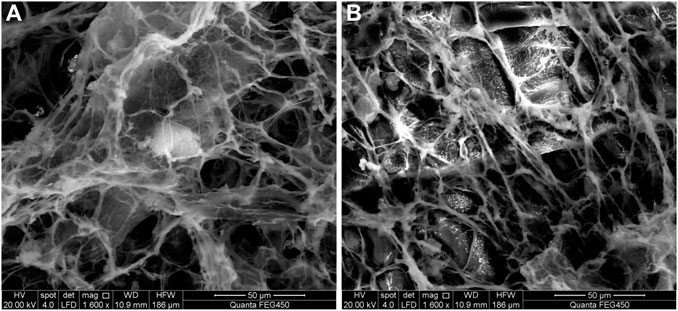
Subsequently, a FEI Quanta 450 field emission environmental scanning electron microscope and freeze-fracture etching technology were used to observe the optimal foam system’s microstructure and to investigate the foam’s microstructural nature. The analysis results are shown in Figure 13. Also, Figures 14A,B show the pictures with and without TEA.

FIGURE 13. SEM micrographs at different scales of the preferred 2# foaming system. (A) 400x (B) 800x and (C) 1600x.
From Figure 13, it is evident that the molecules of the foam liquid are closely related to the “fish scale” structure (Figure 13A). We also observed that the DQL stabilizers interacted with each other in the foam liquid and formed a dense dendritic network structure, which made the intermolecular interaction closer (Figure 13B). Hence, with an increase in foam viscosity, smaller foam lamellae were arrayed more tightly, the foam’s half-life was prolonged, the foam lamellae were more stably retained, and the foam lamellae presented a tight planar network structure. Investigations also revealed that while bubbles interconnect, the gap between the bubbles formed a network channel for the flow of trace liquid (Figure 13C). However, from Figure 14 and compared with the absence of TEA, the foam lamellae significantly increased, the foam viscosity is increased, the smaller foam lamellae are arrayed more tightly, and the foam half-life is prolonged.
Simultaneously, while NS-2 nanoparticles partly adhered to the liquid membrane, causing the liquid film to have certain viscoelasticities, the other part adhered to the channel, which made the foam lamellae cross-link tighter. Therefore, the stability of foam lamellae is increased and the foam stability is improved.
4 Conclusions
1) The experimental results show that the 2# system (0.5% (CQS-1: FH-1 = 4:6)/0.15%DQL/0.15% NS-2) performed better than the other four systems for the Shu 16 block in the Yushulin oilfield. Notably, it had excellent temperature resistance, salt resistance, and anti-adsorption performance. Furthermore, under a gas–liquid ratio of 1:1, a higher comprehensive foam index than 500 ml·min was measured using a dynamic foam meter at 60–90 °C (935 ml·min at 80 °C).
2) The operational parameters for the 2# system were optimized. For instance, while the half-life was 355 s when the salinity was 15,000 mg/L, the foam composite index was 980 ml·min, and the adsorption amount of CQS-1 on oil sand was 1.4–3.0 × 10⁻⁴ mmol/g. As a result, the 2# system had the characteristics of pseudoplastic fluids as follows: good shear resistance and viscoelasticity that caused it (90 °C) to exhibit better elastic behavior.
3) While CO2 can accelerate the demulsification and oil–water separation of heavy oil emulsions, a surfactant reduces oil–water interfacial tension, generates foam, and significantly improves the oil displacement efficiency in larger pores. Therefore, the superior 2# system had foam stability through simple mixing, which elucidates the emulsification and demulsification of heavy oil using foam formula systems in low-permeability reservoirs.
Data availability statement
The original contributions presented in the study are included in the article/Supplementary Material, and further inquiries can be directed to the corresponding author.
Author contributions
YL: Critical revision of the manuscript. FZ: Administrative, technical, and material support. RN: Acquisition of data. SC: Statistical analysis. LL: Analysis and interpretation of data. YS: Critical revision of the manuscript.
Funding
This work was supported by the Opening Foundation of Provincial and Ministerial Key Laboratories: The Heilongjiang Provincial Key Laboratory of Reservoir Physics & Fluid Mechanics in Porous Medium, the Major Science and Technology Projects of PetroChina (Project No. 2021ZZ01-08), and the National Science and Technology Major Projects of China for Oil and Gas (Project No. 2016ZX05055).
Conflict of interest
YL and SC were employed by Exploration and Development Research Institute of Daqing Oilfield Co. Ltd.
The remaining authors declare that the research was conducted in the absence of any commercial or financial relationships that could be construed as a potential conflict of interest.
Publisher’s note
All claims expressed in this article are solely those of the authors and do not necessarily represent those of their affiliated organizations, or those of the publisher, editors, and reviewers. Any product that may be evaluated in this article, or claim that may be made by its manufacturer, is not guaranteed or endorsed by the publisher.
References
Al Ayesh, A. H., Salazar, R., Farajzadeh, R., Vincent-Bonnieu, S., and Rossen, W. R. (2017). Foam diversion in heterogeneous reservoirs: Effect of permeability and injection method. SPE J 22, 1–14. doi:10.2118/179650-PA
Alzobaidi, S., Lotfollahi, M., Kim, I., Johnston, K., and DiCarlo, D. (2017). Carbon dioxide-in-brine foams at high temperatures and extreme salinities stabilized with silica nanoparticles. Energy fuels 31, 10680–10690. doi:10.1021/acs.energyfuels.7b01814
Barbian, N., Hadler, K., Ventura-Medina, E. V., and Cilliers, J. (2005). The froth stability column: Linking froth stability and flotation performance. Miner. Eng 18, 317–324. doi:10.1016/j.mineng.2004.06.010
Basheva, E. S., Ganchev, D. N., Denkov, N., Kasuga, K., Satoh, N., and Tsujii, K. (1999). Role of betaine as foam booster in the presence of silicone oil drops. Langmuir 16, 1000–1013. doi:10.1021/la990777+
Da, C., Jian, G., Alzobaidi, S., Yang, J., Biswal, S. L., Hirasaki, G. J., and Johnston, K. P. (2018). Design of CO2-in-water foam stabilized with switchable amine surfactants at high temperature in high-salinity brine and effect of oil. Energy fuels 32, 12259–12267. doi:10.1021/acs.energyfuels.8b02959
Dhanuka, V. V., Dickson, J. L., Ryoo, W., and Johnston, K. (2006). High internal phase CO2-in-water emulsions stabilized with a branched nonionic hydrocarbon surfactant. J. Colloid Interface Sci 298, 406–418. doi:10.1016/j.jcis.2005.11.057
Ding, M. C., Wang, Y., Wang, W., Zhao, H., Liu, D., and Gao, M. (2019). Potential to enhance CO2 flooding in low permeability reservoirs by alcohol and surfactant as co-solvents. J. Petroleum Sci. Eng 182, 106305. doi:10.1016/j.petrol.2019.106305
Guo, F., and Aryana, S. (2016). An experimental investigation of nanoparticle-stabilized CO 2 foam used in enhanced oil recovery. Fuel 186, 430–442ISO. doi:10.1016/j.fuel.2016.08.058
Jiang, J. L., Yue, X. G., and Gao, Z. (2011). Role of polymer in polymer/foam combinational profile controlling and flooding technology[J]. Oil Drill. Prod. Technol 33 (1), 61–64.
Jin, J., Hawthorne, S., Sorensen, J., Pekot, L., Kurz, B., and Smith, S., (2017a). Advancing CO2 enhanced oil recovery and storage in unconventional oil play-experimental studies on Bakken shales. Appl. Energy 208, 171–183. doi:10.1016/j.apenergy.2017.10.054
Jin, L., Sorensen, J. A., Hawthorne, S. B., Smith, S. A., Pekot, L. J., and Bosshart, N. W., (2017b). Improving oil recovery by use of carbon dioxide in the bakken unconventional system: A laboratory investigation. SPE Reserv. Eval. Eng 20, 602–612. doi:10.2118/178948-pa
Liu, X. L., Li, N., Zhang, G. C., Wang, J., Ding, B. D., Zhang, L., et al. (2010). “Research on foam stabilization system for foam drive [C],” in Proceedings of the (11th) International Conference on Surface active agent and Detergents (ICSD2010) China.
Liu, Y., Zhao, F. J., Wu, Y. X., Xu, T., and Zhu, G. (2021). Study on the application of a steam-foam drive profile modification technology for heavy oil reservoir development. Open Chem 19, 678–685. doi:10.1515/chem-2021-0055
Ma, G. K., Lv, M., Qiao, Y. J., and Zhu, Z. Q. (2014). Foam system for composite foam flooding based on the gas flow screening method [J]. Appl. Sci. Technol. 41 (3), 77–80.
Nazari, N., Tsau, J. S., and Barati, R. (2017). CO2 foam stability improvement using polyelectrolyte complex nanoparticles prepared in produced water. Energies 10 (4), 516–16. doi:10.3390/en10040516
Nguyen, A. V., Harvey, P. A., and Jameson, G. J. (2003). Influence of gas flow rate and frothers on water recovery in a froth column. Miner. Eng 16, 1143–1147. doi:10.1016/j.mineng.2003.09.005
Wang, Q., Xi, H. L., and Zuo, Y. J. (2008). Discomfort evaluation and motion measurement. J. Chem. Industry Eng 28 (2), 25-1–25-8. doi:10.1201/9781420063523.ch25
Wang, W. B., Hong, L., Tian, Z. W., Wang, Q. R., Kang, X. Y., and Shen, Z. N. (2017). Research progress on performance improvement method of CO2 foam system [J]. Oilfield Chem. 34 (4), 749–755.
Wang, Y. L., Meng, L. T., Li, Q., Liang, L., Lan, J. C., Jiang, B. Y., et al. (2021). Study on preparation and performance of ternary compound CO2 enhanced foam system [J]. Appl. Chem. Ind. 50 (2), 295–298.
Wang, Y. L., Zhao, F. J., Song, J., and Yuan, T. L. (2016). Progress in temperature resistance and salinity tolerance foam agent for improving steam flooding [J]. Chemistry 79 (1), 23–30.
Yousef, Z., Almobarky, M., and Scheghter, D. S. (2017). Enhancing the stability of foam by the use of nanoparticles. Energy fuels 31 (10), 10620–10627. doi:10.1021/acs.energyfuels.7b01697
Yu, J., Khalil, M., Ning, L., and Lee, R. (2014). Effect of particle hydrophobicity on CO2 foam generation and foam flow behavior in porous media [J]. Fuel 126, 104–108. doi:10.1016/j.fuel.2014.02.053
Keywords: foam, nanoparticles, low-permeability reservoir, foam stability, CO2 foam-flooding surface active agent and detergents (ICSD 2010)
Citation: Liu Y, Zhao F, Niu R, Cao S, Liu L and Song Y (2023) Features of nanoparticle composite-enhanced CO2 foam-flooding systems for low-permeability reservoirs. Front. Energy Res. 10:1060356. doi: 10.3389/fenrg.2022.1060356
Received: 10 October 2022; Accepted: 30 November 2022;
Published: 06 January 2023.
Edited by:
Chungang Xu, Guangzhou Institute of Energy Conversion (CAS), ChinaReviewed by:
Yi-Song Yu, Guangzhou Institute of Energy Conversion (CAS), ChinaBai Jing, Zhengzhou University, China
Copyright © 2023 Liu, Zhao, Niu, Cao, Liu and Song. This is an open-access article distributed under the terms of the Creative Commons Attribution License (CC BY). The use, distribution or reproduction in other forums is permitted, provided the original author(s) and the copyright owner(s) are credited and that the original publication in this journal is cited, in accordance with accepted academic practice. No use, distribution or reproduction is permitted which does not comply with these terms.
*Correspondence: Fajun Zhao, ZmFqemhhb0AxMjYuY29t
 Yong Liu1,2
 Fajun Zhao