 Changhe Mu1
 Xiukun Wang
- 1Exploration Utility Department of CNPC Daqing Oilfield Co., Ltd., Daqing, Heilongjiang, China
- 2State Key Laboratory of Petroleum Resources and Prospecting, China University of Petroleum, Beijing, China
Quantitative characterization of the pore throat structures and reservoir properties of the tight sandstone in Fuyu oil layers of Sanzhao Sag, Songliao Basin, NE China was carried out using cast thin section (CTS), scanning electron microscopy (SEM) and high-pressure mercury intrusion (HPMI) combined with fractal theory. cast thin section and scanning electron microscopy describe the composition, pore filling, cementation, and connectivity of tight sandstones. Six different fractal models, i.e. 2D capillary model, 3D spherical model, 3D capillary model, geometric model, thermodynamic model, and wetting phase model are used to calculate the fractal dimension of pore size distribution using capillary pressure data of high-pressure mercury intrusion, and their correlations with reservoir properties were analyzed. The images of CTS and SEM show that the main lithology of this oil reservoir is tight sandstone, and the pore types are mainly intergranular dissolved pores and intragranular dissolved pores, with uneven pore distribution and poor connectivity. The study of the HPMI data shows that the throat sorting coefficient is the main influencing factor of tight sandstone permeability. The fractal dimensions calculated from the HPMI capillary pressure data using the 3D capillary model and the wetting phase fractal model have the strongest correlations with the reservoir properties compared with the other fractal model. As the fractal dimension increases, the pore throat structures become more heterogenous and reservoir properties become poorer. For the wetting phase fractal model, the calculated fractal dimension is positively correlated with the heterogeneity of the pore throat structure of tight sandstone, which is contrary to the fractal theory and is not suitable for analyzing pore throat structures. The fractal dimensions calculated from the thermodynamic model have no obvious correlations with reservoir properties and cannot quantitatively characterize the heterogeneity of tight sandstone.
1 Introduction
The resource reserves of tight oil are abundant but the effective development of tight oil reservoir is difficult that is due to ultralow porosity and permeability of reservoir formation. The permeability of the tight oil reservoir with overburden pressure is generally lower than 0.1 mD, porosity is less than 10% as usual, and pore throat diameter is typically less than 1 μm (Jia et al., 2012). The apparent permeability of tight oil reservoir decreases with the decreasing pore diameters (Xu et al., 2019). There are approximately 66 basins worldwide buried with tight oil. Currently, the geological resource reserves of the main basins in China are 10.67–11.15 billion tons (Jia et al., 2012). In China, the tight oil reserves are mainly distributed in Ordos, Junggar, and Songliao basins, and the confirmed tight oil reserves are more than 600 million tons (Jia et al., 2012). However, the ultimate oil recovery factor of the tight oil reservoir is generally low (Sheng, 2015), and the characterization of pore throat structures and reservoir formation properties are significant to developing tight oil reservoirs.
Fractal geometry theory refers to phenomena in which an object exhibits similarity to the whole at each of its own scales, and widely exists in nature (Mandelbrot and Mandelbrot, 1982). Mandelbrot (Mandelbrot and Mandelbrot, 1982) firstly proposed the fractal theory in the 1980s. Compared with traditional Euclidean geometry, fractal geometry can more accurately analyze and describe the complex pore structure. The fractal theory has been widely used in the analysis and research of pore throat characteristics, and the physical properties of reservoir formations are negatively correlated with fractal dimensions (Wang et al., 2018a; Wang et al., 2018b; Wang et al., 2019; Wang et al., 2021). The larger the fractal dimension, the more complex the pore throat characteristics of reservoir formations (Shi et al., 2018). With the development of pore throat structure description technology, many methods are applied to the description and analysis of pore throat characteristics in tight oil reservoirs, such as HPMI, constant-rate mercury injection, CT scanning, SEM, CTS, etc. As we all know, HPMI is widely used to analyze pore throat structures. The constant-rate mercury injection method can inject mercury into pore space at constant and low rates, and it can give a more detailed description of the core pore throat structure than conventional mercury intrusion methods (He et al., 2011; Li et al., 2012; Chen et al., 2013). However, it is hard to quantitatively characterize the pore throat structure with a pore size less than 0.12 μm in ultra-low permeability tight reservoir (Zhang et al., 2021). CT scanning can build a 3D digital rock without damaging the core and has been widely used to describe the characteristics of pore throat (Knackstedt et al., 2007; Arzilli et al., 2016). The CTS refers to injecting colored liquid gel into the pore space of core samples and making cores into thin sections after gel solidification. It has the advantages of simple and easy experiments, low requirements, and a short experimental cycle, while CTS cannot directly describe the pore throat characteristics in characterizing dense cores. Similar to CT scanning and CTS, the pore throat characteristics and composition can also be obtained from SEM images. The structural characteristics of different pore throats can be comprehensively studied with HPMI, X-CT, SEM, and other methods (Wang et al., 2018a), (Gutierrez and Jose, 2006; Martínez et al., 2010; Jouini et al., 2011).
Based on HPMI, CTS, and SEM tests, the pore throat characteristics of tight sandstones in Fuyu oil layers of Sanzhao Sag, Songliao Basin, NE China were characterized and analyzed by six fractal models, and the main influencing factors of permeability in other physical properties are analyzed as well. The pore throat and composition of tight sandstone are characterized and explored through CTS and SEM images, and the fractal dimensions of six different fractal models are calculated from HPMI capillary pressure data. The applicability of using fractal dimensions calculated from different models to characterize the pore throat characteristics and the correlation between fractal dimensions and reservoir physical parameters were analyzed.
2 Core samples
In this experiment, 19 low-permeability core samples were taken from the K1q4 layer from 1731.4m to 1955.85 m in the Songliao Basin and tested for HPMI. The porosity of the sample cores ranged from 2.7% to 15.389%, and the permeability was between 0.00042 mD and 0.73 mD. The basic information about the cores is shown in Table 1.
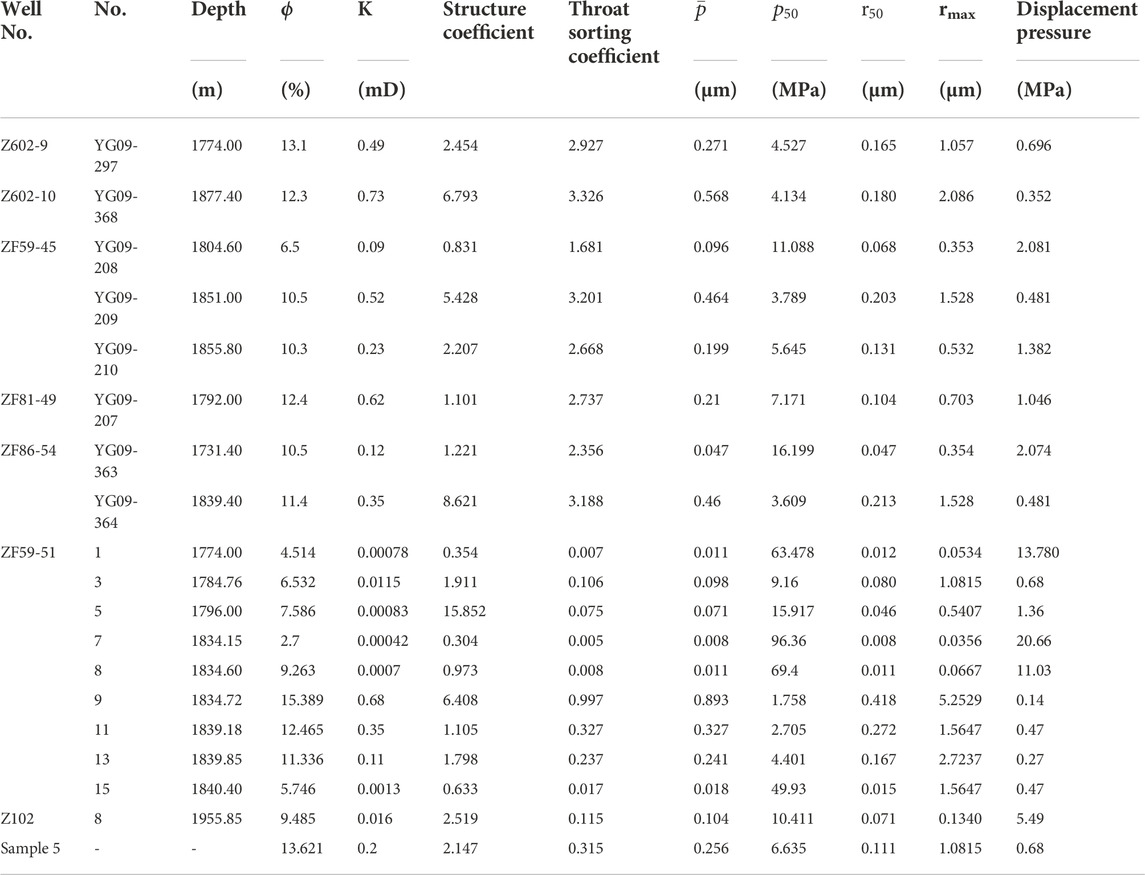
TABLE 1. The basic information about the cores.
2.1 Core analysis
The distribution of clay minerals in the reservoir is anisotropic, seriously affecting oil generation, reserves, flow, exploration, and development of oil and gas reservoirs. Core SEM images and thin section images can reflect the effect of clay mineral particle morphology and pore development.
2.1.1 Analysis of CTS images
The CTS images of core 3 of well Zhoufu 59–51 are shown in Figure 1, and the particles are in a medium fine grain structure. The intermediate basic rock debris is mainly andesite, and the metamorphic rock debris is mainly composed of quartzite and phyllite. Argillaceous matrix is filled with intergranular, and anhydrite and calcite are filled in pores and replaced particles, and pyrite is distributed in patches. It can be seen that the pores are unevenly distributed, and it is mainly intergranular dissolved pores with poor connectivity.
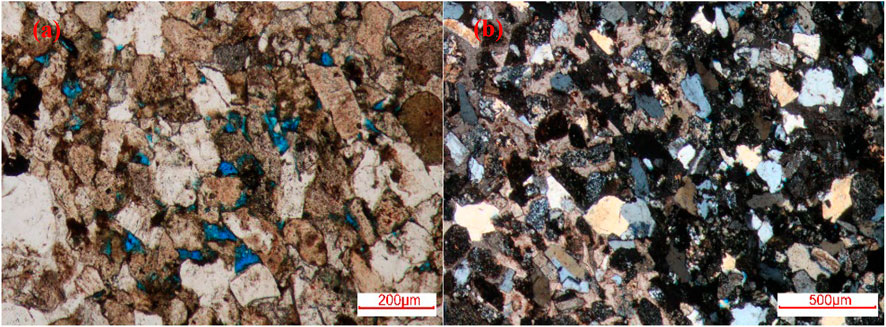
FIGURE 1. CTS image of No. 3 core of Zhoufu 59–51 well (A) The pore system is dominated by intergranular solvable pores with single-polarized light image (B) Gray-bearing medium fine-grained feldspar debris sandstone with orthogonal polarization image.
Figure 2 is a thin section photo of the cast body of No. 5 core of Zhoufu 59–51 well, and the particles are in a medium fine grain structure. Sedimentary debris is mainly micrite limestone, and metamorphic debris is mainly phyllite and quartzite. Argillaceous matrix is distributed among intergranular, and calcite and anhydrite fill pores and replace grains. Common quartz secondary enlargement can be seen, and pyrite shows a patchy distribution. Intergranular and intragranular dissolved pores are developed with poor connectivity.
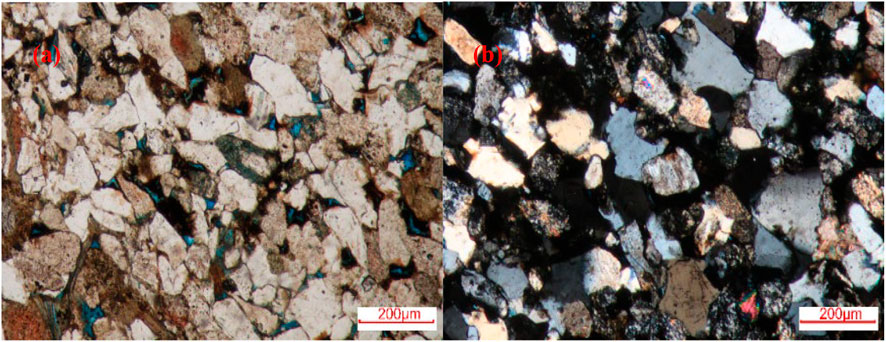
FIGURE 2. CTS image of No. 5 core of Zhoufu 59–51 well (A) The pore system is dominated by intergranular and intragranular solvable pores, single-polarized light image (B) Medium and fine-grained feldspar debris sandstone, orthogonal polarization image.
Core 9 of well Zhoufu 59–51 is shown in Figure 3, and the particles are of acceptable to excellent structure. The rock debris is mainly acid extrusive rocks. The argillaceous matrix is distributed among intergranular, and a small amount of calcite fills the pores and replaces the grains. Illite is distributed at the edge of grains, and pyrite is distributed in patches. There are a few inter-granular and intra-granular dissolved pores with poor connectivity.
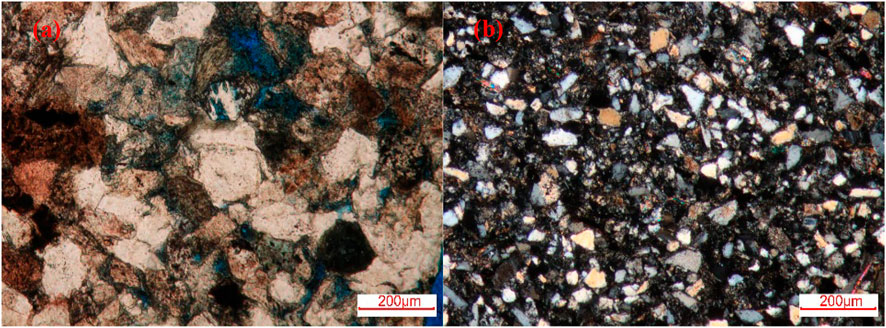
FIGURE 3. CTS image of No. 9 core of Zhoufu 59–51 well. (A) The pore system is dominated by intergranular and intragranular solvable pores, single-polarized light image (B) very fine-grained Feldspar chip sandstone contains mud, orthogonal polarization image.
According to Figure 4, it can be seen that the core of well Zhoufu 59–51 No. 11 is fine and medium grinding a small number of excellent particles. The intermediate bare cuttings are mainly andesite, and the metamorphic mainly consists of phyllite and quartzite. Argillaceous matrix is distributed among grains, and anhydrite is used to fill pores and replace grains. It can be also seen common quartz secondary enlargement. The pores are mainly intragranular dissolved pores and intergranular dissolved pores with poor connectivity.
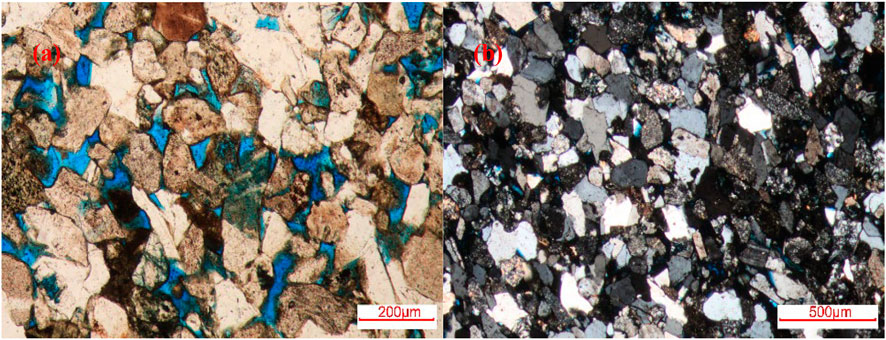
FIGURE 4. CTS of core 11 of Zhoufu 59–51 well. (A) The pore system is dominated by intergranular and intragranular solvable pores, single-polarized light image (B) Fine medium-grained feldspar debris sandstone, orthogonal polarization image.
2.1.2 Analysis of SEM images
Figure 5 is the scanning electron microscope image of No. 3 fine sandstone core of Zhoufu 59–51 well. It can be seen that the overall structure of the rock is relatively loose, the quartz crystal particles are secondarily enlarged and tend to be self-shaped, the secondary quartz crystals and hairy illite aggregates are attached to the particle surface, and the secondary albite crystals, hairy illite aggregates, calcite crystals, and honeycomb-like illite smectite are filled in the inter-granular pores. And residual intergranular pores can be seen.
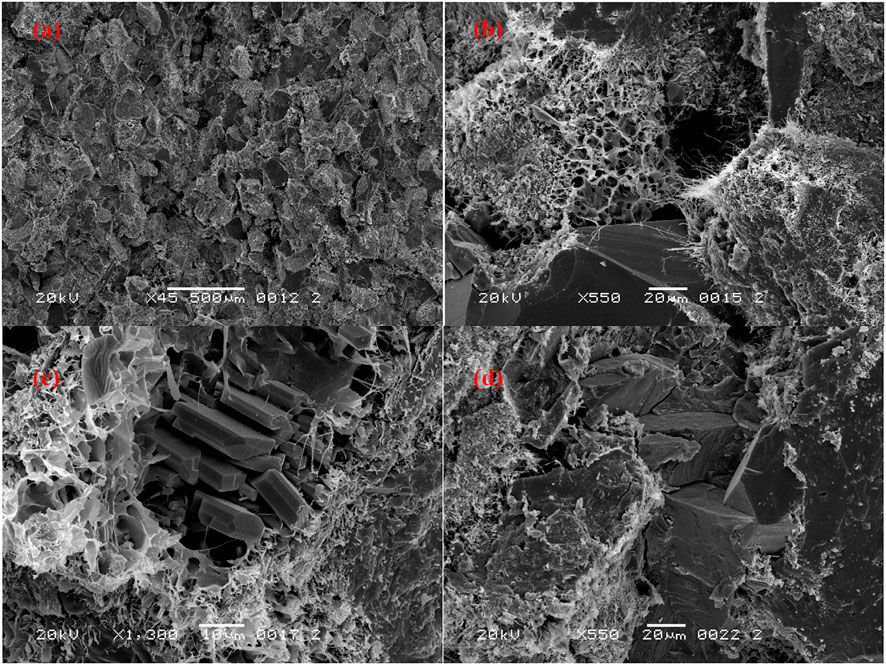
FIGURE 5. SEM image of No. 3 core of Zhoufu 59–51 well.
Figure 6 shows the scanning electron microscope image of the No. 5 siltstone core of Zhoufu 59–51 well. It can be seen that the overall structure of the rock is relatively loose, and the arrangement of clastic particles is slightly directional. Flake-like and hairy illite aggregates are filled in clastic particles and intergranular pores. Intergranular micro-fractures are developed. The clastic particles are in mosaic contact, and inter-granular dissolution pores are found. Feldspar particles are broken and hetero-basic by dissolution, and hairy illite aggregates are mixed with hetero-base. Dissolution micro-pores are developed, and secondary albite crystals are found in dissolution pores.
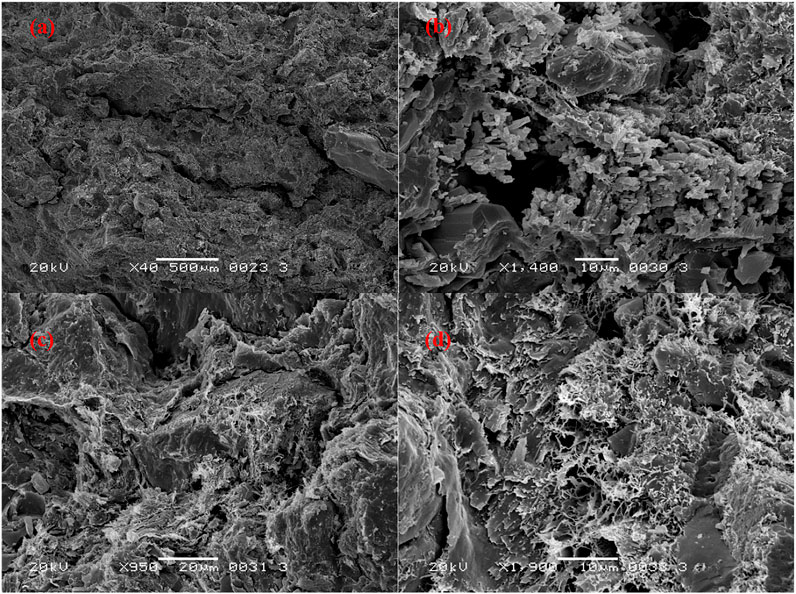
FIGURE 6. SEM image of core 5 of Zhoufu 59–51 well.
Figure 7 is the scanning electron microscope image of No. 9 fine sandstone core of well Zhoufu 59–51. It can be seen that the overall structure of the rock is loose. Secondary quartz crystals and leaf-like chlorite aggregates with a film structure are attached to the surface of clastic particles and filled in clastic particles. Residual intergranular pores and fissures are developed. The lamellar chlorite aggregate and asphaltene are filled in the intergranular pores, and the chlorite aggregate is mixed with quartz crystals.
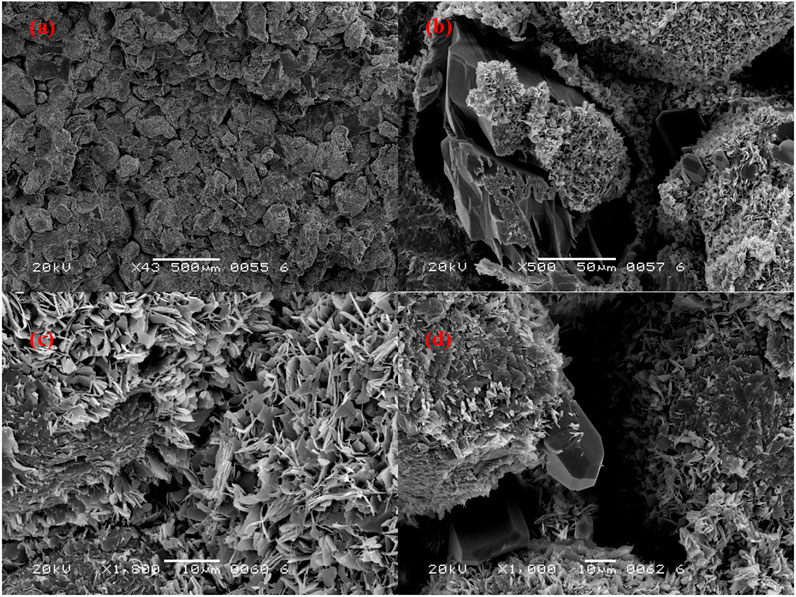
FIGURE 7. SEM image of No. 9 core of Zhoufu 59–51 well.
Figure 8 is a scanning electron microscope image of the core of No. 11 siltstone in Zhoufu 59–51 well. It can be seen that the overall structure of the rock is loose, some flake-like and hairy illite aggregates and leaf-like chlorite aggregates with thin film structures are attached to the surface of debris particles. And secondary quartz crystals, asphaltene, and leaf-like chlorite aggregates are filled in the pores of debris particles and particles, which can be seen developed intergranular pores. Feldspar particles are dissolved and broken along the cleavage with heterogeneity, and micro-dissolved pores are set in the particles.

FIGURE 8. SEM image of core 11 of Zhoufu 59–51 well.
3 Calculation of fractal dimension with HPMI data
According to the fractal theory, porous media have a fractal structure with a power rate relationship between scale ε and the number N(ε):
Where Df is fractal dimension.
3.1 Method I-2D capillary model
Assuming that the pore space is made up of capillary tube with the same length l under different radius r (Purcell, 1949), then:
Where r is the pore radius, μm, N(r) is the total number of pores with pore radius less than r, n(r) is the number of pores at the radius of r, ∆VHg(r) is the volume of mercury intake at the radius of r, cm3, l is the length of the rock sample, cm.
When the pore diameter in the reservoir is greater than r, the total number of pores is N(r), and the logarithm of radius r and pore number N(r) is a linear relationship (Katz and Thompson, 1985):
Then Df1 is the fractal dimension calculated by this method. It represents the fractal dimension of the cross-section of the rock sample and equals the opposite slope of the N(r)-r in the logarithm plot.
3.2 Method II- 3D sphere model
If the pore space is made up of spheres with different radii, then:
Df2, the fractal dimension obtained by this method, reflects the 3D distribution characteristics of rock pore space, and equals the opposite slope of the N(r)-r curve in the logarithm plot.
3.3 Method III-3D capillary model
Assuming that the radius of the rock sample is r, the ratio of the total mercury injection volume VHg(r) under this radius to the total volume of the core under this radius is the 3D capillary model, namely:
where Df3 is the fractal dimension calculated by this method, is opposite to the slope of N(r)-r curve in the double logarithm plot. The fractal dimension calculated with this method can reflect the fractal characteristics of pore space in 3D space.
The saturation of mercury is:
where Vp is the pore volume of the whole core system, cm3, SHg is the saturation of mercury content, %.
Combining Eqs. 3, 5, 6, it can be seen that there is a power-law relationship between mercury saturation and capillary pressure, namely:
where Pc is capillary pressure, MPa. According to the formula, it is easy to see that the slope of SHg-Pc logarithmic curve plus 2 is the fractal dimension obtained by this method.
3.4 Method IV- geometric model
Assume that the pore radius r is a function of Vr derivative concerning r, then:
Combining (7) and (8) to obtain:
From this formula, it can be seen that the slope of the
3.5 Method V- thermodynamic model
When mercury intrudes into pore pace, the surface energy is directly proportional to the amount of mercury intrusion, therefore there is a certain correlation between the number of pores and surface energy of mercury intrusion into rocks (Zhang and Li, 1995):
where Wn is cumulative increase in surface energy during mercury intrusion, KJ,
Combined with Eqs. 10–12, the following equation can be changed into (Zhang et al., 2006):
Df5 is the fractal dimension calculated by this method, which represents the roughness of the pore face, then the slope of the graph
3.6 Method VI- wetting phase model
When the minimum pore radius rmin is far less than rmax, the wetting phase saturation can be expressed with capillary pressure and fractal dimension as (Wang and Cheng, 2020):
where Pmin is the displacement pressure. The fractal dimension calculated with this method can be noted with Df6. As mercury is in the non-wetting phase, and it can be estimated by Sw = 1-SHg. Therefore, the fractal dimension can be derived from the slope of Sw-Pc in double logarithm plot.
3.7 Relationship between permeability and pore structure parameters
The capillary pressure of HPMI of 19 tight sandstone core samples is shown in Figure 9, and the calculated parameters of pore structures are shown in Table 1.
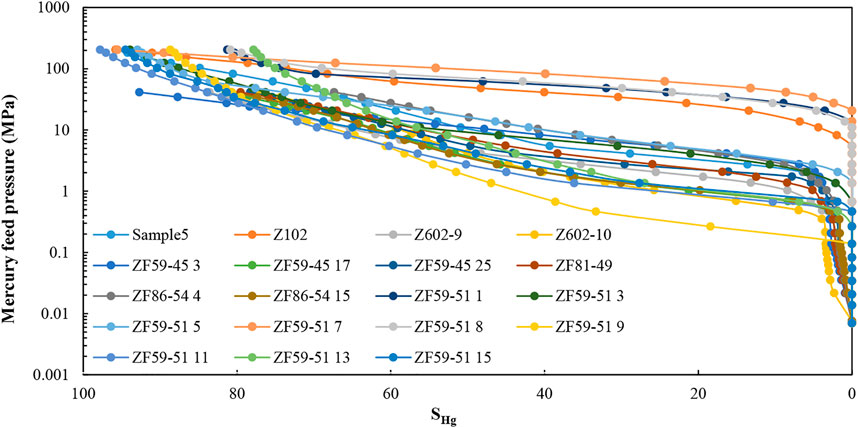
FIGURE 9. Mercury injection curve of corethe.
In this paper, permeability and porosity are derived from core measurements. And obtain values of physical parameters such as median radius, displacement pressure, average throat radius, median pressure, throat sorting coefficient, structure coefficient, and maximum radius from HPMI data. Moreover, the correlation curve between permeability and physical parameters are drawn to select main relevant parameters of permeability. The correlations between the different pore structure parameters and core permeability of 19 cores are shown in Figure 10. From the figure, it can be seen that the permeability is related to each physical parameter as a power. And the index of median pressure and the index of displacement pressure are negative which is caused by an inverse relationship between pressure and the radius of the pore throat. According to the comparison, the throat sorting coefficient has the strongest correlations with permeability, with a correlation coefficient of 0.8566. The median pressure, median radius and average throat radius have slightly poor correlations with permeability, and the corresponding correlation coefficients are 0.8154, 0.8208 and 0.8221 respectively. The porosity has a relatively poorer correlation with core permeability, and the correlation coefficients is 0.6533, respectively. The correlation between structure coefficient and permeability is the worst, and the correlation coefficient is only 0.1937.
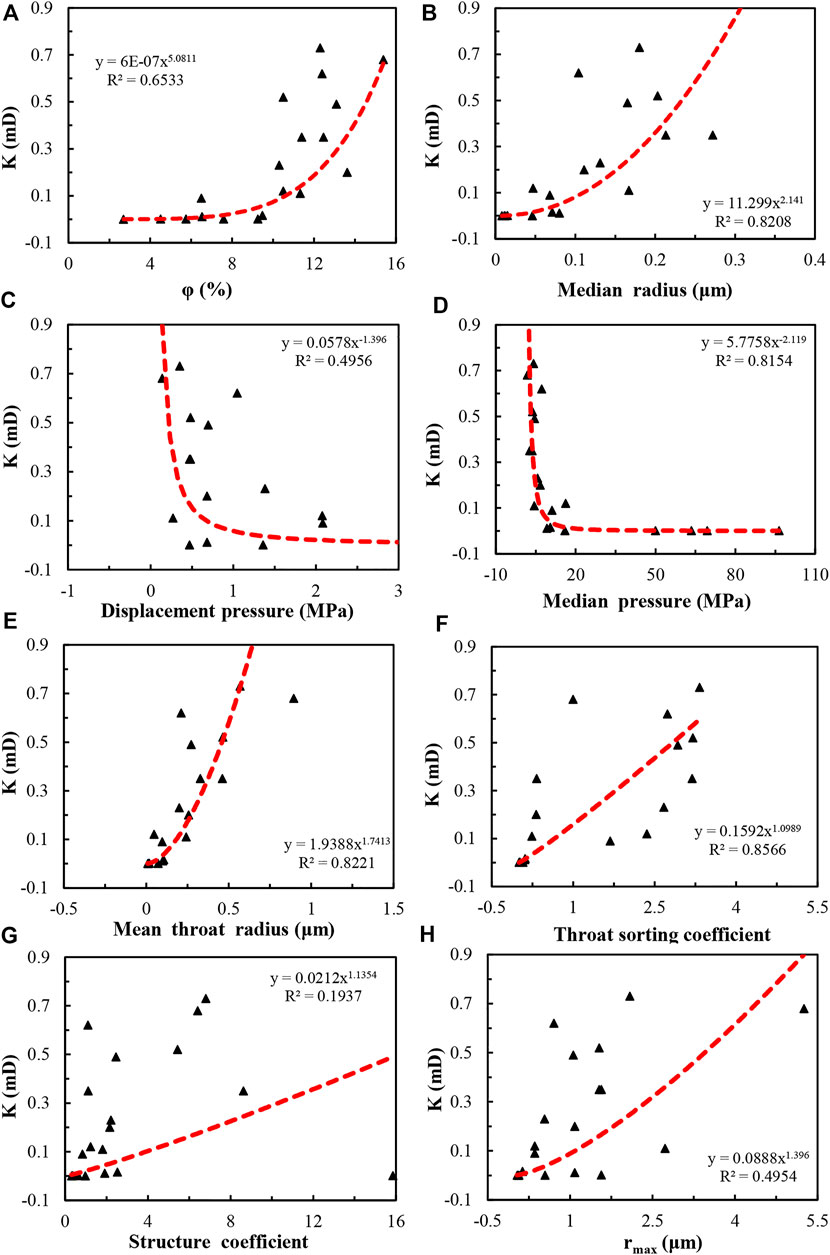
FIGURE 10. Correlations between permeability and pore structure parameters.
4 The correlation between fractal dimension and reservoir properties
According to the above six fractal models, the fractal dimension of each model is calculated, as shown in Table 2. The fractal dimensions calculated by the models I to VI are respectively recorded as Df1, Df2, Df3, Df4, Df5, and Df6. The fractal dimension calculated by method Ⅰ is mainly between 1 and 3. The fractal dimension calculated by method Ⅱ and method Ⅲ is mainly between 2 and 4. The fractal dimensions calculated by method Ⅳ and method Ⅴ are primarily distributed in the range of 2–3. Meanwhile, the difference between the fractal dimensions calculated by method Ⅴ is small, mainly in the range of 2.6–3. However, due to the special conditions of ultra-low permeability and low porosity of the core 7 of Zhoufu 59–51 well, the fractal dimensions calculated by the 2D capillary model and 3D sphere model are not in this range.
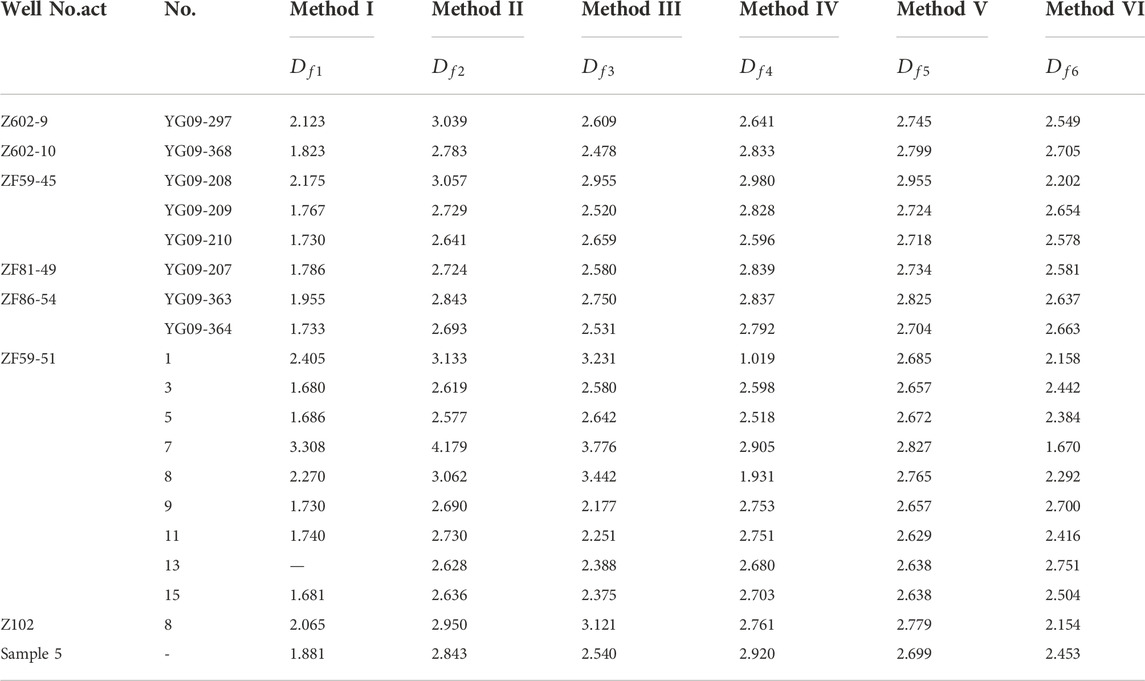
TABLE 2. Fractal dimension values calculated by different models.
Figure 11 shows the relationship between porosity and fractal dimension calculated by six methods, respectively. It can be seen that the fractal dimension calculated by the 3D capillary model and wetted phase model has a strong correlation with porosity, and the wetting phase model has the strongest correlation, with a correlation coefficient of 0.5397. The 3D capillary model is slightly worse than the 2D capillary model. The correlation between porosity and fractal dimension calculated by the 3D spherical model and geometric model was poorer and the correlation coefficient was 0.2727 and 0.1242, respectively. The correlation between the fractal dimension calculated by the thermodynamic model and porosity was the poorest, and the correlation coefficient was only 0.0553.
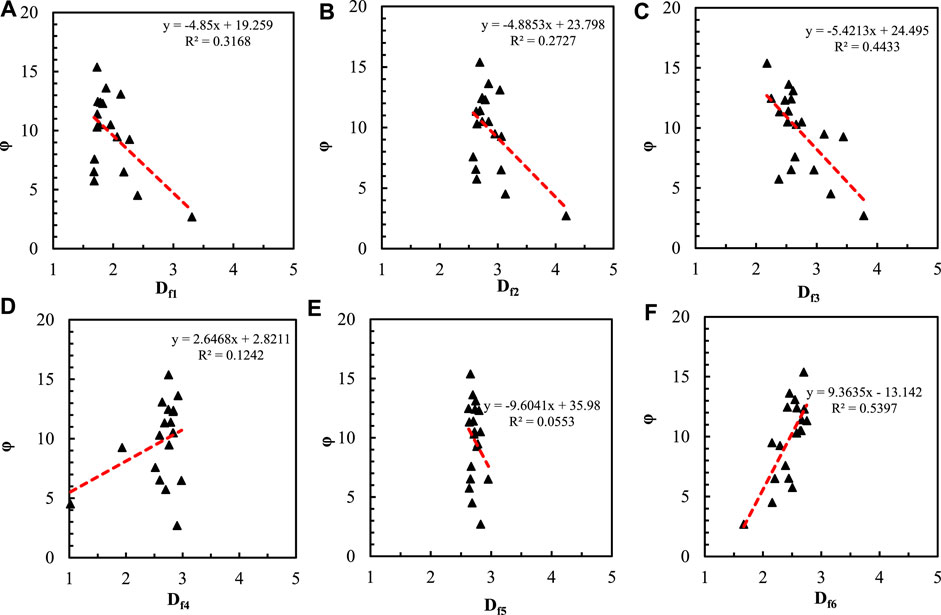
FIGURE 11. Relationship between porosity and fractal dimension calculated by six methods.
Figure 12 shows the relationship between permeability and fractal dimensions calculated by the six methods. Compared with porosity, the correlation between fractal dimensions and core permeability is poorer. The correlation between the wetting phase model and the 3D capillary model is slightly stronger than other methods, and the correlation coefficients are 0.4937 and 0.4524, respectively. According to the analysis, the fractal dimensions from the remaining four fractal models have no obvious correlation with permeability, and the correlation coefficients are all below 0.3. The fractal dimension calculated by the thermodynamic model has the poorest correlation with permeability, and the correlation coefficient is only 0.0002.
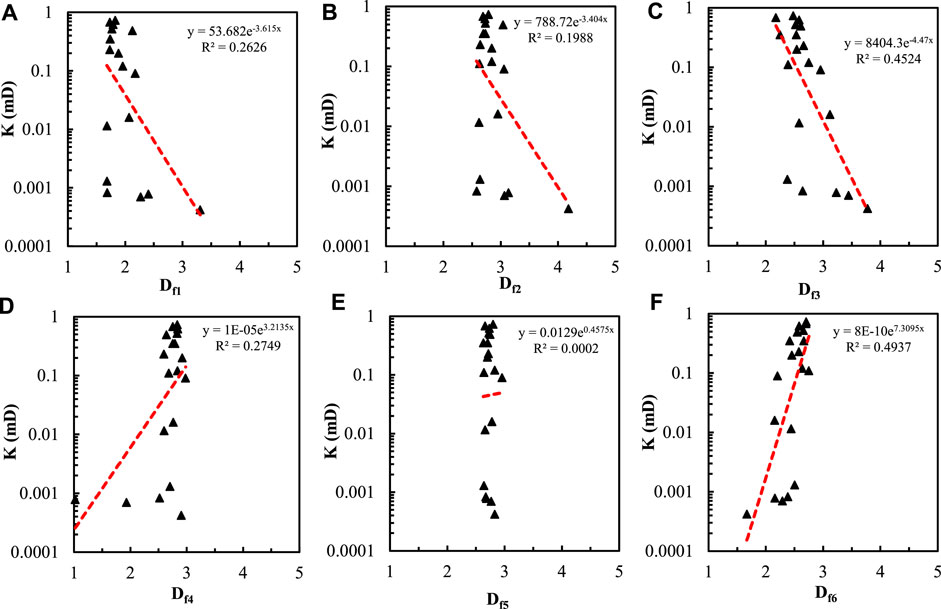
FIGURE 12. Relationship between permeability and fractal dimension calculated by six methods.
Figure 13 shows the relationship between the structure coefficient and fractal dimensions calculated from six models. It can be seen that the fractal dimensions calculated from the 2D capillary tube model, the 3D sphere model, and the wetting phase model have slightly stronger than that of other fractal dimensions. The fractal dimension calculated by the 2D capillary model has the strongest correlation with the structure coefficient, with a correlation coefficient of 0.3991. The correlation coefficients of Df2 and Df6 are 0.3526 and 0.3476 respectively. The correlation between other fractal dimensions and structure coefficient is poor, and the determination coefficient is below 0.3. The fractal dimension calculated by the thermodynamic model has the poorest correlation with the structure coefficient, and the determination coefficient is only 0.0477.
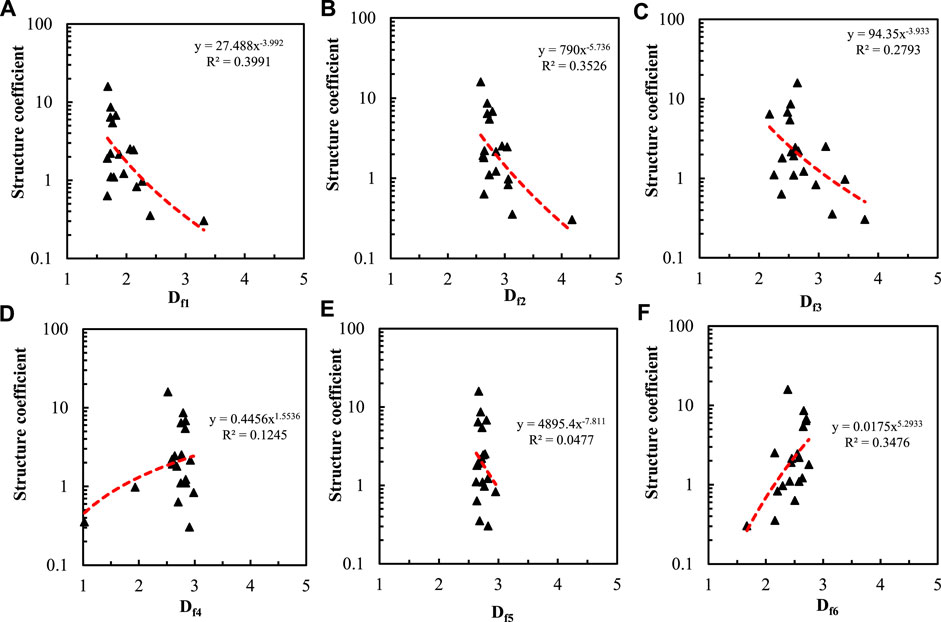
FIGURE 13. Relationship between structure coefficient and fractal dimension calculated by six methods.
Figure 14 shows the relationship between the sorting coefficient of pore throats and fractal dimension calculated by six methods. It can be seen that the fractal dimension Df6 calculated by the wetting phase model has the strongest correlation with the sorting coefficient of pore throats, and the correlation coefficient is 0.4836. The fractal dimensions obtained by the 3D capillary model and geometric model have a slightly poor correlation with the sorting coefficient of pore throats, and the correlation coefficients are 0.3591 and 0.3002 respectively. The correlation between other fractal dimensions and the sorting coefficient of pore throats is poor, and the determination coefficient is lower than 0.3. The fractal dimension calculated by the thermodynamic model has the poorest correlation with the sorting coefficient of pore throats, and the determination coefficient is only 0.0339.
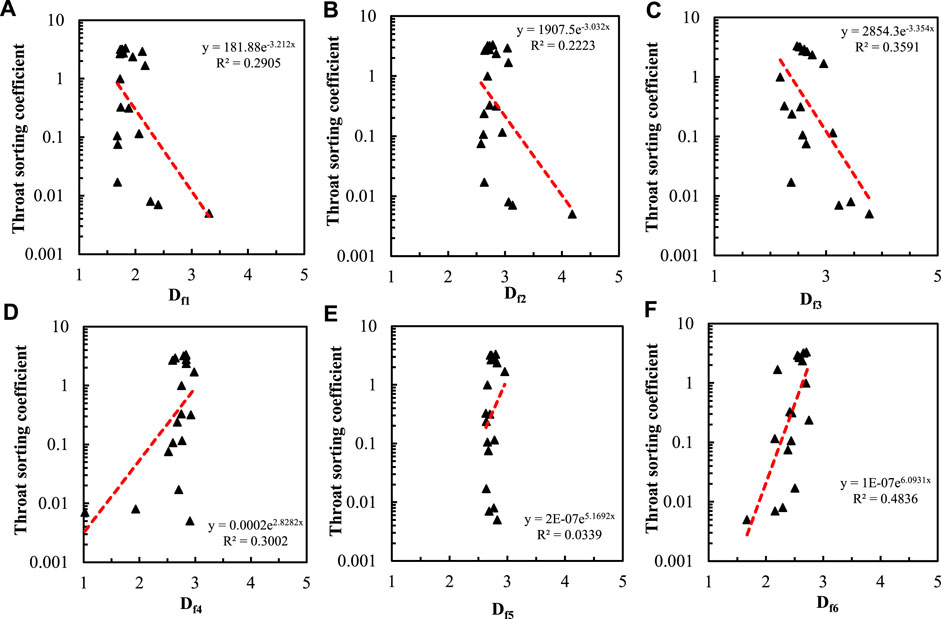
FIGURE 14. Relationship between throat sorting coefficient and fractal dimension calculated by six methods.
Figure 15 shows the relationship between the average pore throat radius and the fractal dimension calculated by six methods. The fractal dimension Df3 derived from the 3D capillary model and the fractal dimension Df6 from the wetting phase model have the strongly correlated with the mean throat radius relationship, and the correlation coefficients are 0.5969 and 0.5154, respectively. Df1 and Df2 have a slightly poor correlation with the average throat radius. The determination coefficients are 0.409 and 0.3282, respectively. The fractal dimension obtained from the remaining fractal method has a poor correlation with the average pore throat radius. The correlation between the fractal dimension Df5 calculated by the thermodynamic model and the average pore throat radius is the poorest, and the determination coefficient is only 0.0406.
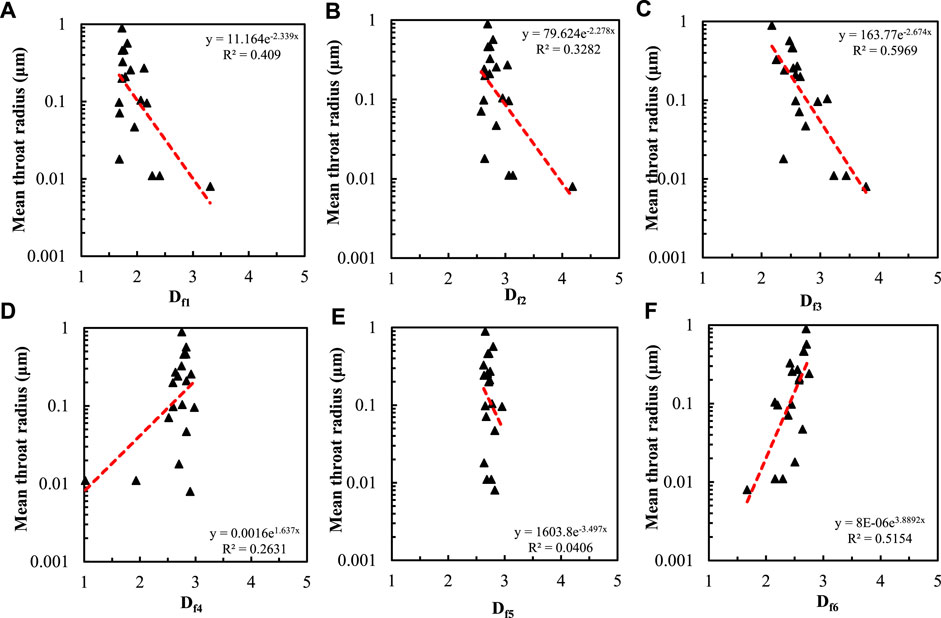
FIGURE 15. Relationship between average throat radius and fractal dimension calculated by six methods.
The relationship between the median capillary pressure and the fractal dimension calculated by the six methods is shown in Figure 16. It can be seen that the fractal dimension Df3 calculated by the 3D capillary model and the fractal dimension Df1 calculated by the 2D capillary model has the strongest correlations with the capillary median pressure. The correlation coefficients are 0.6318 and 0.6205 respectively. The correlation between Df2 and Df6 and the median capillary pressure is slightly poor, and the determination coefficients are 0.5591 and 0.5554, respectively. The correlation between the other two fractal dimensions Df4 and Df5 and the median capillary pressure is poor. The correlation between the fractal dimension calculated by the thermodynamic model and the median capillary pressure is the poorest, and the determination coefficient is only 0.0278.
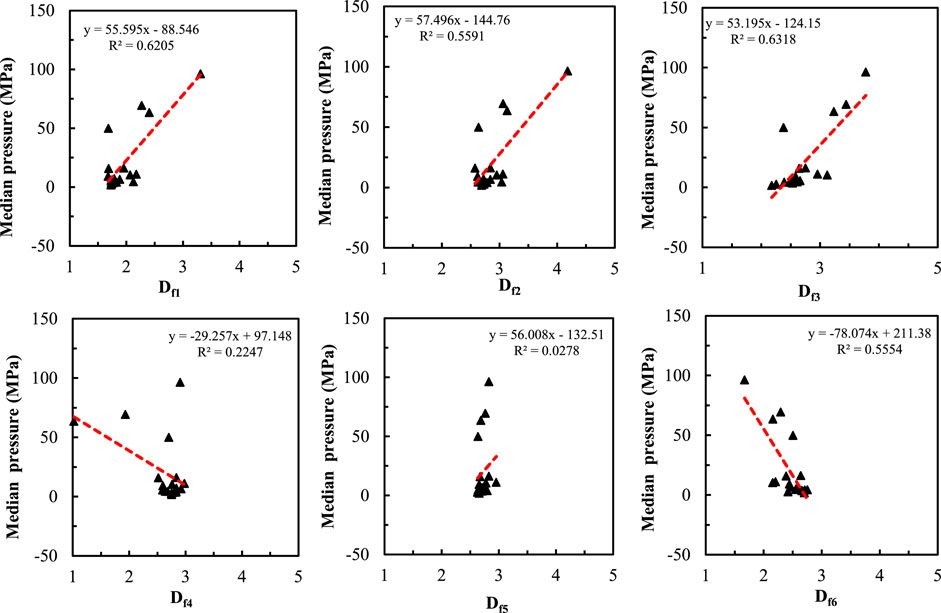
FIGURE 16. Relationship between median pressure and fractal dimension calculated by six.
Figure 17 shows the relationship between the maximum pore throat radius and the fractal dimension calculated by the six methods. It can be seen that the fractal dimension Df3 calculated by the 3D capillary model has the strongest correlation with the maximum pore throat radius, with a correlation coefficient of 0.9317. The fractal dimensions Df6, Df1, and Df2 have a slightly poor correlation with the maximum pore throat radius, with correlation coefficients of 0.6992, 0.6313, and 0.5239 respectively. The remaining two fractal dimensions are poorly correlated with the maximum pore throat radius, with correlation coefficients below 0.3.
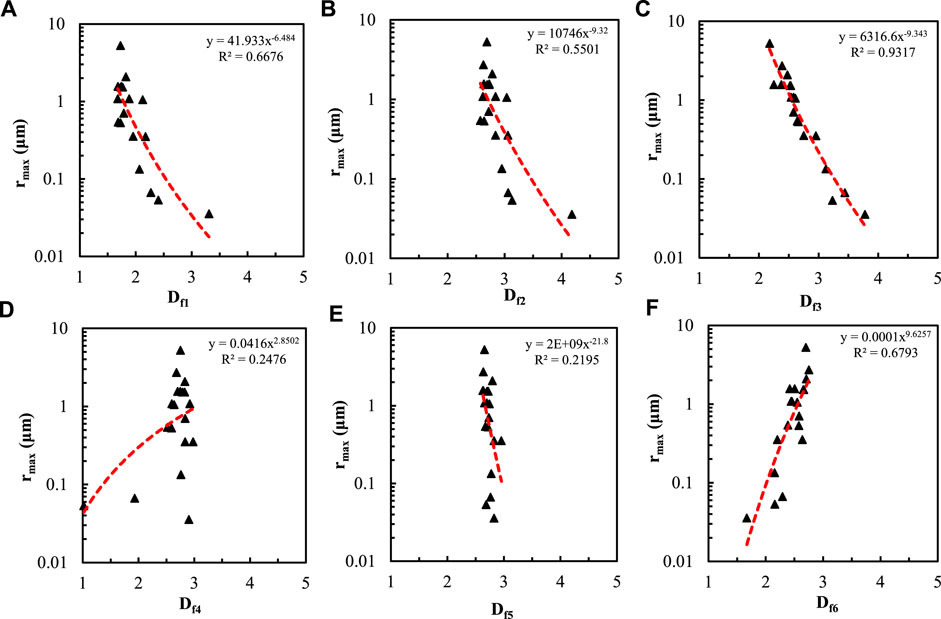
FIGURE 17. Relationship between maximum pore radius and fractal dimension calculated by six methods.
To sum up, the fractal dimension calculated by the wetting phase model and the 3D capillary model can well characterize the reservoir properties. However, the fractal dimension of the wetting phase model essentially should be calculated by using the saturation of the wetting phase and its corresponding intrusion pressure data. Utilizing the equation Sw = 1-SHg to calculate the saturation of the wetting phase leads to results that contradict the fractal theory. This is because the method makes an inverse relationship between the wetting and non-wetting phases. According to Figure 12, median pressure and fractal dimension show a positive correlation. From
5 Conclusion
The pore fillings and composition of rock samples are analyzed through the CTS image and SEM image of tight sandstone rock samples obtained from Fuyu oil layers of Sanzhao Sag, Songliao Basin, NE China. And the connectivity of the rock samples is qualitatively characterized. Based on the data of HPMI, 6 kinds of fractal models are utilized for quantitative analysis of the samples’ heterogeneity. And the best model was filtered by comparing. Combining the fractal models with the CTS image and SEM image, the reservoir properties of Daqing Oilfield are Qualitative and quantitative evaluated.
CTS and SEM images show that the lithology of the tight oil reservoir in the Fuyu oil layers of Sanzhao Sag, Songliao Basin are all sandstones, and the pore types are mainly inter-granular and intra-granular pores, with uneven distribution of pores and poor connectivity. The tight sandstone is mainly pore cemented and filled with muddy miscellaneous bases, calcite, and other cemented materials. Illite or chlorite is commonly found attached to the grain surface and filled between the grains.
HPMI tests show that the tight sandstone permeability is strongly correlated with the throat sorting coefficient. The fractal dimensions obtained from the 3D capillary model and wetting phase model have a strong correlation with the reservoir physical properties, but the trend between the fractal dimension and reservoir proprieties are opposite to each other. The fractal dimension obtained from the 3D capillary model is more suitable for analyzing the reservoir properties, and there is a negative correlation between the fractal dimension and reservoir physical parameters. That is, the larger the fractal dimension, the worse the reservoir physical properties. The fractal dimension calculated by the thermodynamic model has no obvious correlation with reservoir properties, and it is not possible to quantitatively analyze the reservoir properties by the thermodynamic model method.
Data availability statement
The raw data supporting the conclusions of this article will be made available by the authors, without undue reservation.
Author contributions
CM and HH did the experiments and correlation model under the help of XW.
Funding
This work is funded by the Beijing Municipal Natural Science Foundation (No. 2214077) and National Natural Science Foundation (No. 52204060).
Conflict of interest
Author CM was employed by Exploration Utility Department of CNPC Daqing Oilfield Co., Ltd.
The remaining authors declare that the research was conducted in the absence of any commercial or financial relationships that could be construed as a potential conflict of interest.
Publisher’s note
All claims expressed in this article are solely those of the authors and do not necessarily represent those of their affiliated organizations, or those of the publisher, the editors and the reviewers. Any product that may be evaluated in this article, or claim that may be made by its manufacturer, is not guaranteed or endorsed by the publisher.
References
Arzilli, F., Cilona, A., Mancini, L., and Tondi, E. (2016). Using synchrotron X-ray microtomography to characterize the pore network of reservoir rocks: A case study on carbonates. Adv. Water Resour. 95, 254–263. doi:10.1016/j.advwatres.2015.07.016
Chen, P. L., Wang, S., Wang, D., Jia, X., and Qian, H. (2013). Comparing the constant-speed mercury injection technique with the conventional mercury injection technique. Xinjiang Geol. 31, 139–141.
Gutierrez, C. G., and Jose, F. S. (2006). Geophysical research abstracts. Munich, Germany: European Geosciences Union, 11094.
He, S., Jiao, C., Wang, J., Luo, F., and Zou, L. (2011). Discussion on the differences between constant-speed mercury injection and conventional mercury injection techniques. Duankuai Youqitian(Fault-Block Oil Gas Field) 18, 235–237.
Jia, C., Zou, C., Li, J., and Li, D. (2012). Assessment criteria, main types, basic features and resource prospects of the tight oil in China. Acta Pet. Sin. 33, 343. doi:10.1016/s2096-2495(17)30026-1
Jouini, M. S., Vega, S., and Mokhtar, E. A. (2011). Multiscale characterization of pore spaces using multifractals analysis of scanning electronic microscopy images of carbonates. Nonlinear process. geophys. 18, 941–953. doi:10.5194/npg-18-941-2011
Katz, A. J., and Thompson, A. H. (1985). Fractal sandstone pores: Implications for conductivity and pore formation. Phys. Rev. Lett. 54, 1325–1328. doi:10.1103/physrevlett.54.1325
Knackstedt, M. A., Sok, R., Adrian, S., and Arns, C. H.. 3D Pore Scale Characterisation of Carbonate Core: Relating pore types and interconnectivity to petrophysical and multiphase flow properties International Petroleum Technology Conference, 2007. doi:10.2523/iptc-11775-ms
Li, W. C., Zhang, Y. M., Wang, F., Zhu, J., and Ye, B. (2012). Application of constant-rate mercury penetration technique to study of pore throat characteristics of tight reservoir: A case study from the upper triassic yanchang formation in Ordos basin. Lithol. Reserv. 24, 60–65.
Mandelbrot, B. B., and Mandelbrot, B. B. (1982). The fractal geometry of nature. New York: W. H. Freeman.
Martínez, F. S. J., Martín, M. A., Caniego, F. J., Tuller, M., Guber, A., Pachepsky, Y., et al. (2010). Multifractal analysis of discretized X-ray CT images for the characterization of soil macropore structures. Geoderma 156, 32–42. doi:10.1016/j.geoderma.2010.01.004
Purcell, W. R. (1949). Capillary pressures-their measurement using mercury and the calculation of permeability therefrom. J. Petroleum Technol. 1, 39–48. doi:10.2118/949039-g
Sheng, J. J. (2015). Increase liquid oil production by huff-n-puff of produced gas in shale gas condensate reservoirs. J. Unconv. Oil Gas Resour. 11, 19–26. doi:10.1016/j.juogr.2015.04.004
Shi, Y., Yassin, M. R., and Dehghanpour, H. (2018). A modified model for spontaneous imbibition of wetting phase into fractal porous media. Colloids Surfaces A Physicochem. Eng. Aspects 543, 64–75. doi:10.1016/j.colsurfa.2017.12.052
Wang, F., and Cheng, H. (2020). Characterization of pore structure and petrophysical properties of tight sandstone of yanchang formation, Ordos basin. J. Jilin Univ. (Earth Sci. Ed. 50, 721–731.
Wang, F., Lian, P., Jiao, L., Liu, Z., Zhao, J., and Gao, J. (2018). Fractal analysis of microscale and nanoscale pore structures in carbonates using high-pressure mercury intrusion. Geofluids 2018, 1–15. doi:10.1155/2018/4023150
Wang, F., Yang, K., and Cai, J. (2018). Fractal characterization of tight oil reservoir pore structure using nuclear magnetic resonance and mercury intrusion porosimetry. Fractals 26, 1840017. doi:10.1142/s0218348x18400170
Wang, F., Yang, K., You, J., and Lei, X. (2019). Analysis of pore size distribution and fractal dimension in tight sandstone with mercury intrusion porosimetry. Results Phys. 13, 102283. doi:10.1016/j.rinp.2019.102283
Wang, F., Zeng, F., Wang, L., Hou, X., Cheng, H., and Gao, J. (2021). Fractal analysis of tight sandstone petrophysical properties in unconventional oil reservoirs with NMR and rate-controlled porosimetry. Energy fuels. 35, 3753–3765. doi:10.1021/acs.energyfuels.0c03394
Xu, J., Chen, Z., Wu, K., Li, R., Liu, X., and Zhan, J. (2019). On the flow regime model for fast estimation of tight sandstone gas apparent permeability in high-pressure reservoirs. Energy Sources Part A Recovery Util. Environ. Eff. 2019, 1–12. doi:10.1080/15567036.2019.1687625
Zhang, B., and Li, S. (1995). Determination of the surface fractal dimension for porous media by mercury porosimetry. Ind. Eng. Chem. Res. 34, 1383–1386. doi:10.1021/ie00043a044
Zhang, B., Liu, W., and Liu, X. (2006). Scale-dependent nature of the surface fractal dimension for bi-and multi-disperse porous solids by mercury porosimetry. Appl. Surf. Sci. 253, 1349–1355. doi:10.1016/j.apsusc.2006.02.009
Keywords: tight sandstone, pore structure, fractal porous media, permeabiilty, high-pressure mercury intrusion
Citation: Mu C, Hua H and Wang X (2023) Characterization of pore structure and reservoir properties of tight sandstone with CTS, SEM, and HPMI: A case study of the tight oil reservoir in fuyu oil layers of Sanzhao Sag, Songliao basin, NE China. Front. Energy Res. 10:1053919. doi: 10.3389/fenrg.2022.1053919
Received: 26 September 2022; Accepted: 07 November 2022;
Published: 17 January 2023.
Edited by:
Jiafei Zhao, Dalian University of Technology, ChinaCopyright © 2023 Mu, Hua and Wang. This is an open-access article distributed under the terms of the Creative Commons Attribution License (CC BY). The use, distribution or reproduction in other forums is permitted, provided the original author(s) and the copyright owner(s) are credited and that the original publication in this journal is cited, in accordance with accepted academic practice. No use, distribution or reproduction is permitted which does not comply with these terms.
*Correspondence: Xiukun Wang, eGl1a3Vud2FuZ0BjdXAuZWR1LmNu