 Guangxian Lv1
 Yonghui Nie
- 1State Grid Shanghai Energy Interconnection Research Institute, Shanghai, China
- 2School of Electrical Engineering, Northeast Electric Power University, Jilin, China
With the continuous development of building microgrids, it is crucial to explore and study the energy-saving potential of buildings to resolve energy shortages and environmental protection problems. Therefore, to realize the efficient and economical operation of a building microgrid, a new multi-objective optimization method is proposed for the planning and operation of building microgrid considering virtual energy storage. First, virtual energy storage model of the building microgrid is established based on the heat storage characteristics of the building itself. Second, a multi-objective optimization model of the building microgrid considering virtual energy storage is constructed by considering the investment cost and the comprehensive operation benefits as the objectives as well as the constraints of cooling, heating, power balance. Finally, based on the original gray wolf swarm algorithm, the niche processing mechanism and gray weighted correlation method are introduced to optimize the configuration and operation of the building microgrid. For a typical building microgrid in summer and winter, the simulation results reveal that the proposed method improves the overall economy of planning the building microgrid system and its operation and user experience via virtual energy charge and discharge management.
1 Introduction
Promoting the development of clean energy systems based on distributed energy is a major strategic choice worldwide. At present, research has shown that the proportion of energy consumption in the end-use energy systems of buildings is increasing annually, which has significant potential for energy conservation and emission reduction. Therefore, energy-saving solutions for mining buildings have become crucial approaches to solve the shortage of energy demand and achieve the double carbon goal (Dounis et al., 2009; Zhao et al., 2015).
A building microgrid system is a multi-energy joint energy supply system formed by integrating natural gas, heating, energy storage, and distributed energy systems along with related technologies into the building energy supply system. To ensure the safe and reliable operation of the system, it is effective to use the diversity of energy supply modes to satisfy the diversified needs of users and use the energy storage system and related control technologies to reduce the impact of fluctuations in the output of clean energy (Guan et al., 2010; Hca et al., 2021). Owing to the integration of supply side energy supply, renewable energy, and demand side cold/heat/electricity load demand, and other elements in the system, new requirements are proposed as follows: 1) ensure the consumption of renewable energy. 2) realize the complementary advantages of various forms of energy on the supply side and cooperative configuration operation to reduce the operation cost of the microgrid. 3) and ensure the energy optimization management for safe and economic operation of the building microgrid system (Wang et al., 2021; Chang et al., 2022).
At present, there has been research progress on the optimal configuration strategy of microgrid energy systems. Liu et al. (2019) proposed a comprehensive energy planning strategy based on the improved kriging model, which rapidly and accurately obtained the optimal capacity allocation scheme of the system. Bahmani et al. (2021) established a cooperative method in which a network of energy hubs collaborates to share adjustable energy. Each hub comprises a combined heat and power unit, electrical chiller, renewable sources, absorption chiller, and boiler. Mixed integer linear programming was used to determine the optimal comprehensive economic cost of the system. Li et al. (2020) considered the uncertainty of wind power and proposed a comprehensive energy system planning strategy based on a scenario method, aiming at investment and wind curtailment costs. Qiu et al. (2015) developed a microgrid energy system planning model to minimize the total investment cost based on the electrical-pneumatic coupling phenomenon. To obtain both the optimal structural configuration and energy management dispatch for multi-energy systems, a generic optimal planning framework was proposed in (Ma et al., 2018) and mixed-integer linear programming was employed to minimize the overall cost. Han et al. (2018) considered the volatility of distributed energy resources, net income of the entire operation cycle, penetration of renewable energy, and reliability of the power supply, and established a three-objective two-stage planning model. Lin et al. (2021) considered the economy and reliability of an integrated energy system and proposed a planning model based on an improved collaborative algorithm to coordinate the complex relationship between the two performance indexes, and they verified the effectiveness of the model using a practical example. Based on the above literature, it is evident that for integrated energy system research, the minimum operating cost of the system is usually selected as the optimization objective, and there are several deterministic constraints, such as power balance and equipment output. However, load changes caused by environmental costs and temperature constraints is given less priority.
Simultaneously, by exploiting the complementary characteristics of various power sources in the building microgrid energy system, peak shaving and valley filling can be realized and the energy utilization rate can be improved through the charge and discharge regulation of the energy storage system. However, the initial investment in configuring energy storage equipment is high, and virtual energy storage technology provides a potential solution to the problem. Wang et al. (2020) conducted a detailed study on the virtual energy storage technology of an air conditioning load, established a virtual energy storage energy model, and verified the feasibility of using the virtual energy storage of an air conditioning load for power grid regulation. Zhu et al. (2019) considered virtual energy storage on the user side and established a comprehensive energy system scheduling model including the temperature control load and electric vehicle with consideration of the uncertainty of weather. The simulation results reveal that virtual energy storage has a positive significance in reducing the capacity of energy storage equipment. Jin et al. (2017) considered the characteristics of virtual energy storage and battery-coordinated operation and proposed a control strategy for stabilizing the power fluctuation of a microgrid tie line. Currently, research on the joint optimization of the energy storage optimization link and other energy supply equipment in building microgrid energy systems needs more in-depth analysis.
In summary, this paper proposes a method for capacity configuration and operation optimization of building microgrid systems considering virtual energy storage through the optimal adjustment of temperature. The main contributions of this study are the following.
1) Based on the thermal storage characteristics of buildings, a virtual energy storage system model of the building microgrid is constructed. The charge and discharge management of virtual energy storage is realized to achieve low-carbon operation of building microgrid systems.
2) The proposed strategy considers the principle of virtual energy storage to construct a multi-objective optimization model to improve the operation economy of the building microgrid.
3) The comprehensive benefits and user satisfaction are introduced as the objectives. Under meeting customer satisfaction index, the proposed strategy increases comprehensive benefits through virtual energy storage charging and discharging management.
4) The gray wolf algorithm based on niche technology was employed to solve the optimization problem. Based on the non-dominated solution set, the optimal solution of the system configuration and operation was obtained using the gray-weighted correlation degree evaluation index.
5) Structure and mathematical model of building microgrid system
2 Structure of building microgrid system
With the continuous development of distributed energy technology, various energy equipment, such as refrigeration units, gas turbines, heat storage tanks, energy storage equipment, and PV equipment, are connected to buildings. This energy equipment can realize complementary and cooperative effects among energy sources to satisfy the diversified needs of users and improve the overall operational efficiency of the system (Favre-Perrod, 2005; Pazouki et al., 2014).
In this study, a variety of energy devices were applied to a building microgrid system, the structure of which is illustrated in Figure 1. Absorption chillers and electric chillers satisfy the cooling demand of buildings, and the cooling power of absorption chillers originates from gas turbines. The thermal power demand originates from the gas turbine, thermal storage system, and virtual energy storage system in the building. The virtual thermal energy storage is the indoor energy change caused by the temperature change. The electric load power originates from photovoltaics, energy storage equipment, and the external power grid. From the above process, it is evident that the building microgrid system formed by the cold thermal–electrical structure and the external power grid are interconnected.
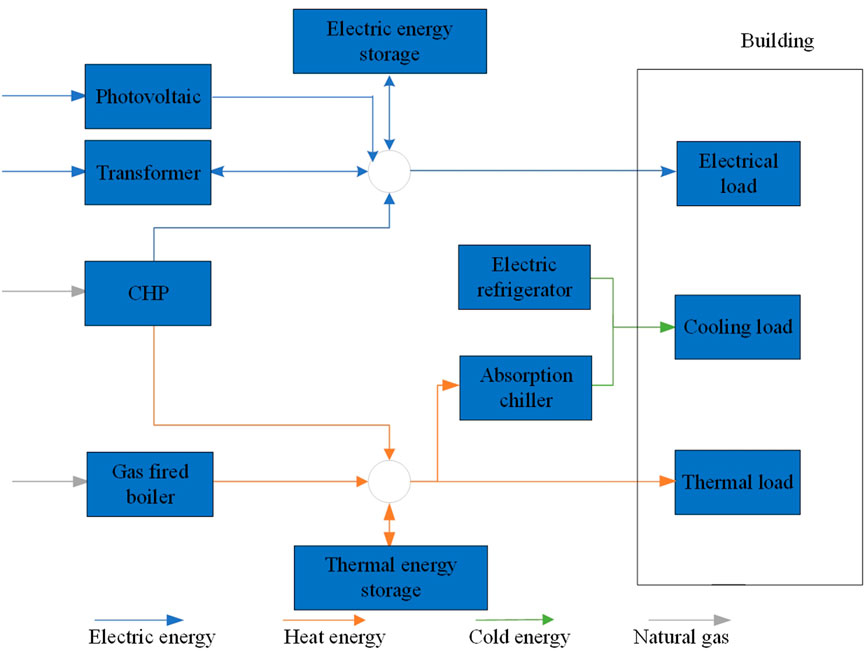
FIGURE 1. Schematic of the building microgrid system.
3 System modeling
3.1 Photovoltaic device
Photovoltaic equipment can convert solar radiation energy into electrical energy via photovoltaics, and the conversion efficiency primarily depends on the illumination and ambient temperature, which can be expressed as follows (Ma et al., 2016):
where η represents the energy conversion efficiency (%), Ypv indicates the capacity of the photovoltaic panel (kW), IT(t) represents the solar radiation intensity (kW/m2) received by the photovoltaic panel at time t, and Is = 1 kW/m2.
3.2 Electric refrigerator
The refrigerator was cooled by consuming electric energy, and its cooling power was as follows:
where
3.3 Micro gas turbine
The active power output of the micro gas turbine is as follows:
where ηmt indicates the power generation efficiency of the micro gas turbine, Pmt,t denotes the active output (kW), and Pgas represents the natural gas power consumed (kW).
3.4 Absorption chiller
The small gas turbine drives the absorption chiller through the residual energy in the industrial production process, and its cooling power is as follows:
where HAC,t indicates the heat consumption power (kW),
3.5 Energy storage device
We adopted the conventional battery model, and the change relationship of the state of charge is as follows:
where SOCbt(t) represents the state of charge of the battery, Pch and Pdis denote the charging and discharging powers of the battery (kW), respectively, ηch and ηdis denote the charging and discharging efficiencies, respectively, and Ssh(t) and Sdis(t) represent the charge and discharge states of the battery, respectively.
3.6 Heat storage device
The heat-storage model is similar to the energy-storage battery model, and the relationship between the state of charge and heat power is as follows (Lu et al., 2015):
where SOCH(t) indicates the state of charge, Pch,H and Pdis,H denote the heat charging and discharging power (kW), respectively, and ηch,H and ηdis,H refer to the heat charging and discharging efficiencies, respectively,
3.7 Building virtual energy storage system
A building can be regarded as a heat storage body because of its thermal inertia and heat storage characteristics of indoor air. Thus, when the indoor temperature changes within a certain range are compared with the constant set temperature, the heating or cooling capacity of the building also changes correspondingly relative to the cooling and heating capacity at a constant set temperature. This change can be regarded as the characteristics of the virtual energy storage of the building, and the difference in the value of this heat change can be regarded as the storage and discharge power of the virtual energy storage (the heat change caused by the difference between the set value and the actual value of the temperature).
The relationship between heat inside and outside the building and temperature is:
Eq. 7 represents the two operating conditions of heating in winter and cooling in summer: where QH indicates the heating power in winter (kW), Qd denotes the heat dissipation power of the building (kW),
Taking summer cooling as an example, the key factors affecting the heat change in the building include three parts: the indoor heat change caused by solar radiation, difference between the heating power, and the cooling equipment power in the building, as shown below:
where ΔQ indicates the indoor heat change value of the building (kW), Kwa and Kwi denote the heat transfer coefficients of the outer wall and the outer window (W/(m2 K)), respectively, Swa and Swi denote the area of outer wall and outer window (m2), respectively, I indicates the solar radiation intensity (kW/m2), SC denotes the shading coefficient, Qin denotes the heating power in the building (kW), and Qcl indicates the cooling power (kW).
4 Operation model of building optimal configuration
4.1 Objective function
In the capacity allocation process, with the goal of minimizing the comprehensive benefit of building equipment and equipment investment costs, a multi-objective optimization function is constructed as follows:
where F1 indicates the comprehensive income of the building micro network (1/yuan), C1 represents the operation and maintenance cost of the equipment in the building (yuan), C2 represents the comprehensive income and user satisfaction of the building (yuan), C3 represents the environmental and fuel costs of the building microgrid system (yuan), and F2 refers to the investment cost of each piece of equipment of the building microgrid system (yuan), expressed by C4.
4.2 Objective function F1
4.2.1 Operation and maintenance cost
where Cpv, Cbt, Cec, Cgas, CH, and Cac denote the unit time operation and maintenance costs (yuan/kWh) of photovoltaic devices, batteries, electric refrigerators, micro gas turbines, heat storage tanks, and absorption chillers, respectively, Pex,t indicates the electric power exchanged between the building microgrid and the external power grid (kW); Cph,t denotes the unit power purchase cost at t (yuan/kWh), which adopts the time-of-use price to guide the user’s power consumption behavior, Ppv,t, Pbt,t, Pec,t, Pmt,t, PH,t, and Pac,t refer to the outputs (kW) of photovoltaic device, storage battery, electric refrigerator, micro gas turbine, heat storage tank, and absorption refrigerator, respectively, at time t; N = 24, Δt = 1.
4.2.2 Comprehensive income and user satisfaction
where the first item indicates the photovoltaic consumption income, and Cpvsu denotes the photovoltaic subsidy price (yuan/kWh). The second item corresponds to the peak-shaving income from energy storage, and Cbtsu refers to the peak-shaving auxiliary service price, Pbt,t indicates the battery power participating in the peak-shaving period t (kW). The energy storage device was charged at the low-load valley and discharged at a high load peak. Through the low storage and high discharge mechanism, it can fill the valley and cut the peak, and increase the peak regulation income of the system. The third item is user satisfaction; λ denotes the energy penalty factor, Tin,t indicates the actual temperature in the building, and Tset represents the set temperature (˚C).
4.2.3 Environmental cost and fuel cost
where the first term indicates the environmental cost, and Ksp, Knp, and Kcp denote the emission intensities of SO2, NOx, and CO2, respectively, produced by the gas turbine, which are 0.01026, 0.01702, and 0.000928 kg/kWh, respectively (Zhang et al., 2017; EPA et al., 2021). Pmt,t indicates the output (kW) of the gas turbine at time t, and Cs, Cn, and Cc represent the unit treatment costs of SO2, NOx, and CO2 produced by the gas turbine, which are 0.21, 0.13, and 14.824 yuan/kg, respectively (Zhang et al., 2017; EPA et al., 2021). The second item indicates the fuel cost; Cmt denotes the fuel cost per hour of the unit gas turbine, which is 0.3894 yuan/kWh.
4.2.4 Objective function F2
where Smt, Sbt, Sec, Spv, Sac, and SH denote the installation capacities (kW) of the micro gas turbine, battery, electric refrigerator, photovoltaic device, absorption refrigerator, and heat storage tank, respectively, and cmt, cbt, cec, cpv, cac, and cH denote the unit capacity installation costs (yuan/kW) of the micro gas turbine, battery, electric refrigerator, photovoltaic device, absorption chiller, and heat storage tank, respectively.
4.3 Constraints
4.3.1 Electric power balance constraint
where Pel,t indicates the electric power load (kW) at time t and Pex,t represents the power (kW) of the connecting line; that is, the electric power exchanged between the building microgrid and the external power grid.
4.3.2 Cooling power constraint
where Qcool,t is the cooling power load (kW) at time t.
4.3.4 Thermal power balance constraint
where Qheat,t denotes the thermal power load (kW) at time t, Qout,t represents the thermal power output (kW) of the thermal storage device at time t, and ηeh denotes the electric heating ratio of the micro-gas turbine.
4.3.5 Equipment configuration and operating output upper and lower limit constraints
where Smin * and Smax * represent the lower and upper capacity limits of each device (kW), respectively, and Pmin * and Pmax * denote the lower and upper output limits of each device (kW), respectively.
4.3.6 Constraints related to energy storage system
Charging and discharging power constraint:
Charging and discharging state transition constraint:
Power storage constraints:
Configure capacity constraints:
where Pch max and Pdis max denote the maximum power (kW) of the charge and discharge, respectively;
4.3.7 Indoor temperature expectation interval constraint
where Tmax and Tmin denote the expected upper and lower limits of the indoor temperature (˚C), respectively.
5 Multi-objective solution strategy
We optimize the configuration of various types of equipment in a building based on virtual energy storage. The optimal mathematical model is established with the state of charge of the battery, output of the refrigerator, input and output power of the heat storage system, and indoor temperature of the building as the decision variables. The constraints include the power balance of the cooling, heating, and power loads; the upper and lower limits of the equipment; and the constraints of the equations and inequalities related to the energy storage system. It is difficult to solve complex problems with many variables and constraints using traditional algorithm strategies; therefore, this study introduces an improved multiparticle swarm wolf optimization (MPSWO) to optimize the solution. Based on the original swarm wolf algorithm, the niche processing mechanism and gray weighted correlation index are introduced, and the population diversity and self-regulation ability are introduced into the PSWO algorithm (Mirjalili et al., 2014).
5.1 Niche technology
Niche technology forms a niche for each wolf based on the distance between wolves. Using the update iteration principle of particle swarm optimization algorithm, the wolves in the wolf group are also regarded as a group of particles. Subsequently, the PSO algorithm is employed to update each group of particles once in speed and position. For the updated particle swarm returning to the wolf swarm, a sharing mechanism is employed to improve the hunting ability of the wolves and provide the best location according to the distance between the wolves. The crowding distance of the gray wolf is improved based on the notion of particle swarm optimization and can be expressed as
where xi and xj represent any 2 Gy wolves. For a given parameter, the fitness can be expressed as
where fi represents the original fitness and S (dij) represents the sharing function. When the distance between the gray wolves is less than the radius R of the small mirror, the sharing function can be calculated as follows:
where λ symbolizes the shape parameter.
5.2 Non-dominated sorting selection strategy based on gray weighted correlation degree
The gray correlation degree analysis method is based on the similarity between the obtained non-dominated solution set curve and optimal dominated curve. The closer the curve, the higher the degree of correlation between the corresponding sequences and the higher the ranking priority. The gray weighted correlation degree was obtained by combining the analytic hierarchy process to select the optimal solution. The steps are as follows (Si et al., 2019).
5.2.1 Preprocessing of objective function matrix
The objective function data matrix is calculated. Because the dimensions of each objective of the proposed optimization strategy are inconsistent, it is necessary to conduct dimensionless processing; thus, the following matrix can be obtained:
where
5.2.2 Calculating the gray relational degree
First, the intermediate difference matrix is obtained to obtain the minimum difference a and maximum difference b. Then, according to the correlation coefficient formula, the correlation coefficient matrix is calculated as follows:
where μ is the resolution coefficient, usually taken as 0.5.
1) Determining the corresponding weight of each optimization objective
The corresponding weight
where rij indicates the relative importance of optimization objectives i and j.
5.2.3 Determining the gray weighted correlation degree
The gray weighted correlation degree of the ith optimal solution of the Pareto solution set is calculated using Eq. 30
According to the size of the gray weighted correlation degree, the solution set is sorted, and a compromise solution is selected. The higher the degree of correlation, the higher is the ranking priority.
5.3 Solution procedure
Initialization algorithm parameters: The population size of the gray wolf was N = 50, and the maximum iteration number was iterax = 100. The initial populations that meet the upper and lower limit constraints of each equipment inequality in the building were randomly generated. Each individual is represented as the feasible value of all control variables and coded according to real numbers. Vector uij represents the jth equipment control variable of the ith individual, and uijmax and uijmin represent their upper and lower limits, respectively.
1) Calculate the fitness value of each wolf in the population, and select the first three best wolves to save them as α, β, and γ.
2) According to the four steps of the gray wolf algorithm, including encirclement, hunting, attack, and search, update the current gray wolf individual position and relevant algorithm parameters.
3) Randomly add M new gray wolves to maintain population diversity.
4) According to niche technology and fitness-sharing mechanisms (23)–(25), adjust the fitness of individuals in the niche.
5) Adopt roulette strategy to select N excellent gray wolves to enter the next-generation and calculate the fitness to obtain the global optimal value.
6) Determine whether the number of iterations is satisfied; if the number of iterations iter is greater than the maximum number of iterations itermax, end the loop and output the result, and obtain the compromise solution by sorting according to the gray weighted correlation degree; otherwise, proceed to step 2).
6 Case study
6.1 Input data and assumptions
The commercial complex is located at 37°54′N, 112°33′E. The building is a single-family building with a length of 70 m, width of 50 m, a 3-storey height, and a total of 33 floors. The exterior walls of the building are made of cement bricks, the windows are made of PVC material and plastic, and double-layer sound insulation vacuum glass is used. The location of the commercial complex is a provincial capital city facing north. Based on the survey data and the relationship between the building windows and the direct angle of the Sun, this study approximately takes ISwinSC as 0.45ISwin, and the air density ρ and air specific heat capacity C are respectively considered as 1.2 kg/m3 and 1000 J/kg°C; centralized office hours are from 8:00 to 20:00.
When the time-of-use electricity price is adopted, the electricity price and load changes can be effectively transmitted to the user side to guide and change the electricity consumption behavior of users, thereby improving the economic level of the building microgrid operation. In this study, the time-of-use electricity price is utilized to purchase the electricity shortage of the microgrid from the external power grid to guide the electricity consumption behavior of users in the building. The electricity price is 0.65 yuan/kWh from 10 to 20 h, and the electricity price is 0.45 yuan/kWh from 0 to 9 h and 21–24 h. The price of natural gas is 2.68 yuan/m3, and the price of its equivalent unit calorific value is 0.45 yuan/kWh. The upper limit of the tie line power between the building microgrid and the external grid is set to 400 kW, while the other simulation-related parameters are listed in Table 1.
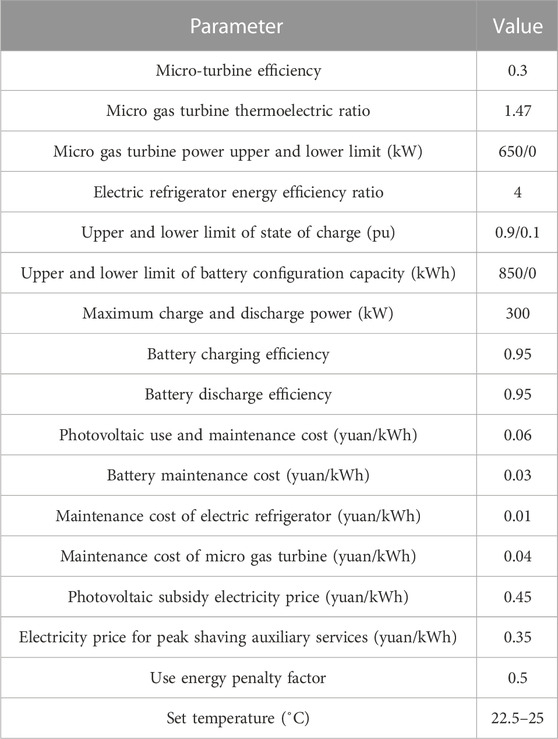
TABLE 1. Equipment electrical parameters.
6.2 Simulation example and result analysis
To verify the effectiveness of the building comprehensive energy optimization model and optimization algorithm proposed in this study, the initial values of the optimization variables are obtained according to a uniform distribution within the constraint range, and the following two scenarios are set for calculation and analysis:
Case 1. Optimization of a single scene in winter (December); Case 2: Optimization of a single scene in summer (June);
6.3 Typical scenarios in winter
For the Case 1 scenario, December is winter in the north, the solar light intensity is low, and the temperature difference between day and night is large. To improve the energy-saving level of the building microgrid system, based on the principle of virtual energy storage in buildings, the temperature in the building is actively reduced in winter, forming a virtual energy storage thermal load response of the building, as illustrated in Figure 2. Based on the virtual energy storage of this building, the optimal configuration calculation in the typical scenario of Case 1 is performed, and the typical daily operation results are listed in Table 2.
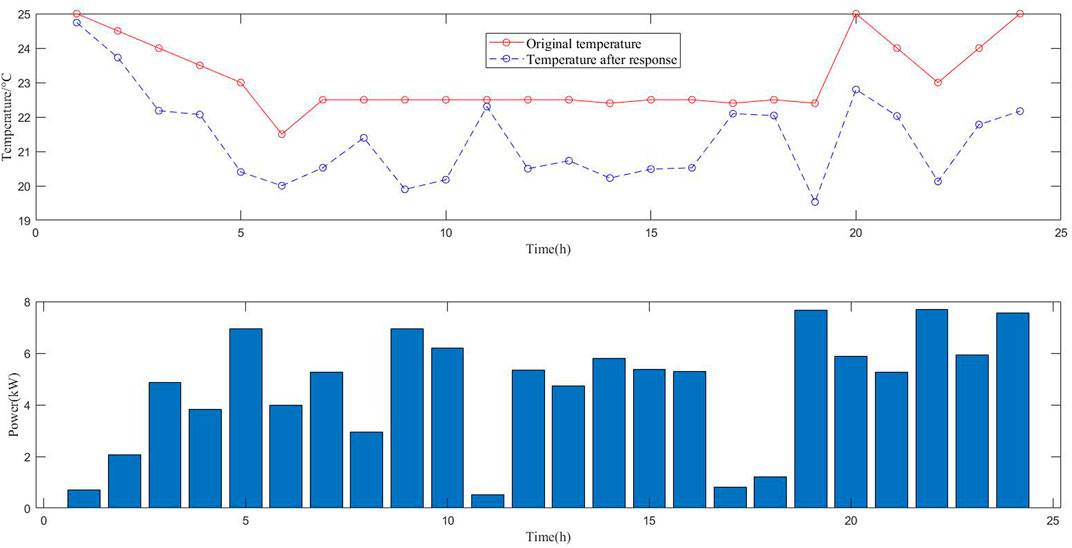
FIGURE 2. Building virtual energy storage and temperature change.
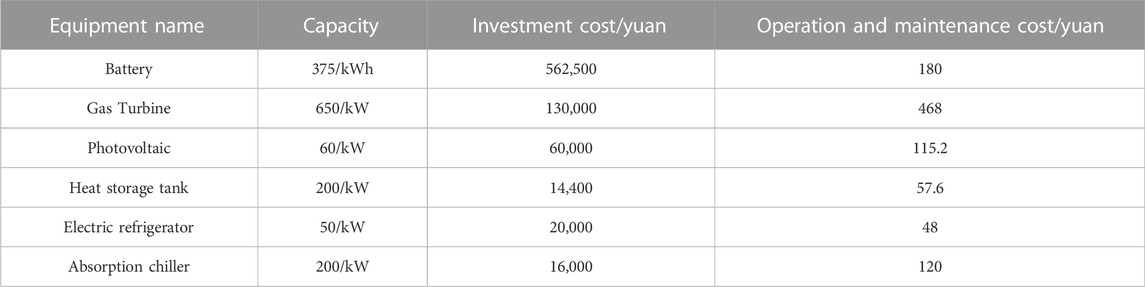
TABLE 2. Optimization results of building microgrid system for Case 1.
It is evident from the results in Table 2 that solar energy resources are not particularly abundant in winter, and the photovoltaic configuration capacity is small, as presented in Figure 3. The primary function of the electric energy storage system is to cooperate with the photovoltaic system to enhance the utilization rate of photovoltaics simultaneously, play the role of peak shaving and valley filling and emergency load support, and improve the economic level of the comprehensive energy system of the building. The capacity of the battery energy storage system is configured to 375 kWh.
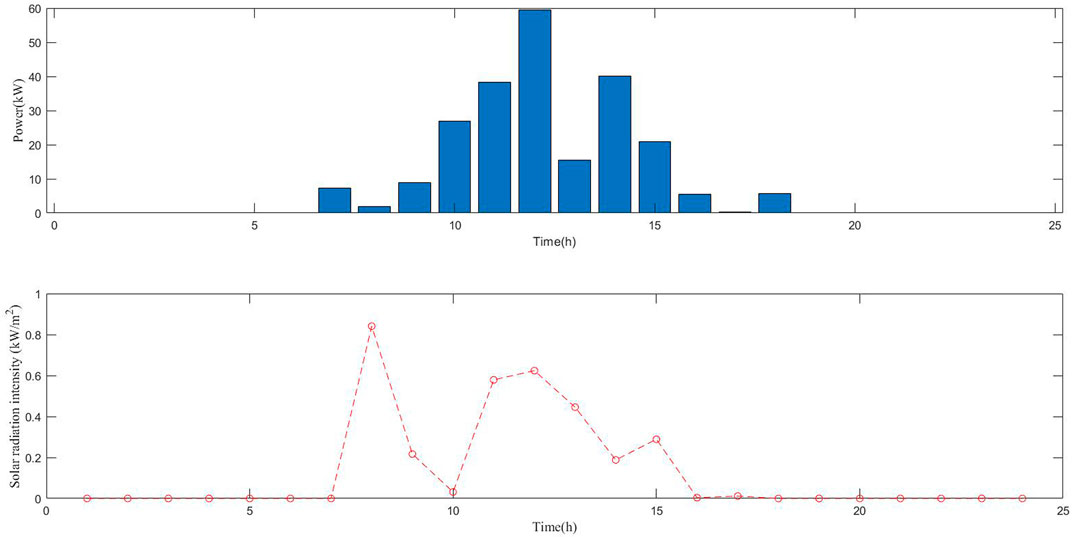
FIGURE 3. Photovoltaic output and light curve under Case 1.
As the main energy supply equipment of the building system, the gas turbine provides electricity and thermal power to the building system, and is the main adjustment method for the building microgrid integrated energy system. Ensuring a reliable supply of heat load is also one of the reasons for the larger configuration of gas turbines.
The absorption refrigeration unit converts the heat generated by the gas turbine power generation into the cooling load; however, it needs to effectively cooperate with the heat storage tank to ensure reliable operation of the heat load system of the building integrated system. Therefore, under the conditions of a typical winter day, the facility configuration capacity in relation to the heat load is higher. In contrast, the cooling load of electric refrigeration and air conditioners is low in winter, and refrigeration equipment is configured according to the lower limit in typical winter scenarios.
Under the calculation conditions of Case 1, to make the configuration capacity of the building microgrid system more reasonable, the optimal scheduling of each piece of equipment on a typical day is performed. The results are presented in Figures 4–6, and the cost-effectiveness of the economical operation is as follows: the environmental cost, fuel cost, photovoltaic consumption benefit, and building virtual energy storage benefit are 309, 2,360, 137, and 189 yuan, respectively. As shown in the figure, owing to the active reduction in indoor temperature in winter, the virtual energy storage of the building has a charging effect to reduce the operating cost of the system. However, in winter, owing to the small amount of heat transferred by sunlight, the operation mode of heat storage and heat storage systems is relatively simple. To ensure a heat supply, gas turbines make the operation mode of the entire integrated energy system inflexible, and the unbalanced power in the microgrid is adjusted by the external grid.
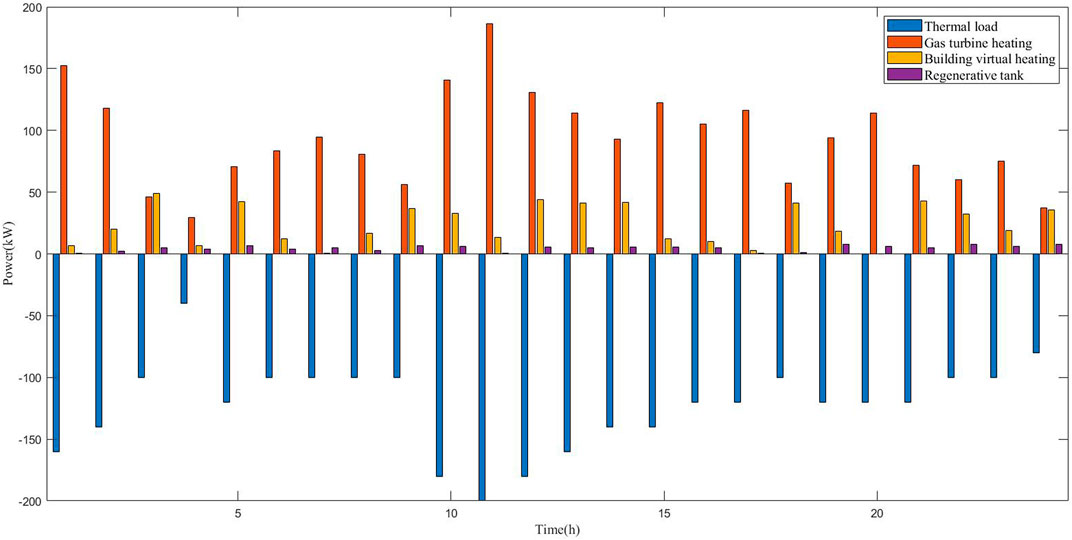
FIGURE 4. Optimization results of the heat load under Case 1.
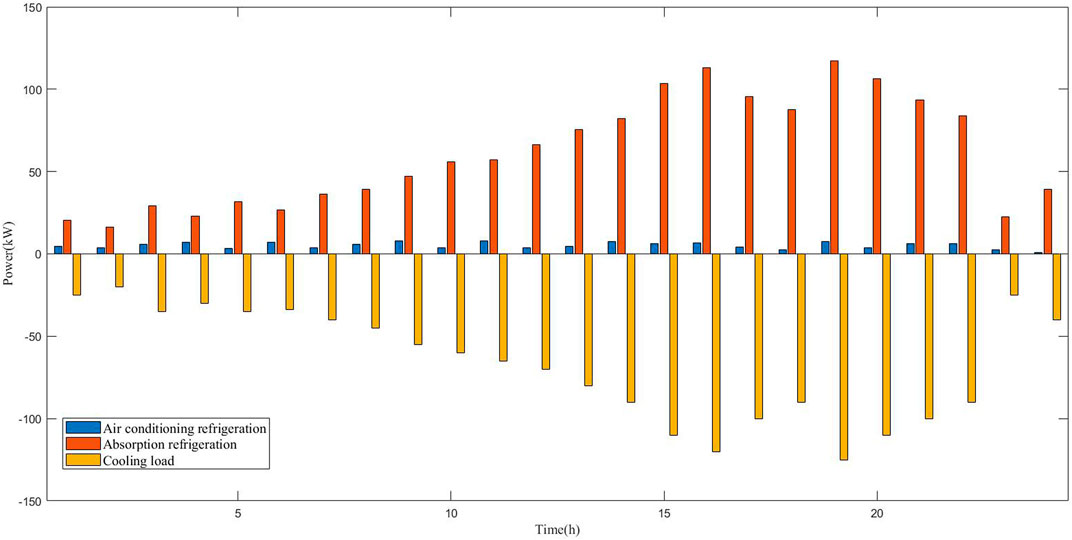
FIGURE 5. Optimization results of cooling load under Case 1.
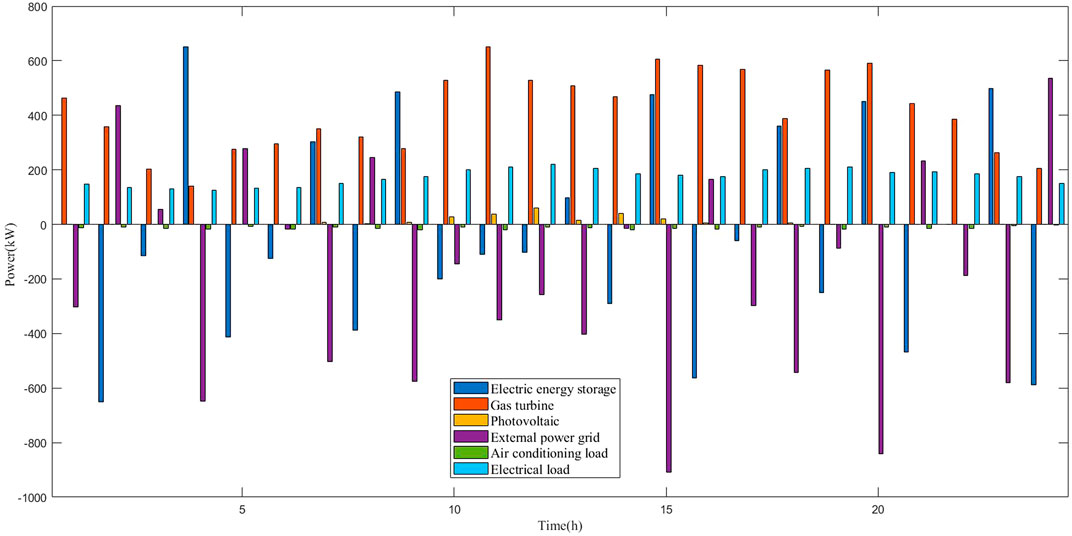
FIGURE 6. Optimization results of power load under Case 1.
6.4 Typical scenarios in summer
For the Case 2 scenario, June is summer in the north, the solar light intensity is high, and the temperature difference between day and night is small. To enhance the energy-saving level of the building microgrid system, based on the principle of virtual energy storage in the building, the temperature in the building is actively increased in summer, and the virtual energy storage and cooling load response of the building is formed, as illustrated in Figure 7. Based on the virtual energy storage of the building, the optimization calculation is performed under the typical scenario of Case 2, and the typical daily operation results are listed in Table 3.
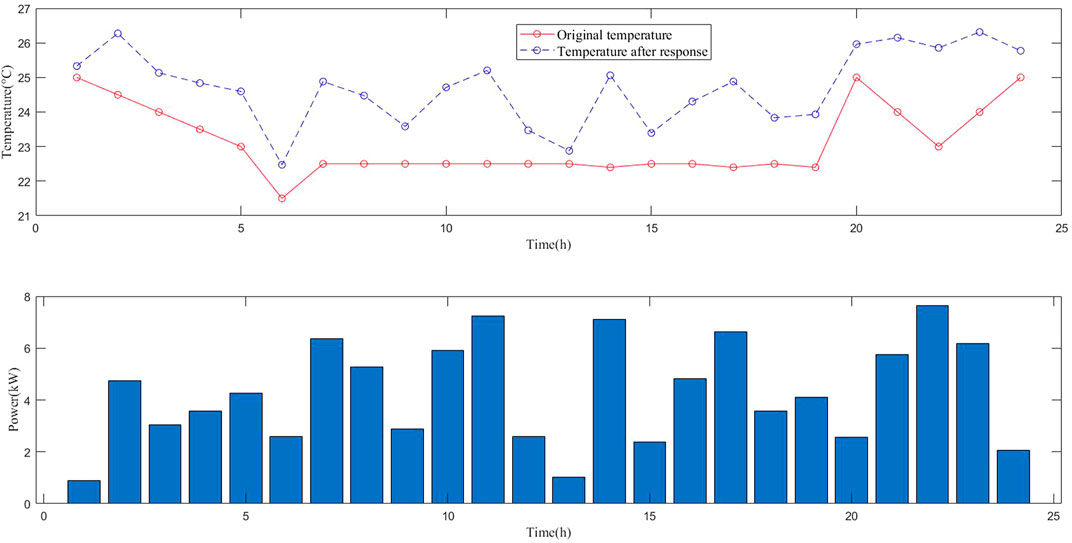
FIGURE 7. Photovoltaic output and light curve under Case 2.
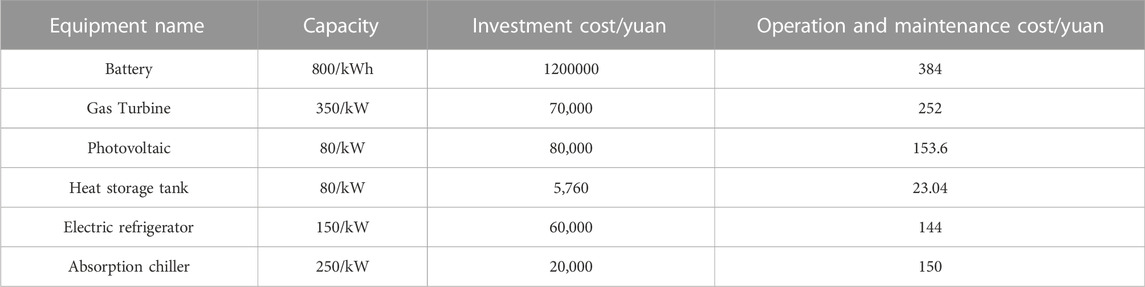
TABLE 3. Optimization results of the building microgrid system under Case 2.
As indicated in Table3, considering that solar energy resources are particularly abundant in summer, the photovoltaic capacity configuration is relatively high, as depicted in Figure 8. The primary function of an electric energy storage system is to cooperate with the photovoltaic system to improve the utilization rate of photovoltaics. Simultaneously, the economic level of the building’s comprehensive energy system can be improved as much as possible through the strategy of low storage and high discharge. The capacity configuration is 800 kWh. In summer, the cooling load demand is primarily considered, and the heating load is small. The gas turbine supplies a small amount of cooling load to the system via the absorption chiller; therefore, the gas turbine is configured to 350 kW in a typical summer scenario. In contrast, cooling load-related facilities have a higher configuration capacity to ensure a reliable supply of the cooling load of the building integrated system.
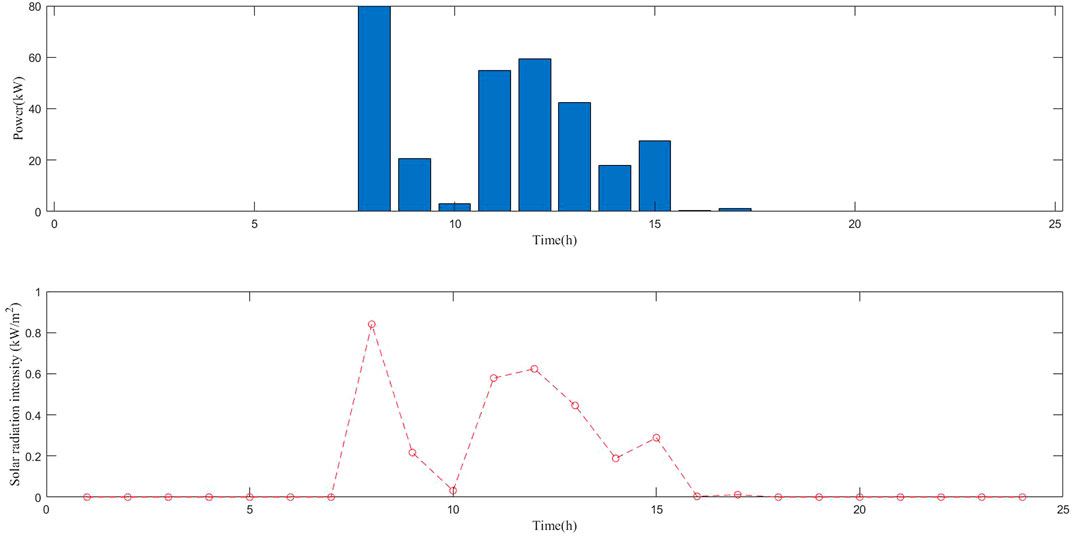
FIGURE 8. Building virtual energy storage and temperature change.
Under the calculation conditions of Case 2, the optimal scheduling results for the building microgrid system are presented in Figures 9–11, and the cost-effectiveness of the economical operation is as follows: the environmental cost, fuel cost, photovoltaic consumption benefit, and building virtual energy storage benefit are 259, 1,640, 337 and 209 yuan, respectively. It is evident from the figure that, owing to the strong sunlight in summer and the small heating load of the gas turbine, the electric energy storage system participates in the energy storage adjustment, which makes the operation mode of the entire integrated energy system more flexible, and the balance of the electric heating and cooling load does not depend on the external power grid. Therefore, in a typical summer scenario, the time-of-use electricity price mechanism of the external power grid can maximize the effect of low storage and high discharge in the building microgrid system to maximize the economic benefit of the building microgrid.
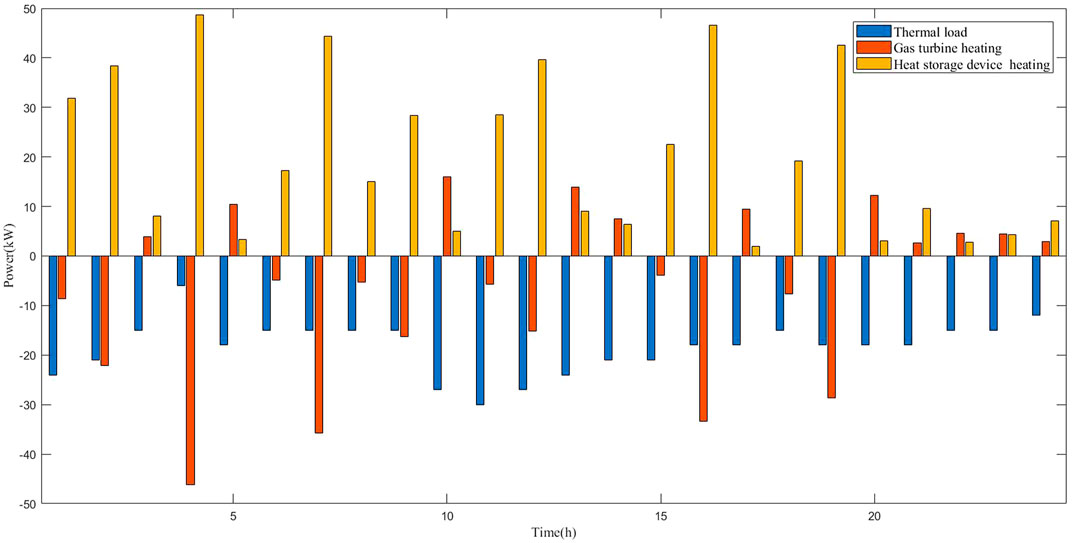
FIGURE 9. Optimization results of heat load under Case 2.

FIGURE 10. Optimization results of cooling load under Case 2.
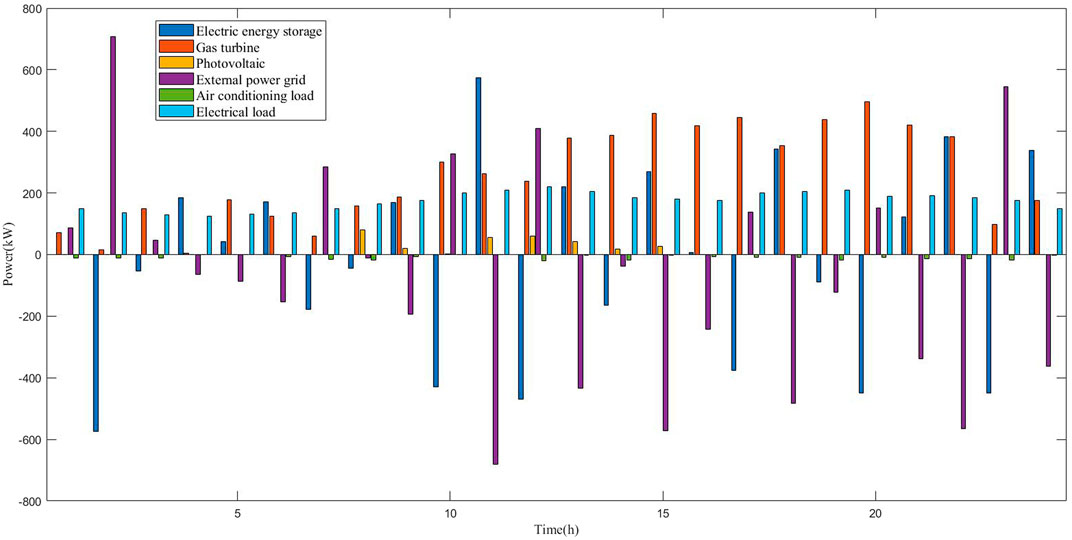
FIGURE 11. Optimization results of power load under Case 2.
6.5 Algorithm convergence analysis
We proposed an improved multi-objective gray wolf optimization algorithm based on niche technology, and the gray weighted correlation index was employed to evaluate and analyze the optimization results. Figure 12 illustrates the multi-objective convergence curve of a typical winter day. The convergence curve was relatively smooth and stable. The 100 fitness function values (non-dominated solutions) obtained by optimization were closely distributed around the gray wolf population (dominated solution set), indicating that the niche technique used in this study effectively improved the ability of non-dominated solutions to approach optimal solutions. Simultaneously, multiple non-dominated solutions improved the selectivity of users and obtained the optimal proportion of investment costs and comprehensive benefits through the gray-weighted correlation value. In summary, the multi-objective gray wolf optimization algorithm based on niche technology proposed in this paper exhibits good convergence in the optimization and solution of a building microgrid system.

FIGURE 12. Pareto Frontier solution set under Case 1.
7 Conclusion
In this study, we constructed a virtual energy storage system model based on the thermal storage characteristics of a building. On this basis, a capacity configuration and operation optimization method for a building microgrid integrated energy system that considers virtual energy storage was proposed. Through theoretical analysis and simulation, the following conclusions were drawn:
1) Virtual energy storage technology was integrated into the optimization model of the building microgrid energy system. By adjusting the indoor temperature of the building to satisfy user requirements, energy management based on virtual energy storage improved the operating economy of the building microgrid system.
2) User satisfaction reflected the control effect of virtual energy storage to a certain extent. The larger the indoor temperature control range, the more obvious the virtual energy storage control effect, which indicated that the system had general requirements for user satisfaction and lower operating costs. In contrast, the system had higher requirements for user satisfaction and higher operating costs.
3) The improved multi-objective gray wolf optimization algorithm based on niche technology effectively coordinated the optimization relationship between comprehensive benefits and investment costs, improving the ability of non-dominated solutions to approach the optimal solution, and effectively determining the optimal solution through the gray-weighted correlation degree evaluation method, reducing the investment cost of the building microgrid system, and enhancing the comprehensive operation benefit of the building system.
The virtual energy storage system can better respond to the power system to fill valleys and cut peaks, and reduce operating costs of integrated energy systems. At the same time, it improves new energy digestion capacity to reduce carbon emissions. These provide new ideas for green and low-carbon operation of integrated energy system.
Data availability statement
The raw data supporting the conclusion of this article will be made available by the authors, without undue reservation.
Author contributions
GL and YJ conceived of and designed the study. YZ and YN translated the articles and prepared the tables. JZ constructed and solved the model. JC and YN wrote the first draft of the manuscript. WW drew the microgrid system diagrams. All authors contributed to the revision of the manuscript and read and approved the submitted version.
Funding
This work is supported by the Science and Technology Project of State Grid Corporation of China (Grant No. 5100-202155289A-0-0-00) “Research on implementation path of new-type power system with new energy as the main body”. The funder was not involved in the study design, collection, analysis, interpretation of data, the writing of this article, or the decision to submit it for publication.
Acknowledgments
The authors would like to thank the sponsorship of Science and Technology Project of State Grid Corporation of China.
Conflict of interest
The authors declare that the research was conducted in the absence of any commercial or financial relationships that could be construed as a potential conflict of interest.
Publisher’s note
All claims expressed in this article are solely those of the authors and do not necessarily represent those of their affiliated organizations, or those of the publisher, the editors and the reviewers. Any product that may be evaluated in this article, or claim that may be made by its manufacturer, is not guaranteed or endorsed by the publisher.
References
Bahmani, R., Karimi, H., and Jadid, S. (2021). Cooperative energy management of multi-energy hub systems considering demand response programs and ice storage. Int. J. Electr. Power & Energy Syst. 130, 106904. doi:10.1016/j.ijepes.2021.106904
Chang, J., Yang, X., Zhang, Z., Zheng, S., and Cui, B. (2022). Multi-objective optimal source–load interaction scheduling of combined heat and power microgrid considering stable supply and demand. Front. Energy Res. 10, 901529. doi:10.3389/fenrg.2022.901529
Dounis, A. I., and Caraiscos, C. (2009). Advanced control systems engineering for energy and comfort management in a building environment—a review. Renew. Sustain. Energy Rev. 13, 1246–1261. doi:10.1016/j.rser.2008.09.015
Favre-Perrod, P. (July 2005). A vision of future energy networks,” in Proceedings of the 2005 IEEE power eng. soc. inaugural conference and exposition in Africa, Durban, South Africa.
Guan, X., Xu, Z., and Jia, Q. S. (2010). Energy-efficient buildings facilitated by microgrid. IEEE Trans. Smart Grid 1, 243–252. doi:10.1109/TSG.2010.2083705
Hca, B., Lin, G., and Zhong, Z. C. (2021). Multi-objective optimal scheduling of a microgrid with uncertainties of renewable power generation considering user satisfaction. Int. J. Electr. Power & Energy Syst. 131, 107142. doi:10.1016/j.ijepes.2021.107142
Hedman, B. A., and Hampson, A. C., (2021). Fuel and carbon Dioxide emissions savings calculation methodology for combined heat and power systems, American Society of Heating, Refrigerating, and Air-Conditioning Engineers, Inc, Atlanta, Georgia, USA.
Jin, X., Mu, Y., Jia, H., Wu, J., Jiang, T., and Yu, X. (2017). Dynamic economic dispatch of a hybrid energy microgrid considering building based virtual energy storage system. Appl. Energy 194, 386–398. doi:10.1016/j.apenergy.2016.07.080
Li, Z., Wang, C., Li, B., Wang, J., Zhao, P., Zhu, W., et al. (2020). Probability-interval based optimal planning of integrated energy system with Uncertain wind power. IEEE Trans. Ind. Appl. 18, 4–13. doi:10.1109/TIA.2019.2942260
Liu, D., Wu, J., Lin, K., and Wu, M. (2019). Planning of multi energy-type micro energy grid based on improved kriging model. IEEE Access 7, 14569–14580. doi:10.1109/access.2019.2894469
Lu, Y., Wang, S., Sun, Y., and Yan, C. (2015). Optimal scheduling of buildings with energy generation and thermal energy storage under dynamic electricity pricing using mixed-integer nonlinear programming. Appl. Energy 147, 49–58. doi:10.1016/j.apenergy.2015.02.060
Ma, L., Liu, N., Wang, L., Zhang, J., Lei, J., Zeng, Z., et al. (2016). Multi-party energy management for smart building cluster with PV systems using automatic demand response. Energy Build. 121, 11–21. doi:10.1016/j.enbuild.2016.03.072
Ma, T., Wu, J., Hao, L., Lee, W., Yan, H., and Li, D. (2018). The optimal structure planning and energy management strategies of smart multi energy systems. Energy 160, 122–141. doi:10.1016/j.energy.2018.06.198
Mirjalili, S., Mirjalili, S. M., and Lewis, A. (2014). Grey wolf optimizer. Adv. Eng. Softw. 69, 46–61. doi:10.1016/j.advengsoft.2013.12.007
Pazouki, S., Haghifam, M. R., and Moser, A. (2014). Uncertainty modeling in optimal operation of energy hub in presence of wind, storage and demand response. Int. J. Electr. Power & Energy Syst. 61, 335–345. doi:10.1016/j.ijepes.2014.03.038
Qiu, J., Yang, H., Dong, Z. Y., Zhao, J. H., Meng, K., Luo, F. J., et al. (2015). A linear programming approach to expansion co-planning in gas and electricity markets. IEEE Trans. Power Syst. 31, 3594–3606. doi:10.1109/TPWRS.2015.2496203
Si, Q., and Ma, Z., (2019). DEA cross-efficiency ranking method based on grey correlation degree and relative entropy. Entropy 21, 966. doi:10.3390/e21100966
Wang, D., Lai, C. S., Li, X., Wu, R., Gao, X., Lai, L. L., et al. (2021). Smart coordination of virtual energy storage systems for distribution network management. Int. J. Electr. Power & Energy Syst. 129, 106816. doi:10.1016/j.ijepes.2021.106816
Wang, Y., Hu, C., Wu, B., Zhang, J., Zi, Z., and Kang, L. (2020). Matching characteristic research of building renewable energy system based on virtual energy storage of air conditioning load. Energies 13 (135), 1269. doi:10.3390/en13051269
Yin, B., Li, Y., Miao, S., Lin, Y., and Zhao, H. (2021). An economy and reliability co-optimization planning method of adiabatic compressed air energy storage for urban integrated energy system. J. Energy Storage 40, 102691. doi:10.1016/j.est.2021.102691
Yuhui, H., Jiandong, D., Xinyu, Q., and Hao, H. (November 2017). Research on Dispersed wind generation planning in distributed system based on Voltage maximum Correntropy. IEEE Publications. Proceedings of the 2017 IEEE Conference on Energy Internet and Energy System Integration (EI2), Beijing, China.
Zhang, X., Zhao, X., Jiang, Z., and Shao, S. (2017). How to achieve the 2030 Co2 emission-reduction targets for China’s industrial sector: Retrospective decomposition and prospective trajectories. Glob. Environ. Change 44, 83–97. doi:10.1016/j.gloenvcha.2017.03.003
Zhao, Y., Lu, Y., Yan, C., and Wang, S. (2015). MPC-based optimal scheduling of grid-connected low energy buildings with thermal energy storages. Energy Build. 86, 415–426. doi:10.1016/j.enbuild.2014.10.019
Keywords: building heat storage characteristics, building microgrid, gray weighted correlation degree, multi-objective optimization, virtual energy storage
Citation: Lv G, Ji Y, Zhang Y, Wang W, Zhang J, Chen J and Nie Y (2023) Optimization of building microgrid energy system based on virtual energy storage. Front. Energy Res. 10:1053498. doi: 10.3389/fenrg.2022.1053498
Received: 25 September 2022; Accepted: 30 November 2022;
Published: 18 January 2023.
Edited by:
Yingjun Wu, Hohai University, ChinaReviewed by:
Jianli Yu, Weifang University, ChinaQiushi Cui, Arizona State University, United States
Na Li, Delft University of Technology, Netherlands
Copyright © 2023 Lv, Ji, Zhang, Wang, Zhang, Chen and Nie. This is an open-access article distributed under the terms of the Creative Commons Attribution License (CC BY). The use, distribution or reproduction in other forums is permitted, provided the original author(s) and the copyright owner(s) are credited and that the original publication in this journal is cited, in accordance with accepted academic practice. No use, distribution or reproduction is permitted which does not comply with these terms.
*Correspondence: Yonghui Nie, bmlleW9uZ2h1aUBuZWVwdS5lZHUuY24=