 Seung Jin Oh
 Yeongmin Kim
 Youngsun Hong
 Jong Woo Kim
 Byungchan Kang
- 1Sustainable Technology and Wellness R&D Group, Korea Institute of Industrial Technology, Jeju Special Self-Governing Province, Jeju-si, Korea
- 2INTERTECH Co, Ltd., Jeju Special Self-Governing Province, Jeju-si, Korea
- 3Local Energy R&D Center, Jeju Energy Corporation, Jeju Special Self-Governing Province, Jeju-si, Korea
The study presents an energy-efficient desalination system that combines direct contact membrane distillation (DCMD) and a heat pump to improve thermal efficiency and integrate with photovoltaics. DCMD is a sort of thermal desalination process, and it requires a lot of thermal energy. A heat pump is a device that produces both hot and cold energy simultaneously with less electrical energy input compared to other heating devices, such as a boiler and an electrical heater. A hollow-fiber DCMD and a 10-kW water-to-water heat pump were considered for a numerical simulation in this study. Numerical models were established for each device and validated against the results obtained from the literature. The simulation was first carried out to identify the performance of the system based on the baseline. After that, a series of simulations were carried out in order to investigate the performance of the proposed system in terms of specific energy consumption (SEC), gained output ratio (GOR), and the coefficient of performance (COP) under various operating conditions. Results showed that the minimum SEC and the maximum GOR were achieved at the inlet feed water temperature of 66.5°C with a mass flow rate of 20 kg/min and the inlet permeate temperature of 19.8°C with a mass flow rate of 10 lpm. On the other hand, it was found that the maximum COP can be observed at the inlet feed water temperature of 23.6°C with a mass flow rate of 10 lpm and at the inlet permeate temperature of 8.9°C with a mass flow rate of 20 lpm.
1 Introduction
Fresh water supply on earth is energy-intensive as it requires either epic solar energy for the natural water cycle or fossil energy to power the thermally or electrically driven desalination processes. Since fossil energy sources such as fuel oil, natural gas, and coal are finite in their reserves and are the main cause for global warming, conventional desalination technologies must look to lowering the kWh per cubic meter of water production (Shahzad et al., 2017; Chen et al., 2020a; Alrowais et al., 2020; Chen et al., 2020b; Chen et al., 2021; Jamil et al., 2021; Ng et al., 2021).
Membrane distillation (MD) is a novel and emerging desalination technology based on a membrane-separation process (Gryta, 2007; Lee et al., 2015). Since membrane fabrication techniques improved in the 1980s, MD has received much attention and was mainly employed to separate freshwater from brackish water or seawater (Alklaibi, 2008). There are four different types of MD processes that are widely used and investigated in the desalination area. They are direct contact membrane distillation (DCMD), air gap membrane distillation (AGMD), sweep gas membrane distillation (SGMD), and vacuum membrane distillation (VMD) (Banat and Simandl, 1994; Hsu et al., 2002; Wirth and Cabassud, 2002; Boi et al., 2005; Chouikh et al., 2005; Qtaishat et al., 2008).
Among the aforementioned membrane distillation processes, direct contact membrane distillation (DCMD) has the simplest configuration and yet exhibits relatively high flux. In DCMD, the membrane, which is in direct contact with a hot feed water stream and a cold permeate stream, plays a role in separating the two streams, creating a temperature gradient across the membrane that is the driving force for water vaporization. Such separating membranes are characterized by being hydrophobic, porous, and permeable so that only water vapor is allowed to transport from the hot feed side to the cold permeate side.
As in other thermal desalination processes, in the DCMD process, thermal loss occurs inevitably due to heat transfer from the hot feed water to the cold permeate through a thin membrane. Therefore, a significant amount of thermal energy is required in order to continuously vaporize water molecules in the feed water and condensate the water vapor transported across the membrane pores.
A heat pump can be one of the solutions to solve the aforementioned problem in DCMD. A heat pump can produce heat and cold energy simultaneously by consuming a small amount of electricity. The power consumption is noticeably less than in other heating or cooling devices, such as a heater or a boiler. Thus, the integration of DCMD with a heat pump could be an innovative method to reduce the energy consumption of the MD process. Furthermore, such an efficient heat pump can be powered by photovoltaics in a remote area where the electricity grid is unavailable.
Many studies have been performed with various types of membrane distillation processes to investigate performance experimentally and theoretically under various operating conditions. M. Qtaishat et al. conducted a detailed study on heat and mass transfer in DCMD and found that the permeate flux, heat transfer coefficients, mass transfer coefficients, and evaporation efficiency increased when the feed temperature increased (Qtaishat et al., 2008). The varying feed temperature hence plays an important role in MD processes. Yanbin Yun et al. conducted an experiment to investigate the performance of a DCMD with a high NaCl concentration solution (Yun et al., 2006). They found out that flux increases with increasing feed temperature and flow rate, that it increases with a decrease in permeate temperature and NaCl concentration, and that the flux declined sharply while the NaCl concentration was getting saturated, and the flux started to approach a steady state after the NaCl solution was saturated. It was concluded that for membrane fouling there was an inevitable high NaCl concentration. R. Chouikh et al. investigated the feasibility of a modified AGMD (Chouikh et al., 2005). In the proposed design, the air was moved by temperature differences across the top and bottom of the air gap instead of a stagnant air film. It was concluded that the moving air film increased the velocity level between the gap and, hence, improved the permeate flux. B. Fawzi et al. presented an experimental study coupled with a theoretical analysis of an AGMD system (Banat and Simandl, 1994). Based on both the experimental and theoretical results, it was concluded that the permeate flux is greatly affected by membrane wetting and that thermal diffusion can be neglected as compared to ordinary diffusion. G.W. Meindersma et al. investigated water recycling using the Memstill concept, which is a type of AGMD carried out in a counter-current flow manner. It was found that AGMD is the most efficient of all MD processes (Meindersma et al., 2006). In addition, it was calculated that by using waste heat to heat up the feed solution, the total water cost is $0.26/m3 compared to that of RO, which is $0.45/m3. M.N. Chernyshov et al. presented a study on spacers’ comparison and concluded that different spacers have their own advantages, and they can be the most suitable for different processes (Chernyshov et al., 2005). The two best spacers in their experiment have (1) round rod filaments with a flow attack angle of 45° and angle between the filaments of 90° and (2) spacers with twisted tapes with angle of attack of 30° and an angle between filaments of 120°. M. N. The authors also presented mathematical models to describe the flow in the feed channel of an AGMD system. Their models could predict velocity profiles, temperature profiles, and concentration profiles.
Boi et al. presented a hybrid type of an MD process between SGMD and AGMD. It is named thermostatic SGMD (Boi et al., 2005). The permeation rate was observed to increase with an increase in the gas flow rate as well as an increase in the feed flow rate. Last, a mathematical model was proposed for predictive purposes for future studies. David Wirth and Corinne Cabassud investigated the effects of two different configurations (inside-out and outside-in) of a VMD system (Wirth and Cabassud, 2002). Comparisons were carried out on two hollow-fiber module configurations. Modules made of PVDF showed no difference. However, for the module made of PE fibers, it was discovered that the permeability is 41% lower for the outside-in configuration. Ping Peng et al. investigated the effect of attaching a hydrophilic layer onto a hydrophobic layer of a substrate (Peng et al., 2021). This new type of membrane is expected to solve the wetting problem, and their model showed potential to achieve a higher flux when the substrate has a pore size larger than 0.2 µm. M. Khayet et al. presented a new design of membranes made of a composite of hydrophilic and hydrophobic structures (Khayet et al., 2007). Using fluorinated surface-modifying macromolecules (SMMS), their method was advantageous in the sense that both dense and porous composite membranes can be prepared. Schofield et al., 1987 investigated the factors affecting flux in MD processes (R. Schofield). Results and analyses showed that the flux reduction in NaCl solution is mainly due to the decrease in vapor pressure, while for sucrose solution, the decrease is mainly due to viscosity change. It was concluded that MD is an attractive method for desalinating concentrated solutions. Marek Gryta et al. found that the system was stable with no decline in flux by using RO as a pretreatment for the MD system (Gryta, 2007).
This study aimed to numerically investigate a heat pump-driven direct contact membrane distillation (HP-DCMD) system. A numerical model was established, and a series of simulations were conducted to examine the performance of the proposed system under different operating conditions. The proposed system was evaluated in terms of specific energy consumption (kWh/m3) along with coefficient of performance (COP).
2 System description of heat pump-driven DCMD
The schematic of the proposed HP-DCMD is illustrated in Figure 1. A hollow-fiber DCMD was considered the core of the DCMD, and a 10-kw water-to-water heat pump was employed for heating the feed water and cooling the permeate. Table 1 shows the properties of the hollow-fiber membrane module, and Table 2 shows the specifications of the heat pump. The operating principle is as follows: the feed water is pumped into the condenser of the heat pump from the sea water tank and then heated in the condenser, in which the refrigerant in a gas phase turns into a liquid phase while losing its heat to the feed water. Subsequently, the heated feed water enters into the hollow fibers of the DCMD. At the same time, the permeate is drawn from the pure water tank and then cooled by the refrigerant in the evaporator of the heat pump, in which the refrigerant in a liquid phase turns into a gas phase by absorbing heat from the distilled water. The cold permeate then enters the shell side of the DCDM. The water vapor, as a volatile solution, is generated on the inner surface of the hollow-fiber membrane and transported to the permeate side through membrane pores. The permeate is heated by water vapor condensation and conduction through the membrane due to the temperature difference across the membrane. The heated permeate stream enters back into the permeate tank and is cooled by the seawater. It was assumed that the permeate tank is large enough that the temperature of the permeate discharge from the bottom of the tank is equal to the seawater temperature (25°C).
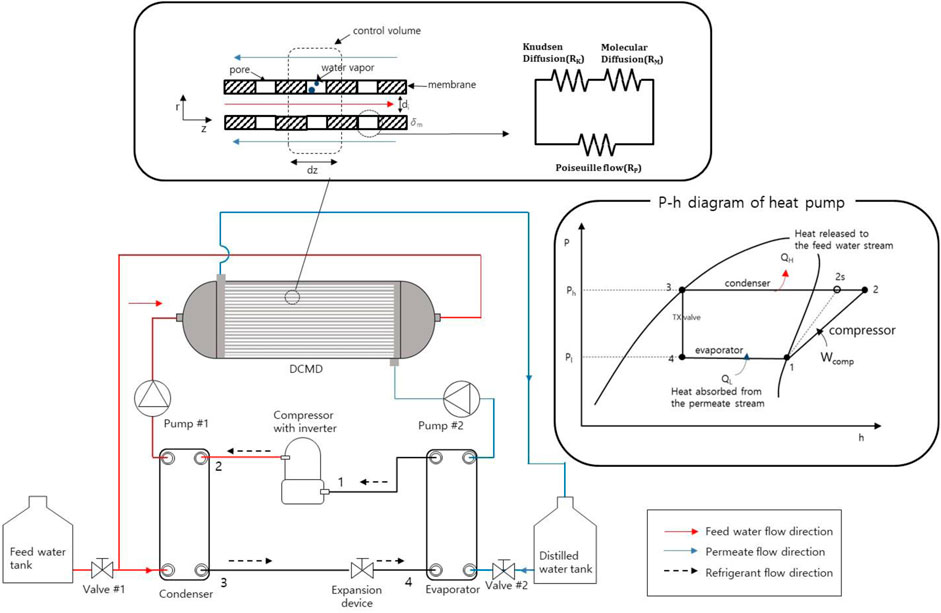
FIGURE 1. Schematic diagram of a heat pump-driven direct contact distillation.
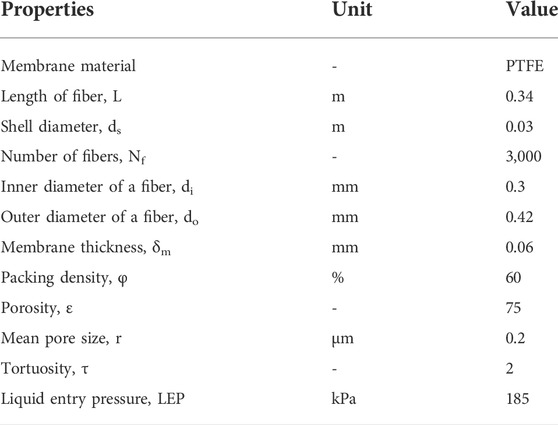
TABLE 1. Properties of the hollow fiber membrane for DCMD (Cheng et al., 2008; Lee et al., 2015).
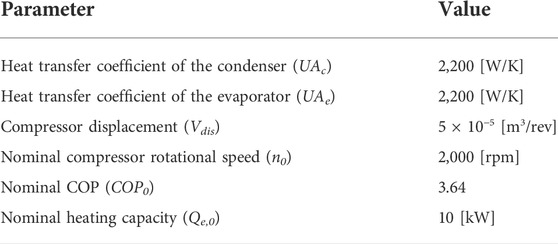
TABLE 2. Specification of the heat pump (Underwood, 2015).
3 Mathematical modeling
In this study, mathematical models for the heat pump and the DCMD are established, and then coupled equations are solved simultaneously in order to examine the overall performance.
3.1 DCMD modeling
A commercial PVDF membrane was used as a contactor in DCMD in this study. PVDF has the best hydrophobicity, good chemical and thermal stability, and oxidation resistance, but it has the highest conductivity, which causes heat loss through membranes (Kim et al., 2013). Mass transport across the membrane can be classified into three types of diffusion mechanisms, namely, Knudsen diffusion, molecular diffusion, and Poiseuille flow (Lee et al., 2018). It is noteworthy that the contribution of these mechanisms depends on the properties of the membrane such as pore size and pore distribution. The main driving force for the mass transfer is the temperature gradient across the membrane, which creates the difference in the vapor pressure on the interface of the feed water side and the permeate side. In the DCMD process, mass transfer and heat transport occur simultaneously and interact with each other. The feed water evaporates on the interface between the feed water and the pore entrance, and then water vapor transports across the membrane under the local vapor pressure difference. Right after the water vapor reaches the surface of the permeate, it condenses into the permeate.
To simplify the heat and mass transfer processes, the following assumptions were made:
- The heat exchanged with the environment through the module wall can be ignored.
- The latent heat of evaporation and condensation does not change with concentration.
- The mass balance for the feed water and permeate streams is maintained during the process.
- Both the feed side and the permeate side are incompressible flow and laminar flow.
- No chemical reaction occurs.
The mass flux through the membrane can be expressed as follows
where C is the membrane distillation coefficient through the hydrophobic membrane. PF,m and PP,m are the water vapor pressures at the liquid–vapor interface on the feed water and permeate sides of the membrane, respectively. The membrane distillation coefficient through the hydrophobic membrane can be described by the KMPT model, which addresses the combination of Knudsen diffusion, molecular diffusion, and Poiseuille flow:
where RK, RM, and RP are expressed by the equations listed in Table 3.
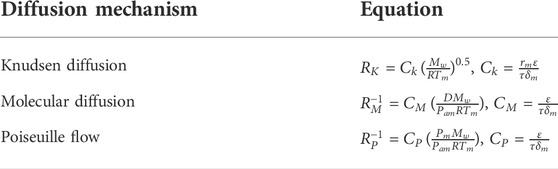
TABLE 3. Diffusion models of the DCMD process (Ding et al., 2003).
In Table 3, rm is the mean pore radius of the membrane, Mw is the molar mass of water, and R is the universal gas constant. τ is the membrane tortuosity, and δ is the membrane thickness. D is the diffusion coefficient of water vapor in air and is calculated by Marrero and Mason’s empirical equation:
where Tm is the mean temperature of the membrane and Pm is the mean water vapor pressure inside the pores of the membrane:
The water vapor pressure on the feed water side can be calculated by the following equation:
where Pw,m is the pure water vapor pressure and x F is the molar fraction of non-volatile solute. The pure water vapor pressure is calculated by Antoine’s equation as follows
The energy balance for the control volume of the feed water stream can be derived in terms of temperature by the following equation:
where hf represents the convective heat transfer coefficient of the feed water stream. di and uf are the inner diameters of the hollow fiber and the velocity of the feed water, respectively. ρF and cp,F is the density and specific heat capacity of the feed water, respectively.
The energy balance for the control volume of the permeate stream can be expressed by the following equation:
The heat transfer through the membrane is mediated by both latent heat of vaporization and heat conduction as follows:
where kM is the average thermal conductivity of the membrane and is obtained by
where ε represents the porosity of the membrane, kg is the thermal conductivity of gas molecules, and ks is the thermal conductivity of the membrane itself.
The latent heat of vaporization of water changes with temperature and can be obtained by
3.2 Heat pump modeling
A water-to-water heat pump was used in this study. The heat pump mainly consists of a compressor, an evaporator, a condenser, and an expansion device to complete one refrigeration cycle, producing heating and cooling power simultaneously. Some assumptions have been made in order to establish a simple mathematical model:
- The expansion valve is ideal without thermal losses.
- Heat transfer coefficients of the condenser and evaporator are constants.
- Superheating and sub-cooling are negligible.
- R134a is considered to be a refrigerant.
- No pressure drop in the heat exchangers is assumed.
Heat transfer in the condenser can be calculated by the energy balance of the refrigerant in the condenser, the energy balance of the feed water, and by using the effectiveness of the heat exchanger.
where Qc is the representative heat generated by the heat pump and
where UAc represents the heat transfer coefficient of the condenser.
In a similar way to the condenser, the cooling effect produced by the heat pump can be calculated by Eqs 17–19.
where h4 and h1 are the enthalpies of the refrigerant at the inlet and outlet of the evaporator, respectively.
The mass flow rate of the refrigerant that is sucked at the inlet of the compressor is determined by
where
where rc represents the pressure ratio between the condenser pressure and the evaporator pressure.
The compressor work required to create the pressure ratio depends on the difference in enthalpy between the inlet and the outlet, and it is affected by the isentropic efficiency in practice.
where h2 and h1 are the enthalpies of the refrigerant at the inlet and outlet of the compressor, respectively.
where Pcomp is the power consumption by the compressor and ηm is the motor efficiency. The isentropic efficiency can be approximated with the pressure ratio by the empirical formula.
The statured liquid refrigerant exiting the condenser is throttled to the low-pressure level through the expansion device, and its temperature drops to the evaporator temperature. The enthalpy remains during this process.
3.3 Performance assessment
The heat pump is generally evaluated in terms of the coefficient of performance (COP), which is defined by the following equation.
It is noteworthy that only one metric among COPc and COPh is typically used to evaluate the heat pump, depending on the operating mode (heating mode or cooling mode). For instance, when the heat pump is operating in heating mode, the cold energy is dumped into the environment as waste and vice versa. In the present system, however, there is no waste heat since both cold and hot energy are utilized simultaneously by heating the feed water and cooling the permeate. DCMD is assessed by the gain-output ratio (GOR) and specific energy consumption (SEC). GOR is a measure of the thermal efficiency of the system, while SEC indicates energy efficiency. They are defined, respectively, as follows:
where the numerator in Eq. 29 represents the latent heat of vaporization of the distillate produced and Qin is the heat input to the system. Ein is the amount of energy consumed by the system.
Table 4 shows the simulation conditions for the numerical investigation of the integrated HP-DCMD. During the simulation, the respective baseline conditions were kept constant, while other parameters were regulated as shown in Table 4.
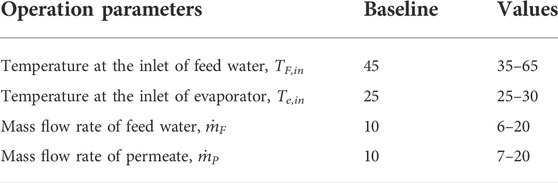
TABLE 4. Simulation conditions for the integrated HP-DCMD.
4 Results and discussion
4.1 Validation
In this study, the governing equations are solved in the MATLAB environment and the numerical models are validated with the published results from Cheng et al., 2008; Underwood, 2015. Since there is no experimental study on such a combined system, the heat pump and DCMD were validated separately. To evaluate the accuracy of mathematical models, root-mean-square error (RMSE) was used to measure the consistency between simulated results and experimental data, and it is expressed as (Chai and Draxler, 2014).
Figures 2A,B show the developed model for the heat pump agrees well with the reference data. Figure 2A depicts cooling power with the outlet temperature of the condenser, and Figure 2B shows the COP variation. The largest deviation of 2.4% was observed at the condenser temperature of 50 oC. As shown in Figure 3A,B, the simulated temperature variations and velocity variations along the length of the module agree well with the experimental values from Cheng et al., 2008 under the same operating conditions.
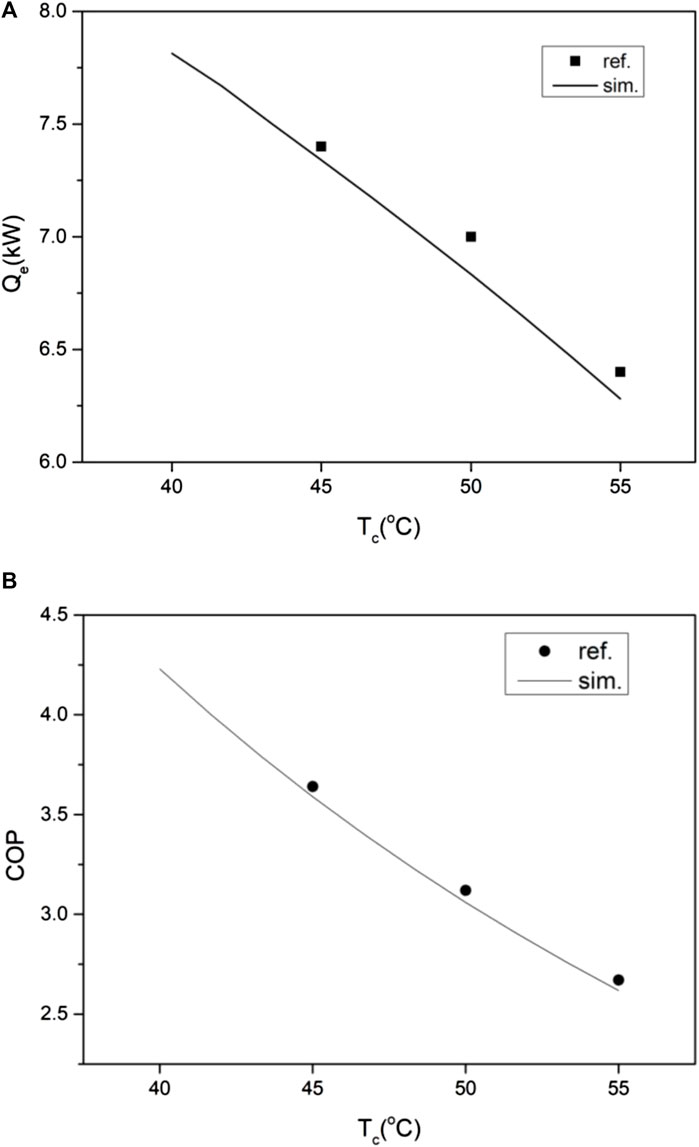
FIGURE 2. Validation of the numerical model equations for the heat pump: (A) cooling power (kW) and (B) COP.
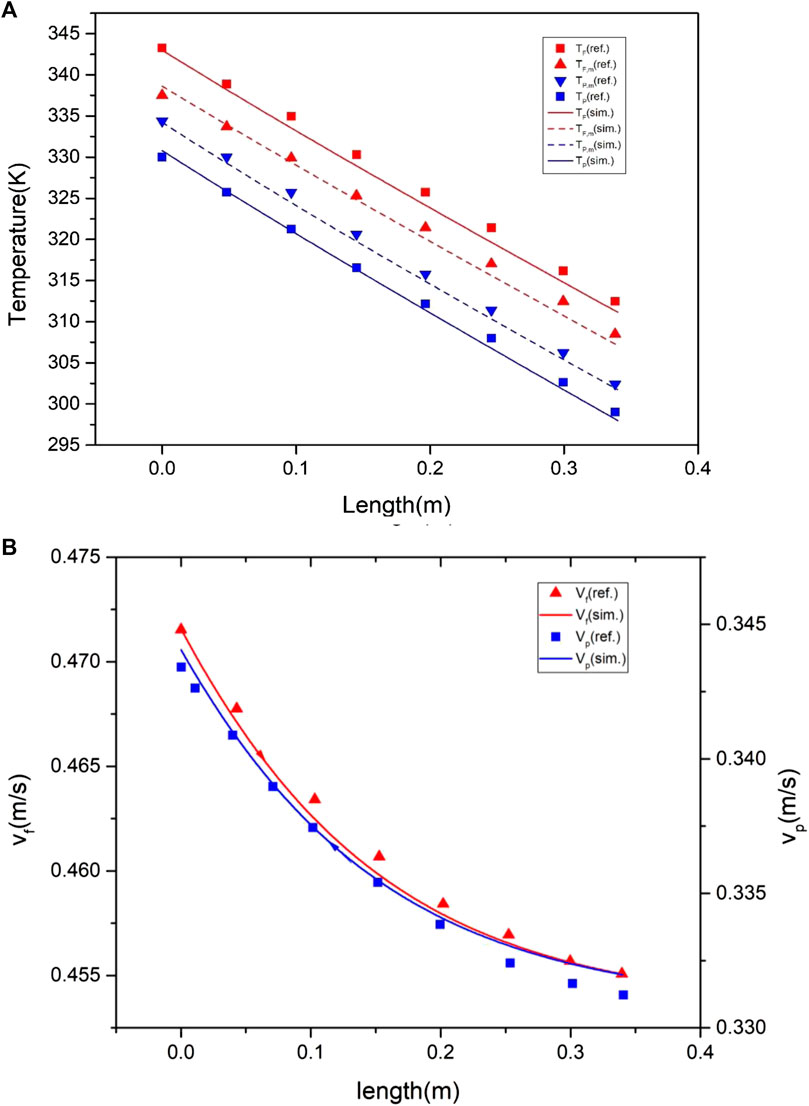
FIGURE 3. Validation of the numerical model for DCMD: (A) temperature profile and (B) velocity profile (m/s).
4.2 Performance assessment
Based on the developed mathematical models, a series of simulations were carried out to investigate the performance of the integrated HP-DCMD under various operating conditions. First, the performance of the HP-DCMD was predicted on the baseline operating conditions using the developed model equations. Figure 4A shows the temperature variations of the feed-water stream, the membrane surface of the feed-water side, the permeate stream, and the membrane surface of the permeate side. The feed-water temperature (TF) decreases from 45°C to 25.2°C, while the permeate temperature (TP) increases from 10°C to 29.8°C. TF and TF,m decrease linearly along the module length since the energy is released for water vaporization on the membrane surface and conduction heat loss occurs, whereas TP and TP,m increase linearly by the heat of condensation and the heat transfer through the membrane along the module length. It is noteworthy that a nearly constant temperature difference is maintained along the membrane module in a countercurrent flow configuration. Figure 4B presents the molar fraction of the non-volatile component and the local permeate flux along the module length. The local permeate flux decreases along the module length, while the molar fraction of the non-volatile component increases. The reason for the decrease in the local permeate flux is that the feed-water temperature decreases due to heat loss, as shown in Figure 4A, and thus the vapor pressure decreases. Figure 4C shows the performance indexes of HP-DCMD on the baseline operating conditions. The heat pump produced a heating power of 13.6 kW and a cooling power of 10.7 kW simultaneously at a steady state. The corresponding COPh and COPc are 4.5 and 3.5, respectively. As the important indicators for thermal and energy efficiencies, GOR and SEC were calculated by using Eqs 28, 29. On the baseline condition, GOR reached 0.14 while SEC reached 1335 kW/m3, which are compared further under the different operating conditions.
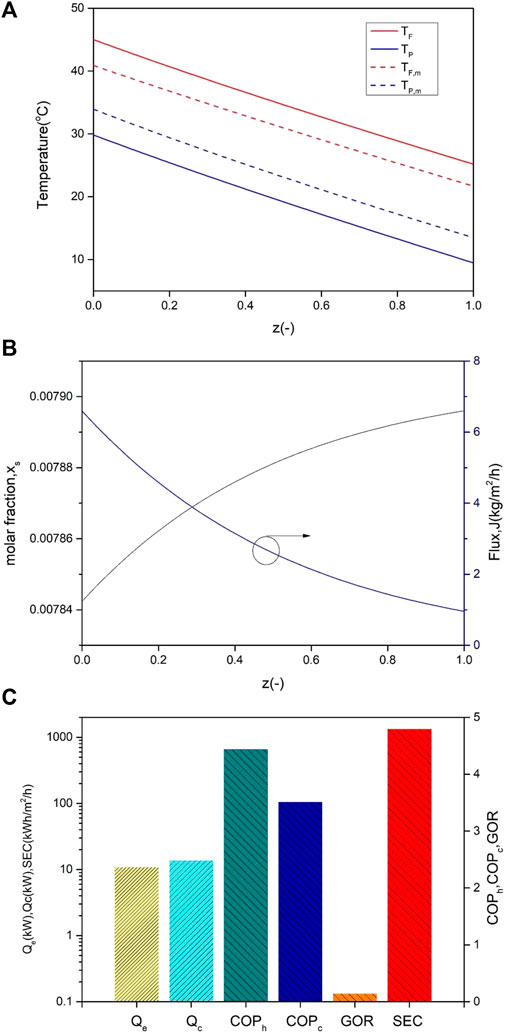
FIGURE 4. Simulation results of HP-DCMD on baseline condition (TF,in = 45°C,Tp,in = 10°C, VF,in = 10 lpm, VP,in = 10 lpm, and rpm = 2000): (A) temperature variations as a function of normalized module length, (B) molar fraction of non-volatile component and the local permeate flux, and (C) performance indices of HP-DCMD.
Figure 5 shows the effects of the mass flow rate of the feed-water stream on (a) temperatures of the evaporator, condenser, feed water, and permeate, (b) COPh and COPc, and (c) GOR and SEC. During the simulation, the compressor speed was kept at 2000 rpm. It was also assumed that the permeate enters the evaporator at 25°C as the temperature of the permeate tank is maintained at 25°C. As shown in Figure 5A, it is easily observed that the temperature increases as the mass flow rate of the feed-water stream varies from 6 to 20 lpm. The inlet feed-water temperature reaches a maximum of 66.6°C when the mass flow rate is 20 lpm, which is 2.7 times higher than that of the mass flow rate at 6 lpm. It can also be observed that both COPh and COPc decrease with increasing the mass flow rate of the feed-water stream. This is mainly attributed to the increased power consumption of the compressor in order to increase the temperature. It is also observed from Figure 5C that SEC drops rapidly until VF reaches 11 lpm, and then it decreases slowly. However, it is found that GOR increases linearly with an increase in the mass flow rate of the feed water.
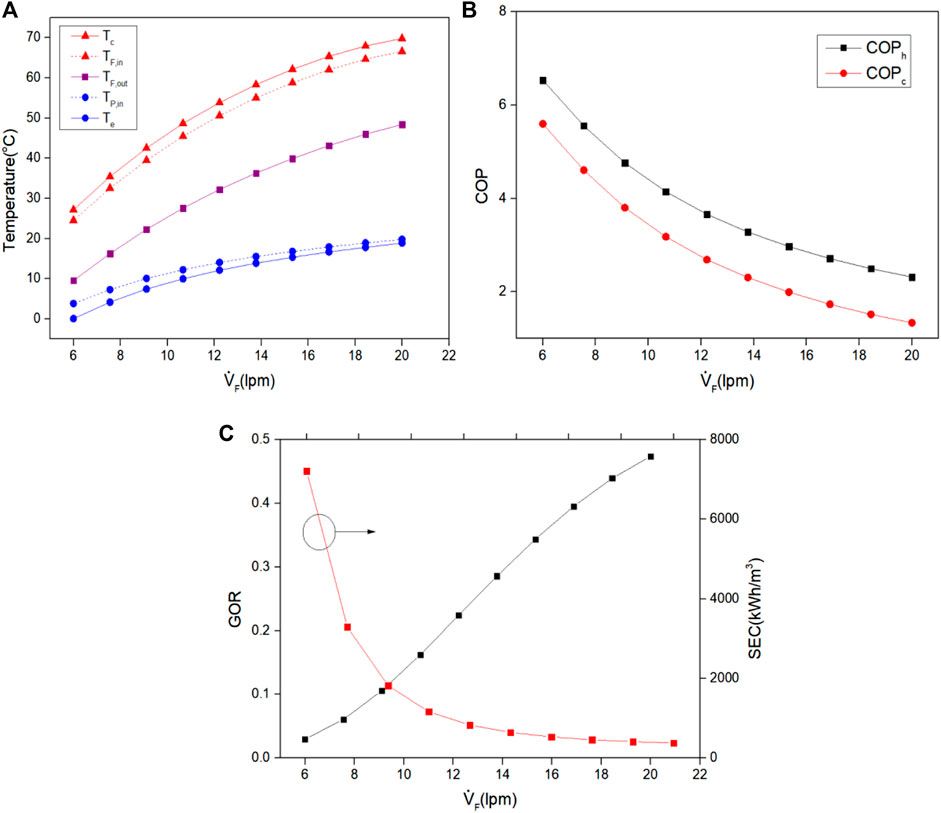
FIGURE 5. Effects of mass flow rate of feed water stream on (A) temperatures of the evaporator, condenser, feed water, and permeate, (B) COPh and COPc, and (C) GOR and SEC.
Figure 6 illustrates the effects of the mass flow rate of the permeate stream on the performance of HP-DCMD. It is easily observed that the temperatures, COP, GOR, and SEC exhibit opposite trends to the previous results depicted in Figure 5. It can be observed that the condenser temperature decreases gradually from 66.8°C to 25.3°C as the mass flow rate of the permeate (
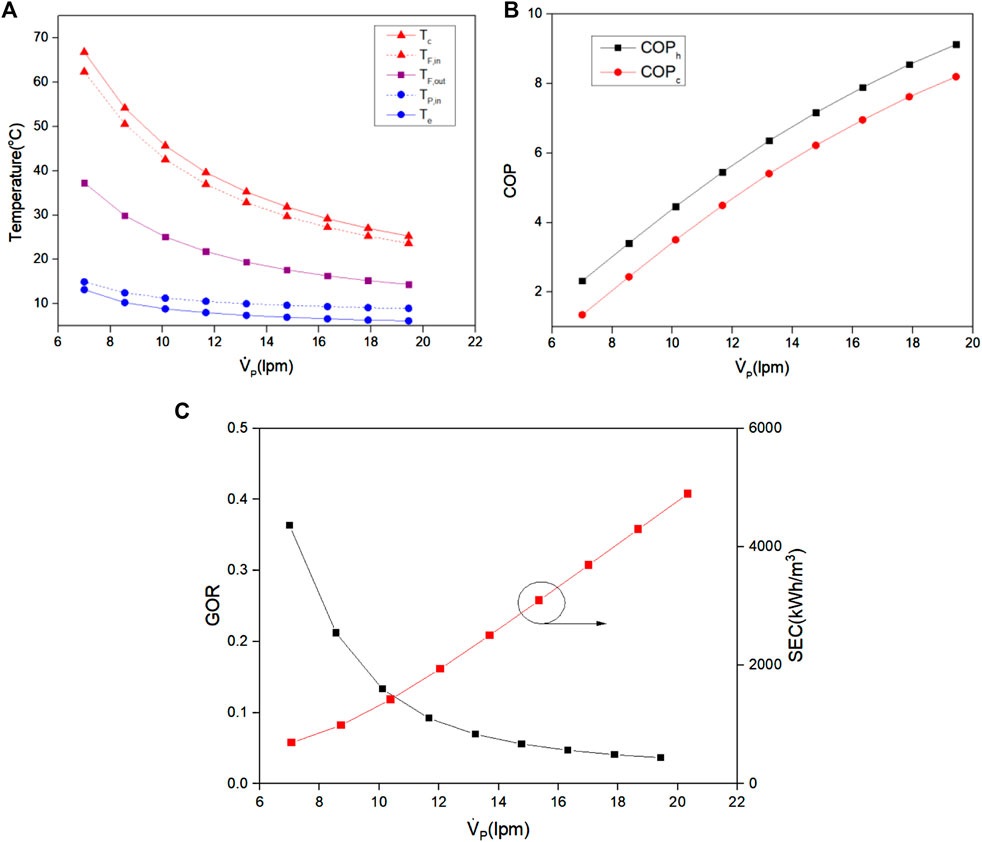
FIGURE 6. Effects of mass flow rate of permeate stream on (A) temperatures of the evaporator, condenser, feed water, and permeate, (B) COPh and COPc, and (C) GOR and SEC.
The effects of the inlet temperature of the evaporator and the inlet temperature of DCMD on the performance of HP-DCMD were investigated numerically, and the results are illustrated in Figures 7, 8. During the simulation, other variables were kept at the baseline conditions except that the compressor speed was changed according to the heating and cooling load variation. The temperature of the permeate that enters the evaporator varies from 25°C to 30°C, while the temperature of the feed water at the inlet of DCMD varies from 35°C to 65°C. As shown in Figure 7A, the maximum COPh of 4.4 was observed at TF,in of 45°C and Te,in of 25°C. The lowest COPh of 2.5°C was observed at TF,in of 35°C and Te,in of 30°C. On the other hand, the maximum COPc of 3.7 was reached at TF,in of 38°C and Te,in of 25°C, and the minimum COPc was observed at TF,in of 65°C and Te,in of 25°C.
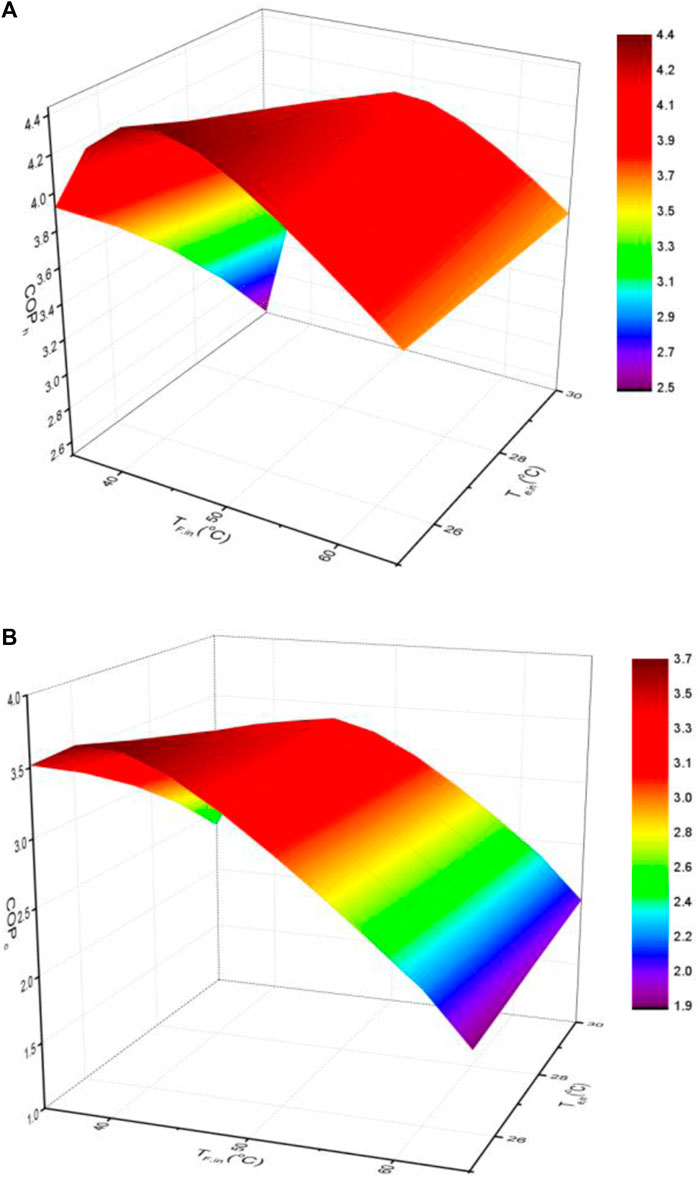
FIGURE 7. Effects of permeate temperature at the inlet of the evaporator and feed water temperature at the inlet of DCMD on COPh (A) and COPc (B).
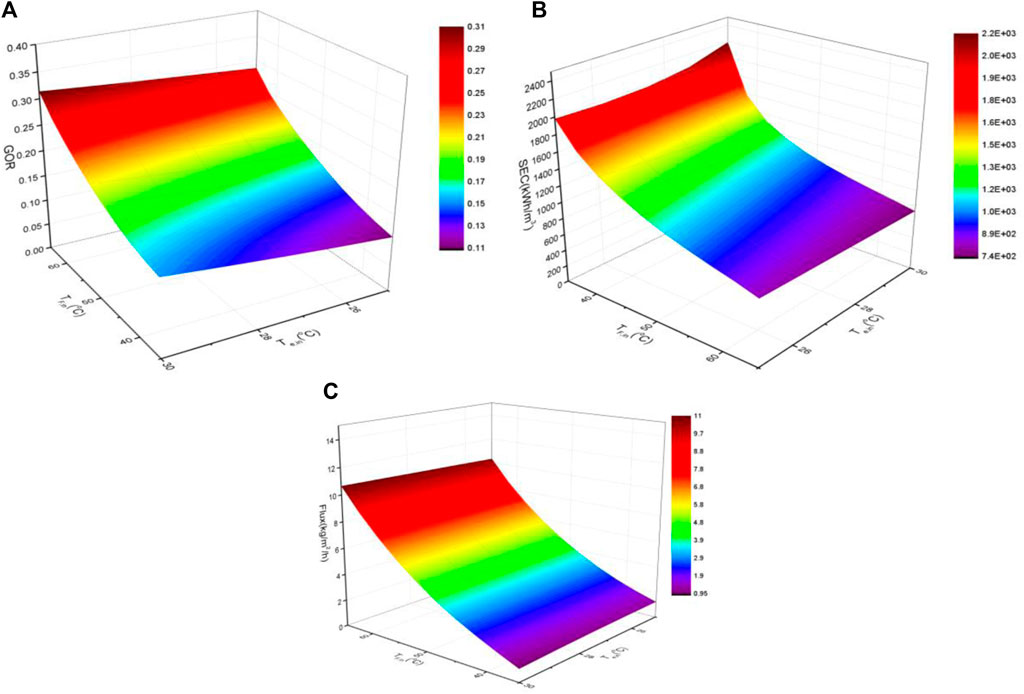
FIGURE 8. Effects of permeate temperature at the inlet of the evaporator and feed water temperature at the inlet of DCMD on GOR (A), SEC(B), and flux (C).
Figure 8 shows the effects of permeate temperature at the inlet of the evaporator and feed water temperature at the inlet of DCMD on GOR (a), SEC (b), and flux (c). As illustrated in Figure 8A, it can be seen that the higher the temperature, the higher the GOR. The maximum GOR of 0.31 was observed at TF,in of 65°C and Te,in of 30°C, and the minimum GOR of 0.1 was observed at TF,in of 35°C and Te,in of 25°C. As shown in Figure 8B, the minimum SEC was also achieved at TF,in of 65°C and Te, at 30°C. This is mainly attributed to the fact that the permeate flux increases exponentially as the temperature of the feed water increases.
5 Conclusion
In this study, a mathematical model has been established in order to investigate the performance of a heat pump-driven hollow-fiber direct contact distillation system under various operating conditions. Both simulation results and the experimental data obtained from references showed good agreement. The key findings from this study include the following:
1) Under the baseline operating conditions, TF and TF,m decrease along the module length, whereas TP and TP,m increase linearly by the heat of condensation and the heat transfer through the membrane. The local permeate flux decreases along the module length, while the molar fraction of the non-volatile component increases due to heat loss. As the important indicators for thermal and energy efficiencies, COPh, COPc, GOR, and SEC were reached at 4.5, 3.5, 0.14, and 1335 kW/m3, respectively.
2) It can be found that all the temperatures increased as the mass flow rate of the feed-water stream varied from 6 to 20 lpm. Both COPh and COPc decrease with increasing the mass flow rate of the feed-water stream due to higher energy consumption by the compressor. SEC drops rapidly until the mass flow rate of the feed water reaches 11 lpm, and then it decreases slowly, while GOR increases linearly with increasing the mass flow rate of the feed water.
3) It was also found that the condenser temperature decreases gradually from 66.8°C to 25.3°C as the mass flow rate of the permeate varies from 7 to 20 lpm. The evaporator temperature also decreases from 13.2°C to 6°C accordingly. COPh and COPc improved significantly. However, GOR decreasesrapidly by 10 times, and SEC increases by seven times, although both COPs are higher at a higher mass flow rate of the permeate.
4) The performance was also investigated by changing the inlet feed water temperature to DCMD and the inlet permeate temperature to the evaporator. The maximum COPh of 4.4 was observed at TF,in of 45°C and Te,in of 25°C, while the maximum COPc of 3.7 was reached at TF,in of 38°C and Te,in of 25°C. In addition, the maximum GOR of 0.31 was observed at TF,in of 65°C and Te,in of 30°C, while the minimum SEC of was also achieved at TF,in of 65°C and Te at 30°C.
It is also expected that the proposed hybrid system will be evaluated further in the future in order to incorporate photovoltaic systems that are able to supply electricity for the heat pump. Although this study only covers theoretical analyses based on thermodynamics modeling, the results can be effectively utilized to design a renewable energy-powered desalination system. An experimental study will be conducted in our future research in order to enable a more in-depth understanding of the solar-powered desalination system.
Data availability statement
The original contributions presented in the study are included in the article/Supplementary Material; further inquiries can be directed to the corresponding author.
Author contributions
SO: writing and funding YK: conceptualization and validation YH: data analysis and visualization.JK: data analysis BK: collection of data
Acknowledgments
This work was supported by the Renewable Surplus Sector Coupling Technology Program of the Korea Institute of Energy Technology Evaluation and Planning (KETEP) granted financial resources from the Ministry of Trade, Industry, and Energy, Republic of Korea (No. 20226210100050) and supported by Korea Institute of Planning and Evaluation for Technology in Food and Planning (IPET) funded by Ministry of Agriculture, Food and Rural Affairs (MAFRA) (No 320048-3).
Conflict of interest
JK was employed by INTERTECH Co, Ltd; BK was employed by the Jeju Energy Corporation.
The remaining authors declare that the research was conducted in the absence of any commercial or financial relationships that could be construed as a potential conflict of interest.
The handling editor declared a past collaboration with the author SJO.
Publisher’s note
All claims expressed in this article are solely those of the authors and do not necessarily represent those of their affiliated organizations, or those of the publisher, the editors, and the reviewers. Any product that may be evaluated in this article, or claim that may be made by its manufacturer, is not guaranteed or endorsed by the publisher.
Abbreviations
DCMD, Direct contact membrane distillation: SEC, Specific energy consumption kWh/m3: COP, Coefficient of performance: GOR, Gained output ratio: HP, Heat pump.
References
Alklaibi, A. M. (2008). The potential of membrane distillation as a stand-alone desalination process. Desalination 223, 375–385. doi:10.1016/j.desal.2007.01.201
Alrowais, R., Qian, C., Burhan, M., Ybyraiymkul, D., Shahzad, M. W., and Ng, K. C. (2020). A greener seawater desalination method by direct-contact spray evaporation and condensation (DCSEC): Experiments. Appl. Therm. Eng. 179, 115629. doi:10.1016/j.applthermaleng.2020.115629
Banat, F. A., and Simandl, J. (1994). Theoretical and experimental study in membrane distillation. Desalination 95, 39–52. doi:10.1016/0011-9164(94)00005-0
Boi, C., Bandini, S., and Sarti, G. C. (2005). Pollutants removal from wastewaters through membrane distillation. Desalination 183, 383–394. doi:10.1016/j.desal.2005.03.041
Chai, T., and Draxler, R. R. (2014). Root mean square error (RMSE) or mean absolute error (MAE)? – arguments against avoiding RMSE in the literature. Geosci. Model Dev. 7, 1247–1250. doi:10.5194/gmd-7-1247-2014
Chen, Q., Alrowais, R., Burhan, M., Ybyraiymkul, D., Shahzad, M. W., Li, Y., et al. (2020a). A self-sustainable solar desalination system using direct spray technology. Energy 205, 118037. doi:10.1016/j.energy.2020.118037
Chen, Q., Burhan, M., Shahzad, M. W., Ybyraiymkul, D., Akhtar, F. H., Li, Y., et al. (2021). A zero liquid discharge system integrating multi-effect distillation and evaporative crystallization for desalination brine treatment. Desalination 502, 114928. doi:10.1016/j.desal.2020.114928
Chen, Q., Muhammad, B., Akhtar, F. H., Ybyraiymkul, D., Muhammad, W. S., Li, Y., et al. (2020b). Thermo-economic analysis and optimization of a vacuum multi-effect membrane distillation system. Desalination 483, 114413. doi:10.1016/j.desal.2020.114413
Cheng, L. H., Wu, P. C., and Chen, J. H. (2008). Modeling and optimization of hollow fiber DCMD module for desalination. J. Membr. Sci. 318, 154–166. doi:10.1016/j.memsci.2008.02.065
Chernyshov, M. N., Meindersma, G. W., and De Haan, A. B. (2005). Comparison of spacers for temperature polarization reduction in air gap membrane distillation. Desalination 183, 363–374. doi:10.1016/j.desal.2005.04.029
Chouikh, R., Bouguecha, S., and Dhahbi, M. (2005). Modelling of a modified air gap distillation membrane for the desalination of seawater. Desalination 181, 257–265. doi:10.1016/j.desal.2005.04.006
Ding, Z., Ma, R., and Fane, A. G. (2003). A new model for mass transfer in direct contact membrane distillation. Desalination 151, 217–227. doi:10.1016/s0011-9164(02)01014-7
Gryta, M. (2007). Effect of iron oxides scaling on the MD process performance. Desalination 216, 88–102. doi:10.1016/j.desal.2007.01.002
Hsu, S. T., Cheng, K. T., and Chiou, J. S. (2002). Seawater desalination by direct contact membrane distillation. Desalination 143, 279–287. doi:10.1016/s0011-9164(02)00266-7
Jamil, M. A., Goraya, T. S., Ng, K. C., Zubair, S. M., Xu, B. B., and Shahzad, M. W. (2021). Optimizing the energy recovery section in thermal desalination systems for improved thermodynamic, economic, and environmental performance. Int. Commun. Heat Mass Transf. 124, 105244. doi:10.1016/j.icheatmasstransfer.2021.105244
Khayet, M., Cojocaru, C., and Garcia-Payo, C. (2007). Application of response surface methodology and experimental design in direct contact membrane distillation. Ind. Eng. Chem. Res. 46, 5673–5685. doi:10.1021/ie070446p
Kim, Y.-D., Thu, K., Ghaffour, N., and Choon Ng, K. (2013). Performance investigation of a solar-assisted direct contact membrane distillation system. J. Membr. Sci. 427, 345–364. doi:10.1016/j.memsci.2012.10.008
Lee, J.-G., Kim, W.-S., Choi, J.-S., Ghaffour, N., and Kim, Y.-D. (2018). Dynamic solar-powered multi-stage direct contact membrane distillation system: Concept design, modeling and simulation. Desalination 435, 278–292. doi:10.1016/j.desal.2017.04.008
Lee, J.-G., Kim, Y.-D., Kim, W.-S., Francis, L., Amy, G., and Ghaffour, N. (2015). Performance modeling of direct contact membrane distillation (DCMD) seawater desalination process using a commercial composite membrane. J. Membr. Sci. 478, 85–95. doi:10.1016/j.memsci.2014.12.053
Meindersma, G. W., Guijt, C. M., and De Haan, A. B. (2006). Desalination and water recycling by air gap membrane distillation. Desalination 187, 291–301. doi:10.1016/j.desal.2005.04.088
Ng, K. C., Burhan, M., Chen, Q., Ybyraiymkul, D., Akhtar, F. H., Kumja, M., et al. (2021). A thermodynamic platform for evaluating the energy efficiency of combined power generation and desalination plants. npj Clean. Water 4, 25. doi:10.1038/s41545-021-00114-5
Peng, P., Lan, Y., Liang, L., and Jia, K. (2021). Membranes for bioethanol production by pervaporation. Biotechnol. Biofuels 14, 10. doi:10.1186/s13068-020-01857-y
Qtaishat, M., Matsuura, T., Kruczek, B., and Khayet, M. (2008). Heat and mass transfer analysis in direct contact membrane distillation. Desalination 219, 272–292. doi:10.1016/j.desal.2007.05.019
Schofield, R., Fane, A. G., and Fell, C. J. D. (1987). Heat and mass transfer in membrane distillation. J. Membr. Sci. 33, 299–313. doi:10.1016/S0376-7388(00)80287-2
Shahzad, M. W., Burhan, M., Ang, L., and Ng, K. C. (2017). Energy-water-environment nexus underpinning future desalination sustainability. Desalination 413, 52–64. doi:10.1016/j.desal.2017.03.009
Underwood, C. P. (2015). Fuzzy multivariable control of domestic heat pumps. Appl. Therm. Eng. 90, 957–969. doi:10.1016/j.applthermaleng.2015.07.068
Wirth, D., and Cabassud, C. (2002). Water desalination using membrane distillation: Comparison between inside/out and outside/in permeation. Desalination 147, 139–145. doi:10.1016/s0011-9164(02)00601-x
Yun, Y. B., Ma, R. Y., Zhang, W. Z., Fane, A. G., and Li, J. D. (2006). Direct contact membrane distillation mechanism for high concentration NaCl solutions. Desalination 188, 251–262. doi:10.1016/j.desal.2005.04.123
Nomenclature
C Membrane distillation coefficient (kg/m2/s/Pa)
CK Individual contribution of Knudsen diffusion to MD coefficient
CD Individual contribution of molecular diffusion to MD coefficient (1/m)
CP Individual contribution of Poiseuille flow to MD coefficient (m)
UA Heat transfer coefficient of a heat exchanger (W/K)
Vdis Compressor displacement (m3/rev)
n0 Nominal compressor rotational speed (rpm)
Qe,0 Nominal heating capacity (kW)
RK Correlation form of Knudsen diffusion
RM Correlation form of Molecular diffusion
RP Correlation form of Poiseuille flow
D Diffusion coefficient (m/s)
T Temperature (K)
Pp Partial pressure (Pa)
J Permeate flux (kg/m2/hr)
x Molar fraction
h Convective heat transfer coefficient (kW/m2/K)
d Diameter (m)
u Velocity (m/s)
ρ Density (kg/m3)
δ Thickness of the membrane (m)
cp Specific heat capacity (kJ/kg/K)
Nf Number of fibers
Qm Heat transfer rate through the membrane (kW)
Hv Latent heat of vaporization (kJ/kg)
Mw Molar mass of water (kg/kmol)
R Ideal gas constant (kJ/kmol/K)
Keywords: heat pump, membrane distillation, hollow fiber, specific energy consumption, gained output ratio
Citation: Oh SJ, Kim Y, Hong Y, Kim JW and Kang B (2022) Numerical Study on the performance of a heat pump-driven-DCMD for sustainable desalination. Front. Energy Res. 10:1053219. doi: 10.3389/fenrg.2022.1053219
Received: 25 September 2022; Accepted: 19 October 2022;
Published: 08 November 2022.
Edited by:
Qian Chen, Tsinghua University, ChinaReviewed by:
Muhammad Wakil Shahzad, Northumbria University, United KingdomM. Kum Ja, King Abdullah University of Science and Technology, Saudi Arabia
Copyright © 2022 Oh, Kim, Hong, Kim and Kang. This is an open-access article distributed under the terms of the Creative Commons Attribution License (CC BY). The use, distribution or reproduction in other forums is permitted, provided the original author(s) and the copyright owner(s) are credited and that the original publication in this journal is cited, in accordance with accepted academic practice. No use, distribution or reproduction is permitted which does not comply with these terms.
*Correspondence: Seung Jin Oh, b2hzODY4MEBraXRlY2gucmUua3I=