 Junyu Hou
 Zhi Yuan*
- Engineering Research Center of Renewable Energy Generation and Grid-Connected Control, Ministry of Education, Xinjiang University, Urumqi, China
In the context of Chinese efforts to achieve the goal of “carbon peaking and carbon neutrality” for the “Three North” area heating season, thermal power units, due to their unique operation mode of “fixing electricity by heat” and the resulting problem of insufficient wind power consumption by the night system, were proposed as an optimization method for wind power consumption based on thermal storage tanks in the context of stepped carbon trading. The optimization method is applied to thermal power plants and considers the constraints of cogeneration unit thermoelectric coupling, electrical power balance, and thermal power balance. Taking the lowest total cost of thermal power plants as the objective function, the Cplex solver in Matlab is used to solve the objective function. The wind power consumption by the system, the CO2 emissions of thermal power plants, and the economy of the system are analyzed in different scenarios. The calculation example results show that the model proposed in this article not only improves the wind power consumption rate of the system and reduces the CO2 emission of the thermal power plant but also improves the economy.
1 Introduction
In recent years, the installed capacity of wind power in Northwest China, North China, and Northeast China has gradually increased. According to “China’s “14th Five-Year” Electric Power Development Planning Research,” it is expected that the national electricity consumption will reach 141 trillion KWh in 2050, the total power generation will be 14.3 trillion KWh, and the total installed capacity will be 6.01 billion KW. Among them, the installed capacity of wind power is 1.967 billion KW, and the power generation is 4.36 trillion KW, accounting for 30.5% of the country’s total power generation, and it is the largest power source in China (Sun. et al., 2017; Zhu et al., 2021). While the state strongly supports the development of wind power, the problem of wind power consumption by the system also needs to be solved urgently.
The heating demand of the Chinese “Three North Regions” in the heating season is mainly met by Combined Heat and Power (CHP), but due to its unique operation mode of “setting electricity by heat,” the space for wind power to be connected to the Internet in the heating season is limited. This greatly limits the consumption of wind power, and the thermal power unit will generate a large amount of CO2 in the process of operation (Zhou et al., 2020), which is not conducive to the realization of the goal of “carbon peaking and carbon neutrality” in China. In order to improve the on-grid rate of wind power in the power system, it is necessary to perform a thermo-decoupling operation on the CHP to reduce the forced output of the unit. Existing decoupling operation methods include using heat pumps (Kim Yu et al., 2022; Mohamed et al., 2022), electric boilers (Yang. et al., 2020; Li et al., 2021), etc., to heat electricity, using heat storage tanks for heat compensation (Sinha et al., 2019; Song et al., 2021) or building heat. Inertia (Picallo-Perez et al., 2021) improves the flexibility of CHP heating. Among them, the use of heat storage tanks to compensate for heat supply can not only increase the wind power grid space but also has a good coal-saving effect and low investment cost, which is one of the ideal measures to solve the wind power consumption in the heating season (Lv et al., 2015). In Western countries such as Denmark, the coordinated operation of heat storage tanks and thermal power units has become an important measure to increase the grid connection of wind power and other renewable energy (Lund and Mathiesen, 2009).
At present, many scholars at home and abroad have carried out research on the installation of heat storage tanks in thermal power plants to improve wind power consumption. Lv et al. (2015) compared the three wind power consumption schemes of pumped water storage, wind power heating, and heat storage tanks and concluded that the heat storage scheme of a thermal storage tank has better economy. The impact of heat storage capacity on wind power consumption is studied, but the analysis is not comprehensive enough (Lv et al., 2015). Cao et al. (2021) proposed an evaluation method for the wind power consumption capacity of a thermal power plant heat storage scheme, considering the actual situation of a thermal power plant operation (Cao et al., 2021). Cui et al. (2021) studied the regulation characteristics of electric thermal combined energy storage to realize the transfer of heat energy in the time scale, thereby promoting the system’s absorption of wind power. However, the impact of the construction cost and operation cost of the heat storage tank on the system economy is not considered (Cui et al., 2021). Ge et al. (2019) analyzed the utilization of wind power under different heat load levels and the wind power consumption effect of the thermal power plant heat storage tank under an optimal control strategy but did not consider the influence of the heat storage tank capacity on the wind power consumption, nor did they consider the system and he impact of fuel and other costs on system economics (Ge et al., 2019). The above studies did not consider the carbon transaction cost of the system, resulting in units with low carbon emissions not giving priority to the system, and the system carbon’s emissions were not alleviated.
To sum up, against the background of the Chinese striving to achieve the goal of “carbon peaking and carbon neutrality,” it is very necessary to conduct optimization research on thermal storage tanks in thermal power plants in the context of stepped carbon trading. Therefore, this article optimizes the system with a cogeneration-wind farm-heat storage tank in the context of stepped carbon trading. In order to improve the wind power consumption of the system, reduce the CO2 emissions of the thermal power plant, and improve the economics of the thermal power plant, this article first increases the thermal storage tank by adding the thermal power plant. We cooperate with the CHP unit to supply heat, decouple the CHP unit’s “heat-based electricity” operation mode, and increase the space for the system to receive wind power during the heating period. Second, by introducing the system carbon transaction cost, it is forced to make high-efficiency and low-carbon emissions’ units give priority to output in order to reduce the CO2 emissions of the thermal power plant and the fuel cost of the unit to improve the economics of the thermal power plant.
2 Operating characteristics of each power source and the principle of low-carbon dissipation in heat storage tanks and ladder carbon trading
2.1 Thermal power unit operating characteristics
Extraction type and back pressure type are two different types of thermal power units. Unlike conventional generator sets, the power generation output of thermal generator sets is limited by thermoelectric coupling constraints. There is a coupling relationship between the thermal power and the electric power of the thermoelectric unit, which is called the “electrical-thermal characteristic.” Figures 1, 2 show the operating characteristics of the thermoelectric unit.
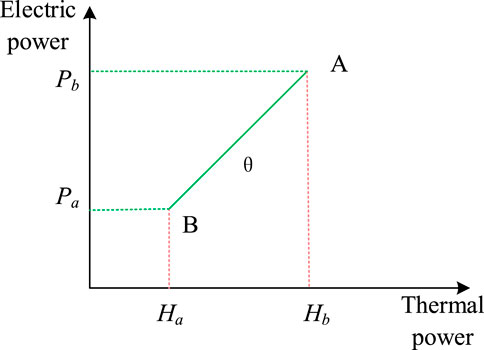
FIGURE 1. Electrothermal characteristics of the back pressure unit.
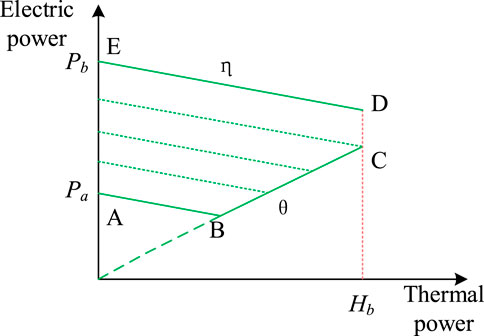
FIGURE 2. Electric and thermal characteristics of the extraction unit.
The heat source for the external heat supply of the back pressure unit is the exhausted steam discharged from the steam turbine, the linear coupling relationship between its power generation and heating power is shown in Figure 1, and its power generation is completely determined by the heating power. Therefore, the relationship between heating power and power generation is as follows (Lu. et al., 2016):
where
The extraction-type unit extracts heat from the two poles of the steam turbine to achieve external heating. If the intake steam volume is constant, the external heating extraction volume will increase, the heating power will continue to increase, but the electrical power will continue to decrease. As shown in Figure 2, in the designated area, the extraction steam unit can adjust its power generation and heating power. The area surrounded by the EDCBA in the figure is the normal working area of the extraction steam unit. Although its power generation has a certain adjustable range, when its heating power continues to increase, the adjustable range of its power generation will decrease accordingly. According to the operating principle of the unit, the relationship between power generation, heat, and net power generation in pure condensing conditions is:
where
Its electrothermal characteristics are expressed as follows:
where
2.2 Wind power output model
Wind turbine model the output power
where
2.3 Principle of heat storage tanks to absorb wind power
From the operating characteristics of the thermoelectric unit, it can be seen that there is a coupling relationship between the thermal output and the electrical output of the unit. The adjustment range of CHP power generation is limited by its thermal output. Under constant heating power, its heat output will limit the adjustment range of its power generation accordingly. Therefore, when the wind power output is high at night and the heat load demand is large, the forced output of the thermal power unit will be too high, and the system cannot provide sufficient wind power grid space. For this reason, if a thermal power plant is equipped with a heat storage tank, in the nonwind power consumption period, the thermal power unit will also store heat in the heat storage tank while meeting the heat load, and during the wind power consumption period, the output of the thermal power unit will be reduced to supply heat. The insufficient part is supplemented by the heat stored in the heat storage tank (Zhang et al., 2022) so that the system can absorb more wind power.
2.4 Integrated thermal power plant system model
Figure 3 is a system structure diagram of an integrated thermal power plant, including a heat storage device, a thermal power unit, a conventional unit, and a wind turbine. The integrated thermal power plant combines thermal power, wind power, and heat storage tank systems, which can realize thermo-decoupling. During the nonconsumption wind power period, when the electricity load is high, the output of the thermal power unit is increased, and the excess heat is stored by the heat storage device; at night, when the load in use is reduced and the wind power output is high, the output of the thermal power unit is reduced to reduce This increases the wind power consumption of the system. In the context of the country’s efforts to achieve the goal of “carbon peaking and carbon neutrality,” the introduction of a carbon trading mechanism into the system can further improve the system’s wind power consumption capacity and reduce the system’s CO2 emissions.
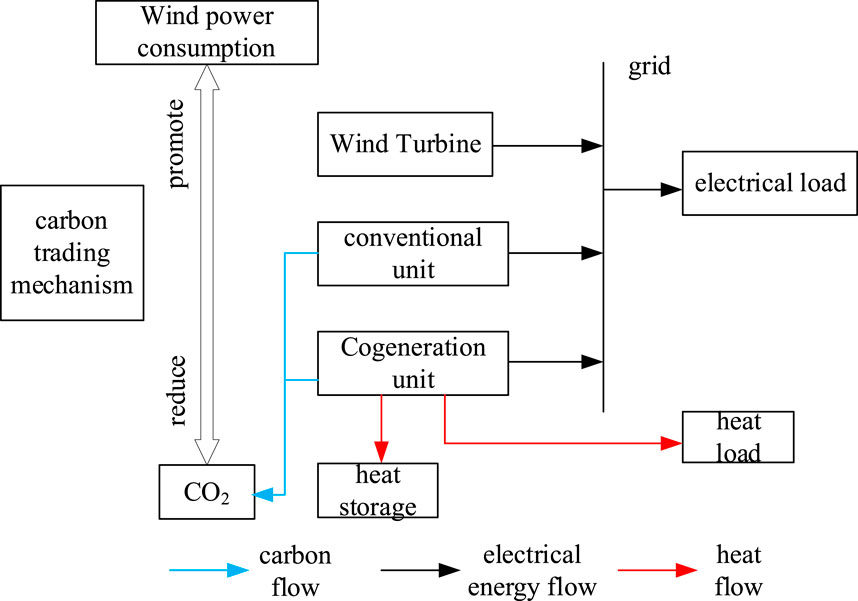
FIGURE 3. System model.
2.5 Step-by-step carbon trading mechanism
In the Chinese power industry, the baseline method is mainly used to determine the carbon emission quota of the system (Liu et al., 2021). For the integrated thermal power plant aiming at increasing the wind power consumption rate, the carbon emission source is the thermal power unit. In order to simplify the model, it is assumed that the carbon emissions of thermal power units are proportional to the output, and based on the initial allocation, when the actual carbon emissions exceed the initial allocation, the excess amount will be purchased at a step-by-step price.
where
The following formula represents the carbon emission allowance of the device:
where
According to the relationship between the actual carbon emissions and the carbon quota allocated free of charge, the step-by-step trading mechanism established in this article is shown in Figure 4. The abscissa is the proportion of the actual carbon emissions exceeding the carbon quota allocated free of charge, and the higher the proportion, the higher the carbon trading price is.

FIGURE 4. Schematic diagram of stepped carbon trading.
We formulate the carbon trading price system according to the stepped carbon trading mechanism. When the actual carbon emission of the system exceeds/falls below the initial allocation, the step-by-step price purchase/sale is implemented for the excess carbon emission quota. The specific expression is as follows (Cui. et al., 2018)
The carbon trading cost is:
2.6 Analysis of carbon reduction mechanism using carbon trading policies
The carbon trading mechanism is that the power industry uses the market adjustment method to promote the low-carbon emission units to give priority to the system; the high-carbon emission units actively reduce CO2 emissions, which is equivalent to improving the online space of wind power, which in turn is conducive to the development of low-carbon power. Figure 5 is a cost diagram of the thermal power unit. It can be seen that if the carbon trading mechanism is not introduced, units 3 and 4 will give priority to output due to the low unit cost of thermal power, and the CO2 emission of unit 3 is much higher than that of unit 4. But because there is no carbon trading cost limit, the units will be three CO2 emissions and persist for a long time, hindering the development of low-carbon operation of the power system. If the carbon trading mechanism is introduced, the units with high CO2 emissions will need to bear higher carbon trading costs, while the units with low CO2 emissions will only need to bear lower carbon trading costs, making the total unit power generation cost of unit 3 higher. For unit 2, at this time, units 4 and 2 with low CO2 emissions and good performance give priority to the output so as to promote the system to reduce carbon emissions.
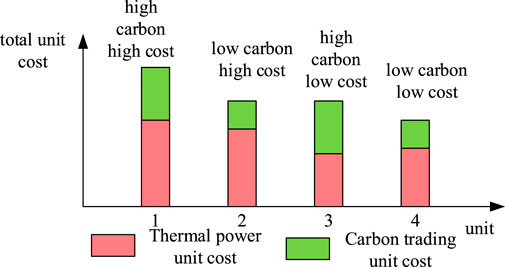
FIGURE 5. Cost analysis diagram of the thermal power plant.
3 Optimal allocation model of thermal power plant heat storage considering carbon trading
3.1 Overall objective function considering heat storage tank cost
Taking the lowest total cost of thermal power plants in a daily dispatch period as the objective function, including the fuel cost of conventional units and thermal power units, the daily converted total cost of heat storage tanks and the carbon transaction cost of thermal power plants, the objective function is:
where
3.1.1 Fuel cost of the unit
The fuel cost of a conventional generator set can be expressed by the quadratic equation of the generated power (Wang et al., 2022):
where
The heat source for the external heating of the back pressure unit is the exhausted steam discharged from the steam turbine, and the heating cost can be considered zero. Therefore, its fuel cost is the same as Eq. 9.
The fuel cost of an exhausted thermal power unit is:
where
3.1.2 Cost of heat storage tank
When optimizing the capacity of the heat storage tank, the cost of the heat storage tank will have a certain impact on the overall operating economy of the integrated thermal power plant and the selection of the heat storage tank capacity. Therefore, the related costs of the heat storage tank must be fully considered.
The initial investment, construction, operation, and maintenance costs make up the total cost of the heat storage tank. The cost of materials, installation, and land occupation is the investment cost of all aspects of the heat storage tank. For the specific analysis and calculation, please refer to the existing engineering (Yang et al., 2022).
where
3.1.3 Carbon trading cost
This part refers to formula (7) and will not be repeated here.
3.2 Restrictions
3.2.1 Energy balance constraints
where
3.2.2 Unit operation constraints
Generator set output size and climbing constraints.
where
Electric output operation constraints of exhausted thermal power units.
where
Thermal Output Operation Constraint of Exhaust-Type Thermal Power Units.
where
3.2.3 Wind power output constraints
where
3.2.4 Operation constraints of heat storage tanks
The heat storage and heat release rate constraints of the heat storage tank are:
where
4 Case simulation
4.1 Case data
This article takes the heating season in a certain area of the country’s “Three Norths” as an example for simulation analysis. This area includes two exhausted heat-generating units, two conventional units, two back pressure heat-generating units, and a wind power plant with an installed capacity of 300 MW. The installed capacity ratio of 2000 is in line with the actual situation of the country’s “Three North” regions, and the heat load of the system in the heating season is almost constant. It is assumed that it is 1.5 × 10³MW, the dispatching unit time is 1 h, and the dispatching period T is 24 h.
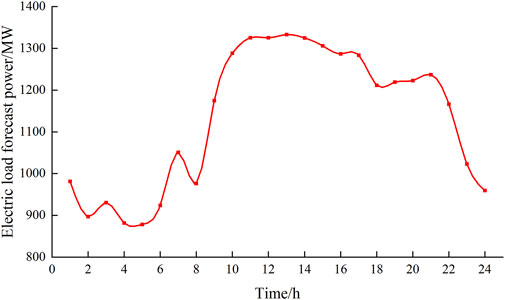
FIGURE 6. Electric load prediction power.
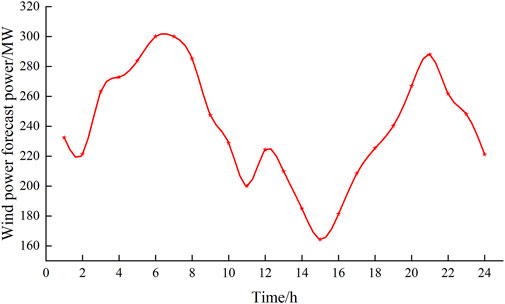
FIGURE 7. Predicted wind power.
In order to verify the effectiveness of the heat storage tank in improving the ability of the system to absorb wind power, reduce the CO2 emission of the system, and improve the economy against the background of carbon trading, the operation results under different operating scenarios are analyzed and compared, of which Scenario 1 is the optimization proposed in this article. Method: The scenarios are as follows: 1) Scenario 1: Installing heat storage tanks to test the traditional carbon transaction cost, 2) Scenario 2: Installing the heat storage tank without considering the system carbon transaction cost, and 3) Scenario 3: Not installing heat storage tanks and not testing the carbon transaction cost of the system.
4.2 Simulation analysis
Under the constraints of satisfying the objective function and electric power balance, there will be the output of each unit as shown in Figure 8. Since this article mainly studies the wind power consumption of the system, only the output of the wind power to the system will be separately exemplified, that is, the wind power of the system. Consumption situation: According to the relationship between the carbon transaction cost and the output of each unit, the CO2 emissions of the thermal power plant units can be obtained, and under the action of the carbon transaction cost, the units with high efficiency and low carbon emissions will give priority to output, which can effectively reduce the system’s CO2 emissions. The daily chemical cost of the heat storage tank is determined by its capacity of the heat storage tank. The larger the capacity, the higher the cost, but more wind power is consumed. The total cost of the thermal power plant can then be used to compare the economics of each scenario.
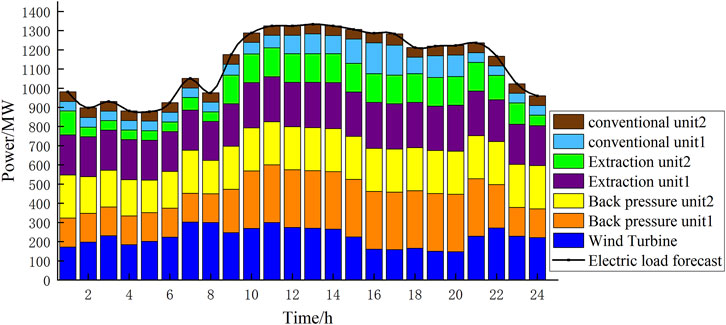
FIGURE 8. Output of each unit.
As can be seen from Figure 9, the carbon transaction cost of Scenario 1 is 36,000 yuan; because Scenario one and Scenario three do not consider the system carbon transaction cost, the carbon transaction cost is 0 yuan. Scenarios 1 and 2 take the same capacity of heat storage tanks; therefore, the daily chemical cost of heat storage tanks in both scenarios is 51,000 yuan. In Scenario 3, because no heat storage tanks are installed, the daily chemical cost of heat storage tanks is 0. The fuel cost of units in Scenarios 1, 2, and 3 is 380.17、428.06、and 487.34 ten thousand yuan, respectively; the assembly is 389.95、433.19、and 487.34 ten thousand yuan, respectively Although the carbon transaction cost of Scenario 1 is higher than that of Scenario 2, the total cost of Scenario 1 is 441,000 yuan less than that of Scenario 2 because Scenario 1 consumes more wind power and reduces the forced output of thermal power units. Therefore, the fuel cost of thermal power units is less than that of Scenario 2. Although Scenario 3 only considers the fuel cost of the unit, the forced output of the unit is too high because there is no heat storage tank to assist the unit in heating, and the wind power consumption is seriously insufficient; therefore, the total cost is higher than that of Scenarios 1 and 2. To sum up, the economy of thermal power plants has improved.
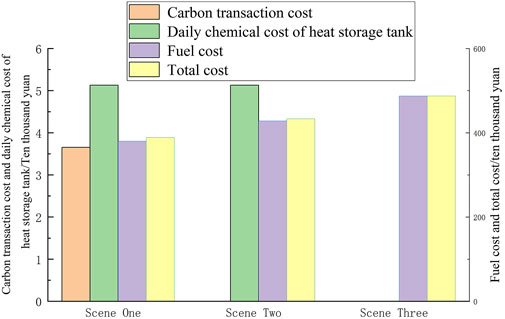
FIGURE 9. Cost comparison of the three scenarios.
As can be seen from Figure 10, the CO2 emission of Scenario 1 is 18,097.76t, the CO2 emission of Scenario 2 is 20,311.48t, and the CO2 emission of Scenario 3 is 24,137.21t. The reason for this is that the first Scenario considers the system carbon transaction cost, forcing low-carbon emission units to give priority to output, reducing system CO2 emissions. On the other hand, wind power is a clean energy source, and the consumption of wind power by the system in Scenario 1 is higher than that in Scenario 2, which reduces the output of the thermal power unit and reduces the generation of CO2.
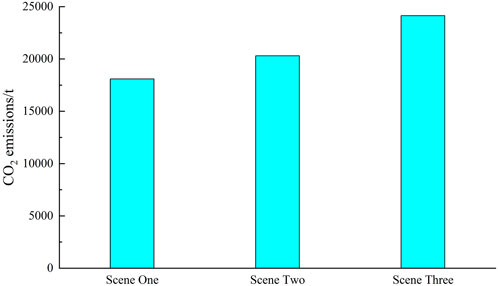
FIGURE 10. Comparison of CO2 emissions.
Figure 11 is a comparison of wind power consumption in three Scenarios under the same heat storage capacity. It can be seen that the consumption of wind power in Scenario 1 is higher than that in Scenarios 2 and 3, and Scenario 2 is higher than Scenario 3, indicating that the heat storage tank can improve the wind power consumption of the system; Scenario 1 is higher than Scenario 2, indicating that carbon trading can also improve the wind power consumption of the system. As can be seen from Figure 11 and Figure 12, from 9:00 a.m. to 22:00 p.m., due to the high electricity load, the system is in the nonwind power consumption period; therefore, the thermal power unit can increase the output, and the excess heat is stored in the heat storage tank. The heat storage tank is in a heat storage state for use at night. From 23:00 p.m. to 8:00 a.m. the next day, the power load of the system is low and the wind power output is too large. At this time, part of the heat load is provided by the heat storage tank, and the other part is provided by the thermal power plant, which effectively reduces the forced output of the unit.
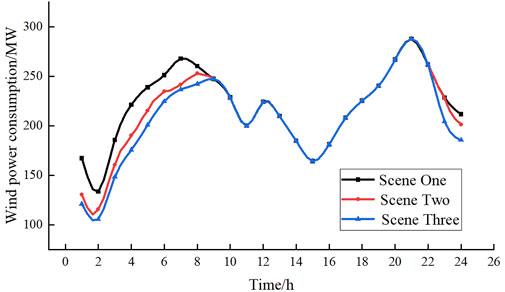
FIGURE 11. Comparison of wind power consumption in three scenarios.
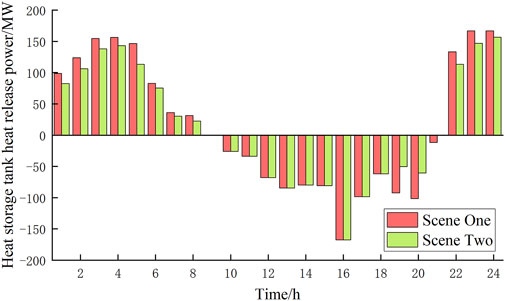
FIGURE 12. Heat storage tank output.
Figures 13, 14 show the comparison of wind power consumption by different heat storage tank capacities in Scenario 1 and Scenario 2, respectively. It can be seen that the larger the capacity of the heat storage tank, the more the system can absorb wind power. In Scenario 1, when the capacity of the heat storage tank is 837.856 MW, the system can completely absorb wind power. The capacity of the heat storage tank to achieve complete consumption of wind power in Scenario 3 is 166.682 MW higher than that of Scenario 1 to achieve complete consumption of wind power. Considering that the larger the capacity of the thermal storage tank, the higher its investment cost and maintenance cost. In practical engineering applications, the optimal heat storage capacity is generally adopted.
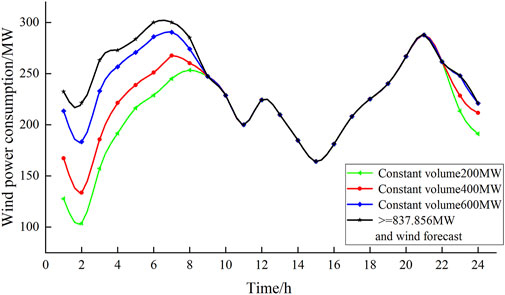
FIGURE 13. Scenario 1 comparison of wind power consumption of different capacities.
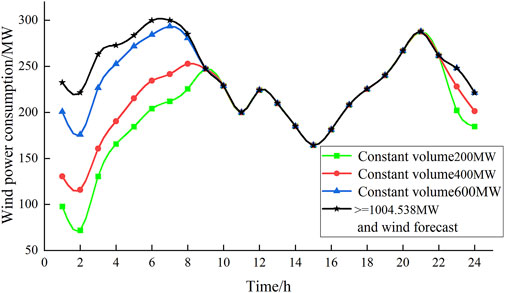
FIGURE 14. Scenario 2 comparison of wind power consumption of different capacities.
In summary, the heat storage tank optimized against the background of stepped carbon trading can not only increase the wind power consumption of the system and reduce the CO2 emission of the thermal power plant but also improve the overall economy of the thermal power plant.
5 Conclusion
In order to effectively reduce the CO2 emissions of thermal power plants and improve the wind power consumption capacity and economy, this article proposes an optimization method for wind power consumption based on thermal storage tanks in the context of stepped carbon trading. The following conclusions are drawn through the simulation analysis of the example.
1) The installation of heat storage tanks in the thermal power plant can achieve a certain degree of decoupling of the thermal power unit’s “heating and electricity” operation mode, improve the operational flexibility of the thermal power unit, and reduce the forced output of the system due to heat supply. Therefore, we must improve the system to accept wind power space, improve the system’s economy, and reduce CO2 emissions of the system.
2) The optimization of the thermal storage tank in the context of carbon trading not only significantly improves the system’s ability to absorb wind power and reduces the CO2 emissions of the thermal power plant but also improves the overall economy of the thermal power plant.
3) The ability of the thermal power plant’s heat storage tank to absorb wind power in the lifting system is related to its heat storage capacity. In actual application, the capacity of the heat storage device should be reasonably configured according to the actual situation, such as the system wind turbine capacity.
The main purpose of this article is to improve the utilization rate of wind power and reduce CO2 emissions of the power industry. By doing so, the forced output of thermoelectric power can be reduced, and the power system can be integrated into the carbon trading system. This could infringe on the power generation interests of traditional power plants, and the plan would be hindered; therefore, the government would need strong support for the reform of the power system.
Data availability statement
The original contributions presented in the study are included in the article/supplementary material, and further inquiries can be directed to the corresponding author.
Author contributions
JH contributed to the model, simulation, and writing. ZY contributed to the method. WW contributed equally to the editing of the article and discussion. SH contributed to the literature analysis and provided a critical review.
Funding
This work is supported by the Open Project Program of Xinjiang Uygur Autonomous Region Key Laboratory (2022D04081) and the National Natural Science Foundation of China (52067020).
Conflict of interest
The authors declare that the research was conducted in the absence of any commercial or financial relationships that could be construed as a potential conflict of interest.
Publisher’s note
All claims expressed in this article are solely those of the authors and do not necessarily represent those of their affiliated organizations, or those of the publisher, the editors, and the reviewers. Any product that may be evaluated in this article, or claim that may be made by its manufacturer, is not guaranteed or endorsed by the publisher.
References
Cao, L., Wei, D., and Dong, E. (2021). Wind abandonment capacity and multi-objective comprehensive evaluation of thermal storage scheme in thermal power plants [J]. J. Sol. Energy 42 (8), 325–333. doi:10.19912/j.0254-0096.tynxb.2018-0832
Cao, R., Zhao, H., and Cao, J. (2020). Numerical study on dynamic characteristics of single-tank heat storage system [J]. J. Northeast Electr. Power Univ. 40 (4), 61–68. doi:10.19718/j.issn.1005-2992.2020-04-0061-08
Cui, Y., Ji, Y., and Zhong, W. (2021). Wind curtailment scheduling method based on combined electric-thermal energy storage [J]. Chin. J. Sol. Energy 42 (12), 192–199. doi:10.19912/j.0254-0096.tynxb.2019-1443
Cui., Y., Yang., Z., and Zhong., W. (2018). Joint dispatching strategy of cogeneration units with heat storage and wind power to reduce sulfur and nitrate emissions [J]. Power Grid Technol. 42 (04), 1063–1070. doi:10.13335/j.1000-3673
Ge, W., Li, J., and Li, J. (2019). Optimal control strategy for large-capacity heat storage system to improve wind power consumption [J]. Chin. J. Sol. Energy 40 (2), 380–386.
Guo., Y., Hu., B., Wan., L., Xie., K., et al. (2015). Short-term optimal economic operation of cogeneration microgrid with heat pump [J]. Power Syst. Autom. 39 (14), 16–22.
Kim Yu, J., Yang, L., Entchev, E., Cho, S., Kang, E. C., and Lee, E. J. (2022). Hybrid Solar Geothermal heat pump System model Demonstration Study. Front. Energy Res. 9. doi:10.3389/fenrg.2021.778501
Li, J., Fu, Y., Li., C., Xing, Z., and Ma, T. (2021). Improving wind power integration by regenerative electric boiler and battery energy storage device. Int. J. Electr. Power & Energy Syst. 131, 107039. doi:10.1016/J.IJEPES.2021.107039
Liu, X., Cheng, X., and Bo, L. (2021). Day-to-day scheduling strategy for solar thermal power stations and wind power systems with heat storage considering source-load coordination [J]. China Electr. Power 54 (8), 144–153. doi:10.11930/j.issn.1004-9649.202004040
Lund, H., and Mathiesen, B. V. (2009). Energy system analysis of 100% renewable energy systems—the case of Denmark in years 2030 and 2050. Energy 34 (5), 524–531. doi:10.1016/j.energy.2008.04.003
Lu., Z., Sui., Y., and Feng., T. (2016). Low-carbon economic dispatch of wind power consumption considering heat storage devices and carbon capture equipment [J]. J. Electrotech. Technol. 31 (17), 41–51. doi:10.19595/j.cnki.1000-6753
Lv, Q., Li, L., and Zhu, Q. (2015). Comparison of coal saving effect and national economy of three wind curtailment schemes [J]. Automation Electr. Power Syst. (7), 75–83. doi:10.7500/AEPS20140125001
Mohamed, G., Marrasso, E., Rosato, A., and Roselli, C. (2022). Editorial: Advanced Hybrid Polygeneration Technologies. Front. Energy Res. 10, 153. doi:10.3389/fenrg.2022.858759
Picallo-Perez, A., Sala-Lizarraga, J. M., Escudero-Revilla, C., Hidalgo-Betanzos, J. M., and Ruiz de Vergara, I. (2021). Thermoeconomic analysis in Advanced cogeneration Systems in buildings. Front. Energy Res. 10, 802971.
Sinha, R., Bak-Jensen, B., Radhakrishna Pillai, J., and Zareipour, H. (2019). Flexibility from electric boiler and thermal Storage for multi energy System Interaction. Energies 13 (1), 98. doi:10.3390/en13010098
Song, J., Zhang, W., and Li, S. (2021). Research on operation strategy of regenerative electric heating load participating in wind power consumption [J]. Power Syst. Prot. Control 49 (03), 80–87. doi:10.19783/j.cnki.pspc.201046
Sun., Y., Ma, X., Xu, J., Bao, Y., and Liao, S. (2017). Efficient utilization of wind power: Long-distance transmission or local consumption? Front. Mech. Eng. 12, 440–455. doi:10.1007/s11465-017-0440-3
Wang, L., Lin, J., and Dong, H. (2022). Optimal scheduling of integrated energy system considering stepped carbon trading [J]. J. Syst. Simul. 34 (07), 1393–1404. doi:10.16182/j.issn1004731x
Yang, Y., Liu, J., Xu, X., Xie, K., Lai, Z., Xue, Y., et al. (2022). Cooperative trading strategy of carbon emitting power generation units participating in carbon and electricity markets. Front. Energy Res. 10, 977509. doi:10.3389/fenrg.2022.977509
Yang., Q., Zhi, C., and Yuan., D. (2020). Low-carbon economic dispatch of wind power consumption based on coordinated heat supply by on-off boilers and heat storage devices [J]. J. Sol. Energy 41 (09), 21–28.
Zhang, X., Zhong, W., and Shi, Y. (2022). Research on the combined operation characteristics and optimization of the dual-extraction heat generating unit and the back-extracting heat generating unit [J/OL]. Chin. J. Electr. Eng. 1–14. [2022-08-23. doi:10.13334/j.0258-8013.pcsee.213101
Zhou, Yunhai, Guo, Shengkai, Xu, Fei, Cui, Dai, Ge, Weichun, Chen, Xiaodong, et al. (2020). Multi-time Scale optimization Scheduling Strategy for combined heat and power System based on Scenario method. Energies (Basel). 13 (7), 1599–1618. doi:10.3390/en13071599
Keywords: heat storage, cogeneration, thermal decoupling, wind power consumption, stepped carbon trading
Citation: Hou J, Yuan Z, Wang W and He S (2023) Optimization method of wind power consumption based on thermal storage tanks against the background of stepped carbon trading. Front. Energy Res. 10:1050641. doi: 10.3389/fenrg.2022.1050641
Received: 22 September 2022; Accepted: 07 November 2022;
Published: 19 January 2023.
Edited by:
Mohamed Mohamed, Umm Al-Qura University, Saudi ArabiaReviewed by:
Pang Xinfu, Shenyang Institute of Engineering, ChinaEugene Chaikovskaya, Odessa National Polytechnic University, Ukraine
Aleksandr Kler, Melentiev Energy Systems Institute (RAS), Russia
Copyright © 2023 Hou, Yuan, Wang and He. This is an open-access article distributed under the terms of the Creative Commons Attribution License (CC BY). The use, distribution or reproduction in other forums is permitted, provided the original author(s) and the copyright owner(s) are credited and that the original publication in this journal is cited, in accordance with accepted academic practice. No use, distribution or reproduction is permitted which does not comply with these terms.
*Correspondence: Zhi Yuan, eXppc3RoZWN1cmVAMTYzLmNvbQ==