 Zihan Zhao1
 Xinrui Liu
- 1College of Information Science and Engineering, Northeastern University, Shenyang, China
- 2State Grid Shandong Electric Power Company Binzhou Power Supply Company, Binzhou, China
While the coupling between various energy systems is deepening as integrated energy develops quickly, security risks in the information network system will be introduced into the physical system, and the interaction between the systems causes the security risks to increase. It is essential to maintain the multi-energy coupling integrated energy system’s safe and reliable operation. Therefore, this paper first constructs the cyber physics system (CPS) model based on the electricity-gas integrated energy system (EGIES), the fault propagation mechanism of the system caused by the cyber attack is analyzed, and the cyber attack scenario simulation method based on the N-n predicted fault set is proposed. Secondly, based on the optimal load shedding model and the reliability assessment index, the reliability assessment method of the electricity-gas integrated system under cyber attack is proposed. Then, on the basis of system reliability assessment, a multi-time scale reliability improvement strategy based on branch power and pipeline flow optimization of EGIES under cyber attack is proposed. Finally, the simulation results of the IEEE57-NGS20 electricity-gas integrated system verified the effectiveness of the proposed method. The proposed optimization strategy reduces the out-of-limit range of power transmission lines and natural gas pipelines, reduces the probability of cascading failure in the system under information attacks, and improves the resistance and energy supply reliability of the system against cyber attacks.
1 Introduction
With the development of the economy and society, the traditional single energy system can no longer meet the needs of the current society. The emergence of EGIES has realized the effective interaction and efficient utilization of electric energy and natural gas. Under the action of gas turbines and P2G units, the Integrated system enables a two-way flow of electricity and natural gas, optimizing the overall structure of energy generation, mitigating environmental pollution, and balancing energy supply and demand (Sun et al., 2016; Yu et al., 2018). However, with the deep coupling and complementarity of energy between subsystems, the fluctuations caused by the internal uncertainties of each system can easily spread to other systems through the coupling link (Li et al., 2019; Wang, 2021). At the same time, the security risks in the information network may also be introduced into the energy physics system. The interaction between the systems increases the risk of the entire EGIES. Therefore, it is very important to deepen the research on the reliability assessment and improvement strategy of the EGIES (Jia et al., 2019; Ding et al., 2021; Ling, 2021).
For the reliability assessment of integrated energy systems at the physical level, reference (Yu et al., 2018) propose a reliability assessment method for EGIES with electricity to gas conversion based on the established energy flow model, load reduction optimization model, and the reliability index. In (Bao, 2021), a general reliability model of EGIES is established to analyze the system fault propagation and its influence on system reliability. Reference (Yang et al., 2021) resorted to a Bayesian network algorithm for time-sequence simulation to analyze and probe into the reliability of the EGIES. A system reliability assessment method combining the Markov process and Monte Carlo was proposed (Ni et al., 2020). In (Chen et al., 2018) proposed a method for system power supply reliability assessment based on the analytical algorithm. A customized multidimensional discrete convolution algorithm was proposed to calculate the reliability model and evaluate the reliability of the multi-energy coupling system from a new perspective (Yan et al., 2021). A reliability assessment method of EGIES based on comprehensive demand response was proposed considering load demand response (Gong et al., 2021). Literature (Ren et al., 2020) puts forward the concept of substitutable load to study the reliability of EGIES. Literature (Yan, 2020) mainly studies the reliability of the power system in the EGIES and analyzes the influence of system environmental disturbance, natural gas system failure, and other factors on the reliability of the power system. In (Zhang et al., 2017), the energy hub model was established, and the particle swarm optimization algorithm was combined with the traditional interior point method to form the reliability evaluation system. In (Li et al., 2022), the difference in transmission speed of different energy sources was considered, and the stochastic Petri net model of the network was constructed to evaluate the energy supply reliability of the EGIES.
At present, the research on the reliability assessment of integrated energy CPS is still in its infancy, and most of the research is on the reliability analysis of electric CPS. Among them, References (Xue et al., 2018; Zhang et al., 2021; Fan et al., 2022) established the integrated energy CPS model based on the modeling idea of electric CPS. In (Liu et al., 2018), a reliability model of information systems considering multiple information failure factors is established, and the influence of information side factors on the reliability of electric CPS is analyzed. Reference (Xu, 2019) established the reliability model of the information layer and physical layer equipment of electric CPS. Literature (Chen et al., 2019) considers the reliability evaluation of power systems under multiple information failure scenarios. Reference (Wang et al., 2019) improved the reliability index system of CPS by adding the entropy reliability index in reliability assessment. In (Guo et al., 2016; Yuan et al., 2019), the reliability model of information failure is established, and the reliability assessment method of the power system based on the information monitoring function is proposed. In (Guo et al., 2019), the Monte Carlo method considering time series is proposed to simulate the state of the electric CPS in the island state, and then the reliability is quantitatively evaluated.
The current research shows that cyber attacks will bring a great risk of cascading failure to the CPS. As long as the cyber attacks are successfully completed, they will definitely affect the system and even lead to serious catastrophic consequences. Therefore, it is necessary to study the reliability of the integrated energy CPS considering cyber attacks (Wang, 2020; Wang et al., 2020; Zheng et al., 2022). This paper primarily examines the reliability assessment of the EGIES taking cyber attacks into account and how to increase the system’s reliability in an effort to address the pressing challenge.
The contributions of this article are summarized as follows: 1) Firstly, the CPS model of EGIES is constructed, and the fault propagation mechanism of the system caused by the cyber attack is analyzed. According to the N-1 criterion, an information attack scenario simulation method based on the N-n expected fault set is proposed. The simulation method can reduce computational difficulty while ensuring that all the cyber attack scenarios of the simulation system are set. 2) The reliability assessment method of EGIES considering cyber attacks is proposed, and the influence of cyber attacks on the reliability of power supply and gas supply of EGIES is quantitatively evaluated, the obtained reliability index lays a foundation for the study of system reliability improvement strategy. 3) An optimization strategy of branch power and pipeline flow of EGIES is proposed for cyber-attack. In view of the situation that the branch power and pipeline flow of each system cannot be optimized uniformly, and considering the slow dynamic characteristics of the natural gas system in actual operation, the optimization objectives are to maximize the safety distance between the branch power of the power system and the pipeline flow of the natural gas system and the limit value, respectively. A bi-level optimization model of branch power and pipeline flow of EGIES considering multi-time scales is established; the optimization model of each layer is solved by improving the particle swarm algorithm, and the effect of the proposed optimization strategy on system reliability under cyber attack is analyzed in detail. The effectiveness of the proposed method is verified by simulation cases.
2 The electricity-gas integrated energy system model under cyber attack
2.1 The cyber-physics system model of electricity-gas integrated energy system
The CPS model of EGIES is divided into an information system for information interaction and a physical system for electricity-gas interconnection. The physical system includes a power subsystem, natural gas subsystem, and coupling equipment. The subsystems are coupled and complemented by the gas turbine (GT) and the power to gas (P2G) units to realize the coupling of electric energy and natural gas. The information system includes the terminal equipment for measuring information and controlling execution, the communication equipment mainly composed of switches and routers, and the control server of the whole system. The physical system and the information system realize coupling interaction through information acquisition and control instruction action. It is set that all nodes and branches of the physical system are equipped with sensors and controllers. The communication link between the terminal unit (sensor, controller) corresponding to the physical system node and the control center is equivalent to an information node. The simplified structure of the CPS of EGIES is shown in Figure 1.
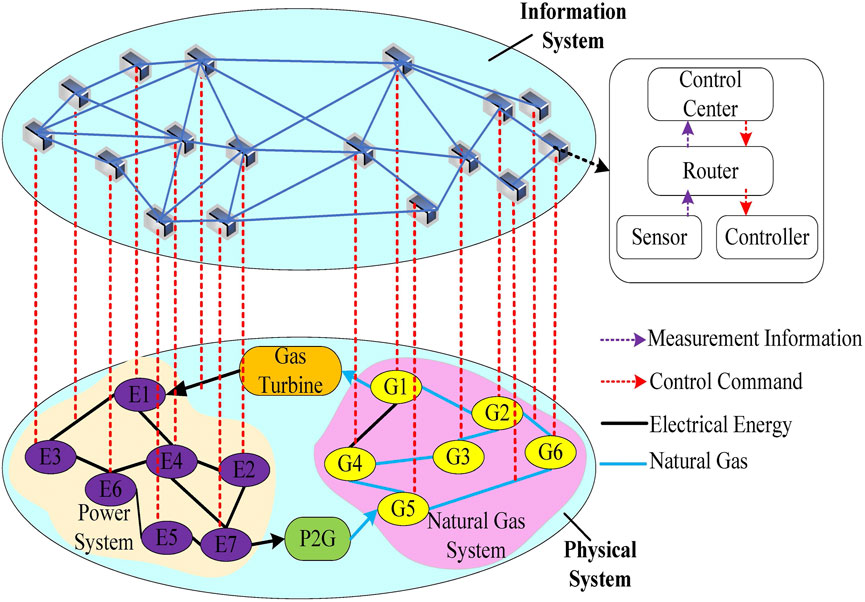
FIGURE 1. The structure of the CPS of EGIES.
The information system model matrix is expressed as follows:
Where
2.2 Analysis of fault propagation mechanism of electricity-gas integrated energy system under cyber attack
The security mechanism of the control center in the EGIES is perfect, and the probability of a successful cyber attack is very low. Compared with the control center server, the communication links and devices are more likely to be attacked successfully. To study the impact of cyber attacks on physical systems, this paper selects false data injection attacks (FDIA attacks), denial of service attacks (DoS attacks), and replay attacks to analyze the fault propagation mechanism caused by them. The impact of the above three cyber attacks on the CPS is shown in Figure 2.
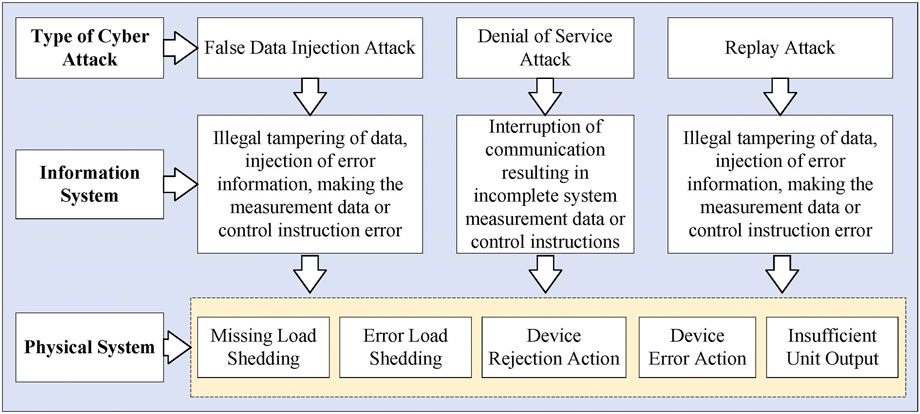
FIGURE 2. The influence of various cyber attacks on CPS.
Due to the different fault propagation mechanisms of various types of cyber attacks, the impact of cyber attacks on the physical system is different in the normal operation of the physical system and the failure of the physical system. When the physical system is in normal operation, the Dos attack has no effect on the system because the information received by the device is the data of the previous moment. The main influencing factors are FDIA attack and replay attack; when a physical system fails, fault detection and recovery are required, which depends on a completely reliable information system. When the information system is not completely reliable, the fault detection and recovery process of the physical system will be affected accordingly.
2.3 Cyber attack scenario simulation method based on N-n predicted fault set
According to the idea of the “N-1 fault set,” this paper proposes a cyber-attack scenario simulation method based on the “N-n preconceived fault set,” where
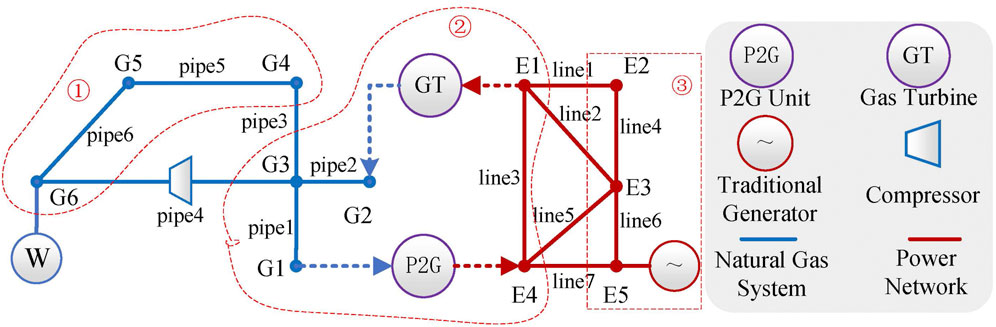
FIGURE 3. Schematic diagram of system node partition.
As shown in Figure 3, the node and branch numbers of the power system are
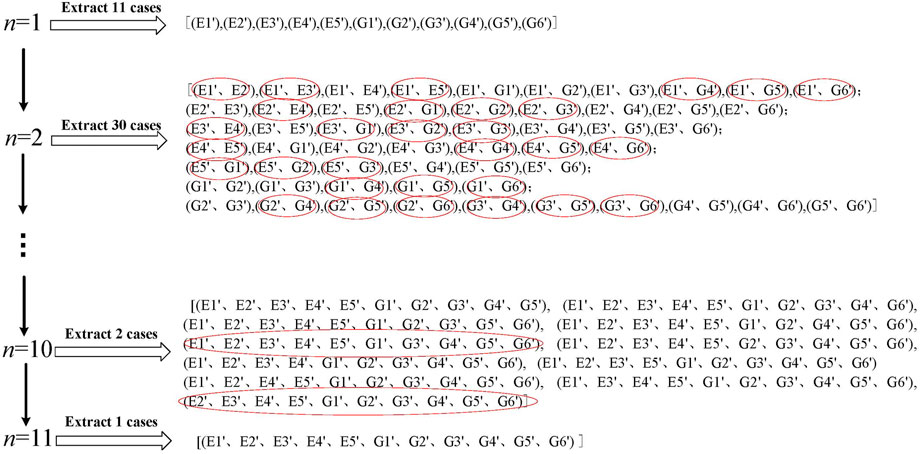
FIGURE 4. Schematic diagram of simulated sampling for cyber attack.
Through the “N-n expected fault set” simulation method proposed in this paper, FDIA attack, Dos attack, and replay attack scenarios can be simulated respectively. This simulation method can reduce computational difficulty while ensuring that all cyber attack scenarios are simulated as much as possible, and it is suitable for systems of any scale.
3 Reliability assessment of electricity-gas integrated energy system under cyber attack
3.1 Optimal load shedding model
Based on the gathered physical system measurement data and the specified optimization objectives, the control center takes optimization decisions. When the system is disturbed by cyber attacks and does not meet the operation constraints, the information system needs to optimize the scheduling. The optimal load reduction model is a mathematical model for simulating safety correction. Aiming at the power supply reliability of the system and considering the electric load and natural gas load, this paper establishes the optimal load shedding model with the objective function of minimizing the overall load shedding of the two systems. The objective function is as follows:
where
System constraints include power subsystem constraints, natural gas subsystem constraints, and coupling equipment output constraints, as follows:
Eq. 3 is the constraint condition of the power subsystem.
3.2 Reliability assessment index
In this paper, the load shedding amount is used as the standard to assess the energy supply reliability of the EGIES. Based on the objective function of the optimal load shedding model, the expected electric demand not supplied (EENS) and the expected gas demand not supplied (EHNS) are set as the indexes to assess the reliability of the power supply and gas supply of the system. The smaller the value is, the more stable and reliable the system is, The formula is as follows:
Where
3.3 Reliability assessment process
Based on the analysis of the fault propagation mechanism of EGIES under cyber attack and the simulation method of information attack scenario based on N-n preconceived fault set, the reliability assessment method of EGIES under cyber attack is proposed. The specific evaluation process is shown in Figure 5.
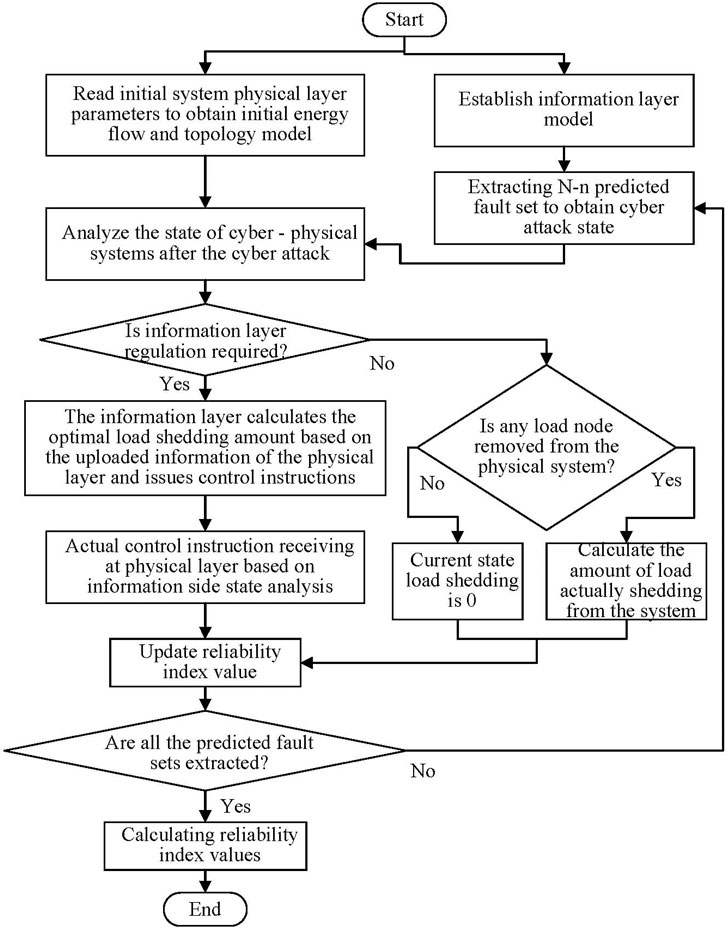
FIGURE 5. Reliability assessment process of the EGIES.
4 Reliability improvement strategy of electricity-gas integrated energy system under cyber attack
In view of the cyber attack scenario, this paper takes the branch power and pipeline flow in the EGIES as the optimization objective to optimize the system scheduling and improve the system’s energy supply reliability in the face of cyber attacks. Due to the different energy categories of electricity and natural gas, the response speed of the power subsystem and the natural gas subsystem to the control instruction is different. The power transmission is fast, and the response time is short, usually seconds to minutes. While the natural gas system has a storage effect, and the response time is usually minutes to hours. Therefore, according to the different response speeds of each energy system, a bi-level optimization model of branch power and pipeline flow of EGIES considering multi-time scales is established, and the optimization models of each layer are optimized according to their respective time scales.
The optimization goal of the constructed model is to find the topological nodes with the smallest difference value between the transmission branch power of the power system and the pipeline flow of the natural gas system and the limit value respectively, and to maximize the difference through optimization, the potential over-limit branches in the system are reduced, and improve the energy supply reliability of the system in the face of cyber attacks.
4.1 Pipeline flow optimization model of natural gas system
The upper layer optimization model takes the maximum safety distance between gas pipeline flow and the limit value as the objective function, the objective function is as follows:
Where the subscript
The natural gas flow balance constraint is as follows:
Where,
The natural gas system security constraints are as follows:
Where,
The unit output constraints are as follows:
Where
The gas load shedding constraints are as follows:
Where,
4.2 Branch power optimization model of electrical power system
The lower layer optimization model takes the maximum safety distance between branch power and the limit value as the objective function, the objective function is as follows:
Where the subscript
The power supply and demand balance constraints are as follows:
Where,
The power system security constraints are as follows:
Where,
The unit output constraints are as follows:
Where,
The power load shedding constraints are as follows:
Where,
4.3 Multi-time scale improvement strategy of electricity-gas integrated energy system
Figure 6 shows the multi-time scale scheduling optimization framework of the EGIES. Different time scales are assigned to the two subsystems. The optimization scheduling process of each layer is as follows:
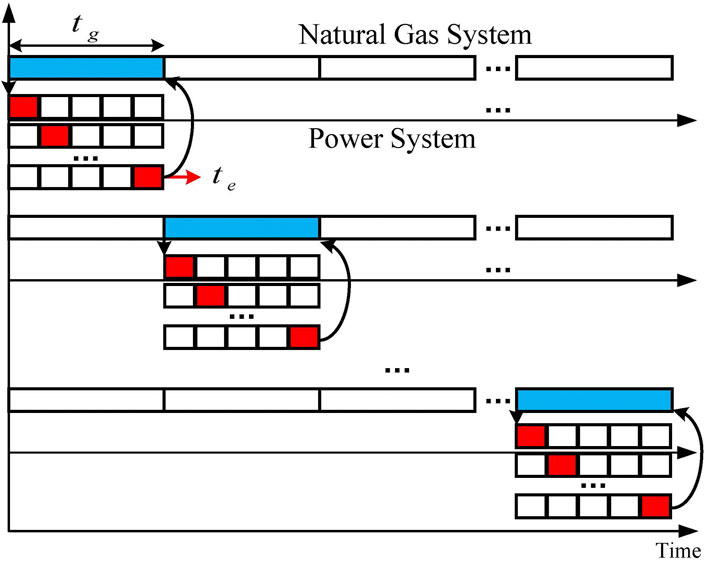
FIGURE 6. Multi-time scale scheduling optimization framework of the EGIES.
The upper layer optimization model of the natural gas system: the execution time of optimal scheduling is long, and the scheduling time scale is set to
The lower layer optimization model of the power system: the execution time of optimal scheduling is short, and the scheduling time scale is set to
The specific implementation method can be divided into the following two situations:
Case 1: When
Case 2: When
According to the above analysis, the specific implementation process of multi-time scale optimal scheduling of EGIES can be obtained, as shown in Figure 7. Compared with the traditional scheduling strategy that does not consider the response speed of each subsystem, the scheduling strategy in this paper does not need to perform the global calculation on the system every time. In the time range of a natural gas system optimization schedule, the power system can be optimized many times, reducing the number of natural gas unit output adjustments and avoiding unnecessary calculations.

FIGURE 7. Multi-time scale optimal scheduling process of the EGIES.
4.4 Reliability improvement strategy solution of electricity-gas integrated energy system
In this paper, the improved particle swarm optimization algorithm is used to solve the established optimization model. Power system and natural gas system have their decision variables, so each layer of the optimization model should be solved by an improved particle swarm optimization algorithm. Due to the different response speeds of the power system and the natural gas system, the natural gas system can only be solved once after the power system is solved several times, and then the coupling variables are updated between the two subsystems, and the optimal solution of the two-layer optimization model is finally obtained. The solution process of the optimization model is shown in Figure 8.
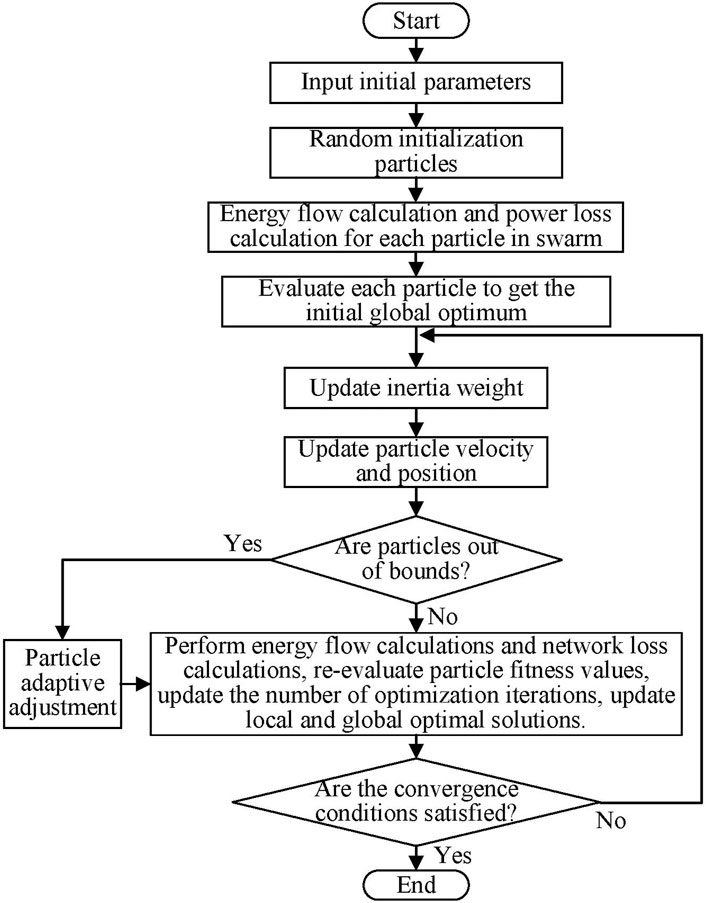
FIGURE 8. The Flow chart of the optimization model solution.
5 Case analysis
5.1 Basic data
To verify the effectiveness of the model, index, and method established in this paper, the IEEE57-NGS20 (EGIES) is taken as an example to carry out simulation analysis. The system topology is shown in Figure 9. The power system includes 78 transmission lines and seven traditional generators. The natural gas system includes 19 gas pipelines, 2 gas sources, 2 gas turbines, and 2 P2G equipment. The 44 and 52 nodes of the power system are connected to P2G equipment respectively, and the converted natural gas is injected into the natural gas network through the 5 and 14 nodes of the natural gas system. The natural gas system 3 and 13 nodes are connected to the gas turbine respectively, and the generated electric power is input into the power grid through the power system nodes 2 and 48. The conversion efficiency of P2G units is usually 50%–64%. In this paper, the conversion efficiency of P2G equipment is 0.5.
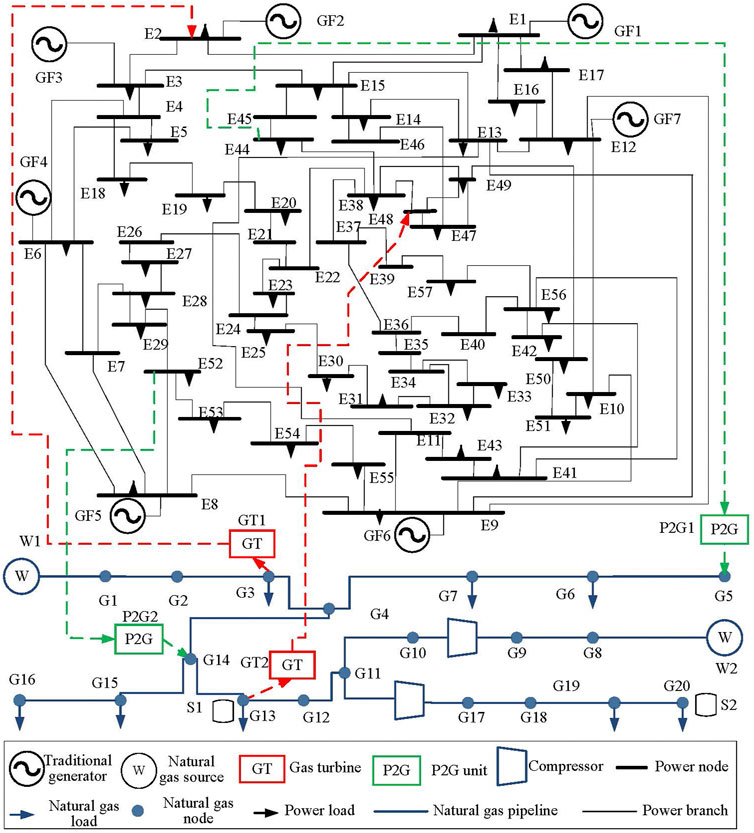
FIGURE 9. Simulation diagram of IEEE 57-NGS20 electricity-gas network.
5.2 Analysis of results
5.2.1 Analysis of the impact of cyber attack on the electricity-gas integrated energy system
In the EGIES, 78 lines of the power system and 19 pipelines of the natural gas system are respectively used as cyber attack targets. The FDIA attack is simulated to tamper with the measurement information of the system, and the normal information is tampered with as overload information to make the system branch break. The electrical load reduction amount and gas load reduction amount of the system when the corresponding information node of each branch is under information attack are calculated, and the load reduction result is shown in Figure 10. The abscissa is the branch number corresponding to the attacked information node, where No. 1–78 is the power system line number, 79–97 is the natural gas system pipeline number, and the ordinate is the reduction of electric load and gas load in the cyber attack scenario.
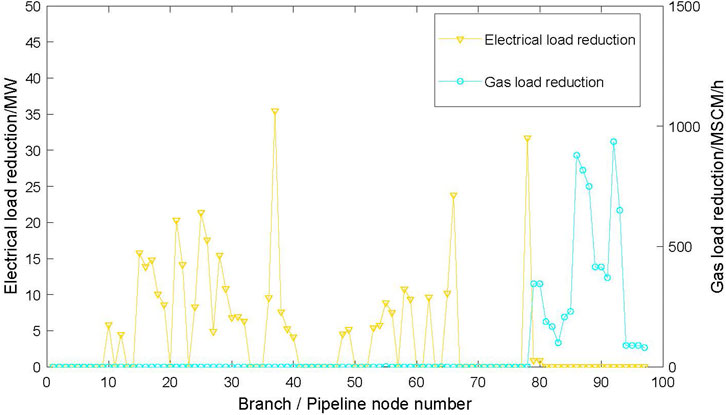
FIGURE 10. Reduction of electrical load and gas load under cyber attack.
According to the results of Figure 10, there are 35 lines of power load reduction caused by information attack, which results in the reduction of gas load in all branches of the natural gas system. It can be seen that the natural gas system is more likely to cause failure by information attack, so the protection of the natural gas information system should be strengthened.
To intuitively compare the changes in load supply of the power system and natural gas system caused by cyber attacks, and the impact of cyber attack degree on the physical side system, the fault scenarios are simulated on the power system side and the natural gas system side respectively. Table 1 shows the fault scenario Settings, L18-19 represents the physical side of the power node 18 and 19 branches are disconnected, Ie3-4 and Ie6 represent the power branch 3–4 and node six corresponding to the information node function failure, G13-14 represents the physical side of the natural gas node 13 and 14 pipelines are disconnected, Ig1-2 and Ig14 represent the natural gas pipeline 1–2 and node 14 corresponding to the information node function failure, other faults represent the same. The change of power load supply and natural gas load supply under each fault scenario is shown in Figure 11. According to the simulation results, the more serious the cyber attack on the information side, the less the supply of the physical side load of the EGIES, and the more the corresponding load shedding, that is, the lower the energy supply reliability of the system.
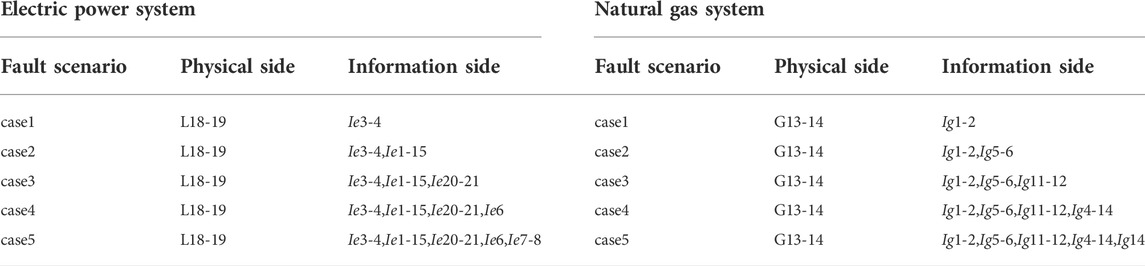
TABLE 1. Failure scenario simulation.
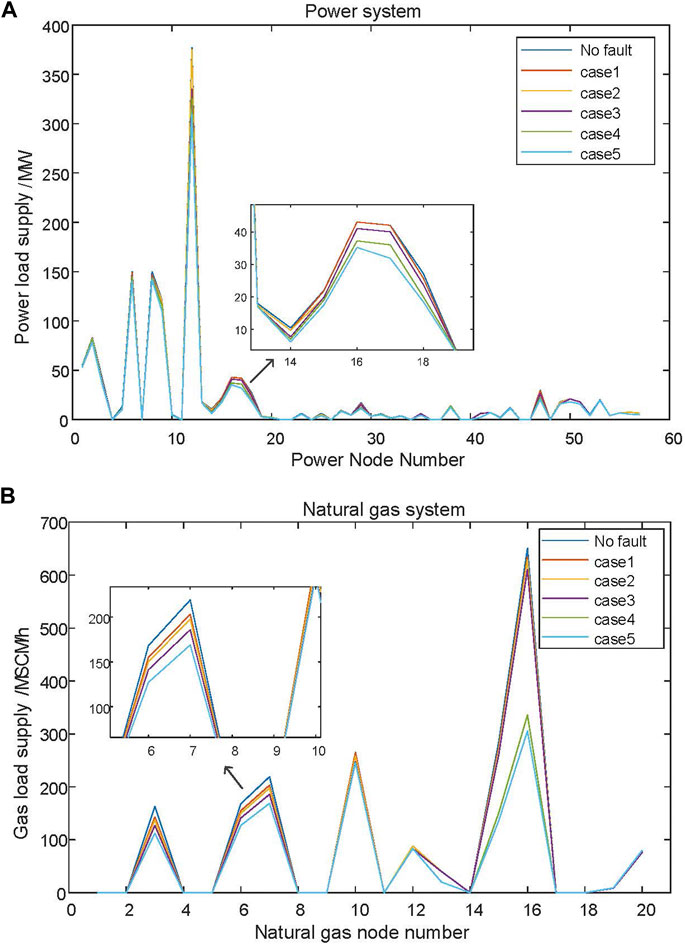
FIGURE 11. (A) Change of power system load supply, (B) Change of natural gas system load supply.
5.2.2 Analysis of reliability assessment results of electricity-gas integrated energy system under cyber attack
To analyze the influence of the degree of cyber attack on the reliability of the system, aiming at the two cases of normal physical system and physical system failure, some nodes in the system are selected as the object of cyber attack, so that the communication function of the information node fails, and the number of attack nodes increases from 1 to 10. According to the N-n expected fault set, the same number of information attack scenarios are simulated, and the reliability indexes of the system under the different number of attack nodes are calculated and compared. The fault situation of the physical system is simulated by breaking the power branch 18–19 and the natural gas pipeline 13–14. The calculation results of the reliability index are shown in Figure 12.
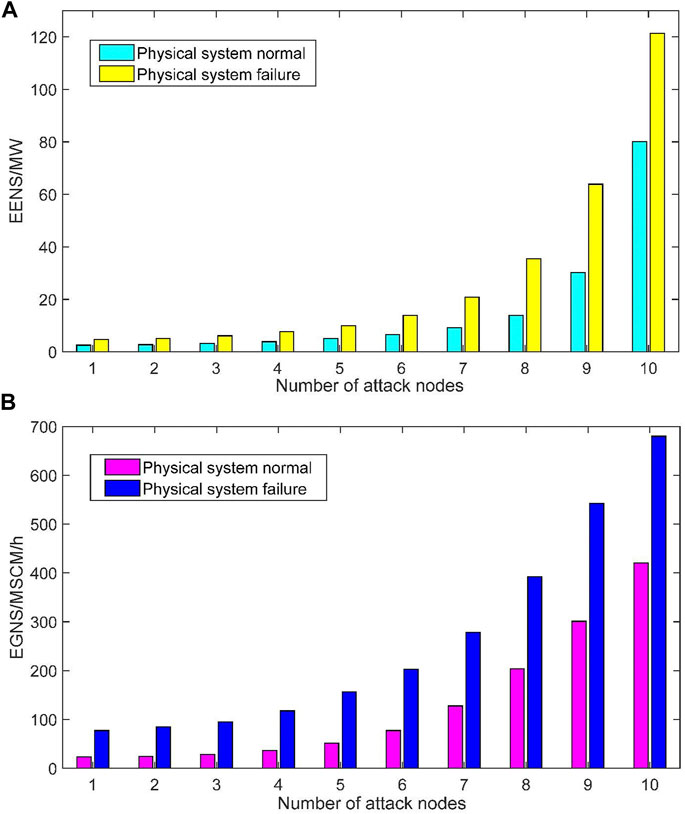
FIGURE 12. (A) The reliability index EENS of the different number of attack nodes, (B) The reliability index EGNS of the different number of attack nodes.
From the simulation results of Figure 12, it can be seen that as the number of nodes of information attack increases, the reliability index of the system increases, indicating that the system load shedding increases, that is, the reliability of power supply and gas supply of the system decreases. When the number of attack nodes exceeds 8, the reliability index of the system begins to rise significantly, which indicates that when the number of nodes attacked by information reaches a certain number, it may lead to cascading failure or even paralysis of the physical system. Therefore, it is necessary to take the reliability improvement strategy to strengthen the prevention of cyber attacks.
5.2.3 Analysis of optimal scheduling results based on two-layer optimization model
Figure 13A shows the comparison of branch power in the power system before and after optimization, and Figure 13B shows the comparison of natural gas pipeline flow before and after optimization. According to the comparison results, after optimizing the system through the proposed optimization model, the power of transmission line and the flow of natural gas pipelines are flatter. The optimization model proposed in this paper can reduce the power of transmission branches and the flow of natural gas pipelines with high over-limit risk as much as possible by adjusting the output of unit and gas source, stabilizing the energy fluctuation of the system, reducing the probability of system failure, and have stronger resistance to external disturbances.
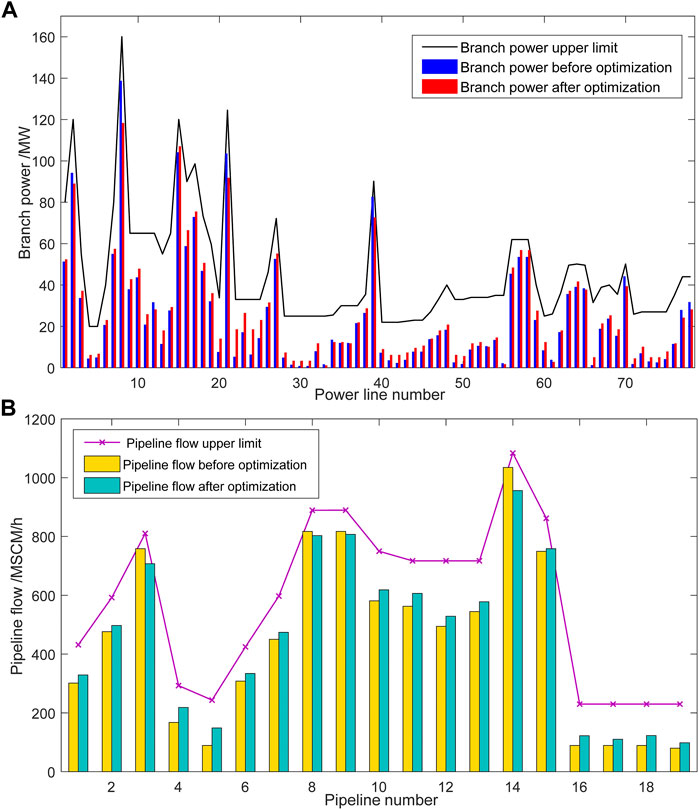
FIGURE 13. (A) Comparison of branch power results before and after optimization, (B) Comparison of pipeline flow optimization results before and after optimization.
The optimal scheduling of the EGIES under cyber attack is carried out to restore the stability of the system. The scheduling results are compared with the optimization results of the optimal load shedding strategy in Reference (Yu et al., 2018). To verify the effectiveness of the optimization model proposed in this paper.
The FDIA attack on the corresponding information nodes of power branch E3-E4 and natural gas pipeline G13-G14 is simulated to break them. Table 2 shows the adjustment of each control quantity in the system under the optimization strategy in Reference (Yu et al., 2018). Table 3 shows the adjustment of each control quantity in the system under the optimization strategy proposed in this paper. The results show that the total output of the traditional generator set in the strategy proposed in this paper is 25.0283 MW higher than that in the strategy proposed in Reference (Yu et al., 2018). To stabilize the energy fluctuation of the system, the optimization method in this paper abandons the operation economy of the system to improve its reliability of the system. The optimization strategy proposed in this paper adjusts the output of each unit to optimize the branch power and natural gas pipeline flow while supplying energy to the load. The purpose is to make the safety distance between it and the limit value as large as possible. However, while stabilizing the branch power and pipeline flow, it will also increase the output of the unit, resulting in an increase in system energy loss and a decrease in system economy.
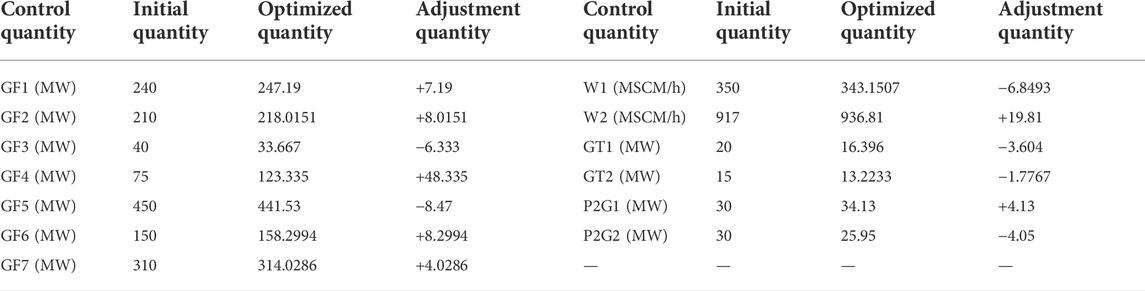
TABLE 2. Adjustment of control quantity using optimal load shedding strategy in Reference (Yu et al., 2018).
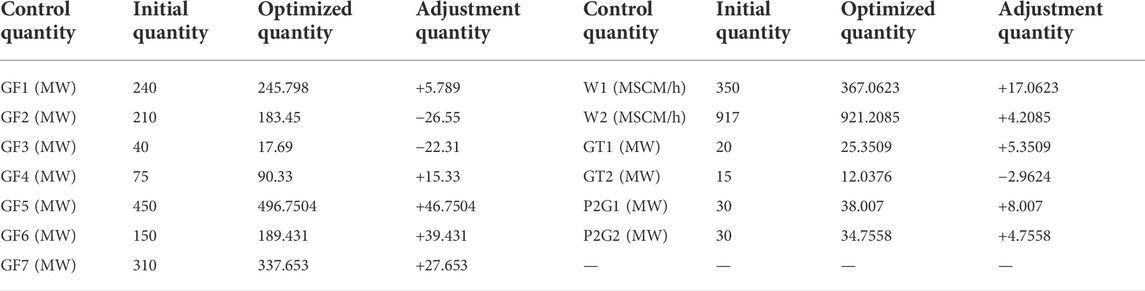
TABLE 3. Adjustment of control quantity using the optimization strategy proposed in this paper.
5.2.4 Analysis of optimal scheduling results on multi-time scale
To verify the superiority of the proposed multi-time scale optimal scheduling, the natural gas scheduling time is set to 30 min, and the power system scheduling time is set to 5 min, which is compared with the unit adjustment times under the unified time scale of 5 min, as shown in Table 4. The output adjustment of the unit in one of the optimization processes is displayed, as shown in Figure 14.
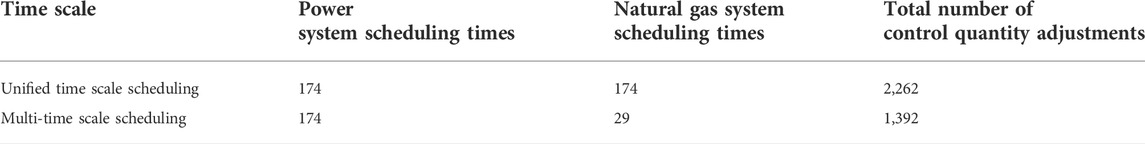
TABLE 4. Comparison of control quantity adjustment times under different scheduling methods.
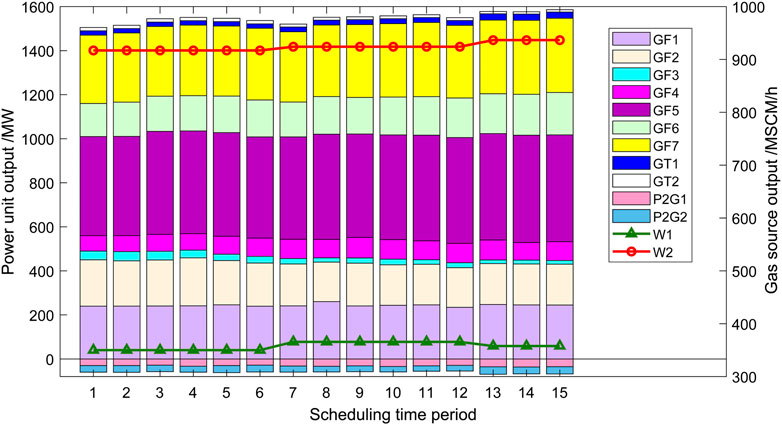
FIGURE 14. The output of each control quantity changes with time.
From the simulation results of Table 4 and Figure 14, it can be seen that compared with the unified time scale optimal scheduling, the multi-time scale optimal scheduling strategy can reduce the number of system control adjustments while ensuring the optimization effect, and the unit adjustment cost is reduced. It has a better economy and is more in line with the actual operation of the system.
Simulate FDIA attack on the system, the attack node increased from 1 to 6. The optimal load shedding model in Reference (Yu et al., 2018) and the optimization model proposed in this paper are used to optimize the scheduling of the electricity-gas interconnection system. The reliability index comparison results are shown in Figure 15.
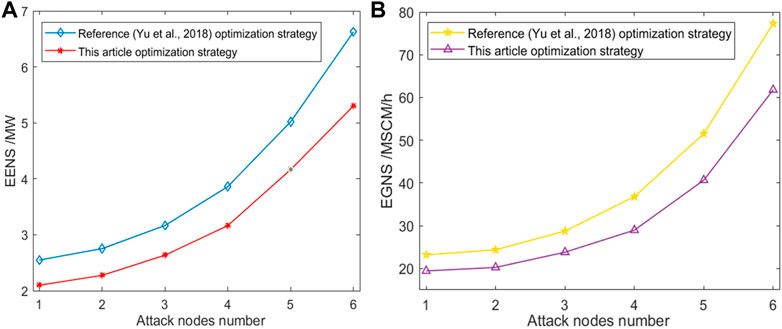
FIGURE 15. (A) Comparison of reliability index EENS results, (B) Comparison of reliability index EGNS results.
From the simulation results of Figures 15A,B, The optimization model proposed in this paper has a lower reliability index and less load reduction than the optimal load shedding model in Reference (Yu et al., 2018). The optimization model proposed in this paper directly optimizes the system branch power and the pipeline flow and reduces the risk of over-limit transmission lines and natural gas pipelines. When the system is attacked by information, the affected branches are reduced, and the reliability of the system in the face of cyber attacks is improved. At the same time, according to the trend of the change of the reliability index in the graph, the more serious the information attack is, the more obvious the advantages of the proposed optimization model are, which further verifies the feasibility and superiority of the optimization strategy proposed in this paper to maintain the reliable energy supply of the system when the system is attacked by information.
6 Conclusion
In this paper, an information attack scenario simulation method based on N-n predicted fault set is proposed. On this basis, a reliability assessment method of EGIES under cyber attack is proposed, and the reliability of EGIES is quantitatively assessed. The obtained reliability index provides the basis for the planning and safe maintenance of the system.
Finally, based on reliability assessment, in view of the situation that the branch power and pipeline flow of each system cannot be optimized uniformly, a bi-level optimization model of branch power and pipeline flow of EGIES considering multi-time scales is established. The optimization objectives are to maximize the safety distance between the branch power of the power system and the pipeline flow of each system, taking into account the slow dynamic characteristics of the natural gas system in actual operation. The scheduling based on a bi-level optimization model can stabilize the energy fluctuation of the system, reduce the risk of over-limit of system branches, and make the system more resistant to external disturbances. Multi-time scale optimal scheduling avoids a large number of unnecessary calculations and has a better economy. The proposed optimization strategy can reduce the influence range and loss degree of cyber attacks on the system, and ensure the energy supply reliability of the system. It provides ideas for the research on the reliability improvement method of the integrated energy system in the face of cyber attacks.
Data availability statement
The original contributions presented in the study are included in the article/supplementary material, further inquiries can be directed to the corresponding author.
Author contributions
ZZ, YW, and MJ contributed to the conception and design of the study. XL organized the database. ZZ performed the statistical analysis. YW wrote the first draft of the manuscript. MJ wrote sections of the manuscript. All authors contributed to manuscript revision, read, and approved the submitted version.
Funding
This work was supported by the National Key R&D Program of China under grant (2018YFA0702200), Liaoning Natural Science Foundation (2021-MS-086), the National Natural Science Foundation of China (62173074), the Key Project of National Natural Science Foundation of China (U20A2019).
Conflict of interest
MJ is employed by the State Grid Shandong Electric Power Company Binzhou Power Supply Company.
The remaining authors declare that the research was conducted in the absence of any commercial or financial relationships that could be construed as a potential conflict of interest.
Publisher’s note
All claims expressed in this article are solely those of the authors and do not necessarily represent those of their affiliated organizations, or those of the publisher, the editors and the reviewers. Any product that may be evaluated in this article, or claim that may be made by its manufacturer, is not guaranteed or endorsed by the publisher.
References
Bao, M. (2021). “Reliability analysis and reserve optimization of integrated gas and power systems considering failure propagation,” [dissertation/doctor's thesis]. ([Hangzhou]: Zhejiang University).
Chen, B., Lu, Z., and Li, B. (2019). Reliability assessment of distribution network considering multiple types of information disturbances. Automation Electr. Power Syst. 43 (19), 103–110. doi:10.7500/AEPS20190102006
Chen, J., Yu, T., Xu, Y., and Cheng, X. (2018). Analytic method for power supply reliability assessment of electricity-gas coupled energy system. Automation Electr. Power Syst. 42 (24), 59–66. doi:10.7500/AEPS20180619012
Ding, M., Wang, H., Wang, C., Wang, Q., and Tang, Y. (2021). Review of reliability assessments for energy internet based on cyber physical integration. Power Syst. Technol. 45 (2), 425–436. doi:10.13335/j.1000-3673.pst.2020.1363
Fan, H., Wang, H., and Zhang, S. (2022). Hierarchical modeling and energy-information flow hybrid calculation of integrated energy cyber physical system. Power Syst. Technol. 46 (8), 3028–3039. doi:10.13335/j.1000-3673.pst.2021.1565
Gong, L., Liu, T., He, C., Nan, L., Su, X., Hu, X., et al. (2021). Reliability evaluation of integrated electricity and natural-gas system considering integrated demand response. Electr. Power Autom. Equip. 41 (9), 39–47. doi:10.16081/j.epae.202109010
Guo, J., Han, Y., Guo, C., Li, D., and Sun, J. (2016). Reliability assessment of cyber physical power system considering monitoring function and control function. Proc. CSEE 36 (8), 2123–2130. doi:10.13334/j.0258-8013.pcsee.2016.08.011
Guo, J., Liu, W., Syed, F. R., and Zhang, J. (2019). Reliability assessment of a cyber physical microgrid system in island mode. CSEE J. Power Energy Syst. 5 (1), 46–55. doi:10.17775/CSEEJPES.2017.00770
Jia, H., Ding, Y., Song, Y., Hu, Y., and Liu, Y. (2019). Review of reliability analysis for integrated energy systems with integration of cyber physical systems. Power Syst. Technol. 43 (1), 1–11. doi:10.13335/j.1000-3673.pst.2018.2135
Li, G., Huang, Y., Bie, Z., An, J., and Liu, Y. (2019). Review and prospect of operational reliability evaluation of integrated energy system. Electr. Power Autom. Equip. 39 (8), 12–21. doi:10.16081/j.epae.201908040
Li, H., Kong, Z., and Tao, C. (2022). Reliability evaluation of electric-gas integrated energy system considering the multi-state model of natural gas pipeline network. Proc. CSEE 42 (17), 6247–6260. doi:10.13334/j.0258-8013.pcsee.211234
Ling, Z. (2021). “Reliability modeling and fast evaluation method of active distribution system considering cyber invalidity,” [dissertation/master's thesis]. (Beijing: North China Electric Power University).
Liu, W., Gong, Q., Guo, J., Shan, X., and Wang, Z. (2018). Reliability simulation of ADN cyber-physical system based on hybrid communication network. Proc. CSEE 38 (6), 1706–1718. doi:10.13334/j.0258-8013.pcsee.170375
Ni, W., Lv, L., Xiang, Y., Liu, J., and Huang, Y. (2020). Reliability evaluation of integrated energy system based on Markov process Monte Carlo method. Power Syst. Technol. 44 (1), 150–158. doi:10.13335/j.1000-3673.pst.2019.0047
Ren, H., Jia, Y., Tian, F., and Bai, Y. (2020). Reliability evaluation of electricity-gas integrated energy system with alternative loads. Electr. Power Constr. 41 (12), 39–46. doi:10.12204/j.issn.1000-7229.2020.12.004
Sun, H., Pan, Z., and Guo, Q. (2016). Energy management for multi-energy flow: Challenges and prospects. Automation Electr. Power Syst. 40 (15), 1–8. doi:10.7500/AEPS20160522006
Wang, C. (2020). “Vulnerability assessment of cyber physical power system for malicious attack,” [dissertation/master's thesis]. ([Jinan]: Shandong University).
Wang, J. (2021). “Reliability evaluation of multi-energy system based on electric-gas-heat coupling power flow,” [dissertation/master's thesis]. ([Shenyang]: Shenyang University of Technology).
Wang, L., Liu, J., Xu, L., He, X., and Tang, J. (2020). Reliability analysis of integrated energy cyber physical system considering real-time demand response. Electr. Power Constr. 41 (12), 23–38. doi:10.12204/j.issn.1000-7229.2020.12.003
Wang, Z., Chen, Y., Zeng, J., Chen, J., and Liu, J. (2019). Modeling and reliability assessment of completely distributed microgrid cyber physical system. Power Syst. Technol. 43 (7), 2413–2421. doi:10.13335/j.1000-3673.pst.2018.2910
Xu, S. (2019). “Reliability analysis of distribution network CPS based on non-sequential monte-carlo simulation,” [dissertation/master's thesis]. ([Hangzhou]: Zhejiang University).
Xue, Y., Li, M., Luo, J., and Ni, M. (2018). Modeling method for coupling relations in cyber physical power systems based on correlation characteristic matrix. Automation Electr. Power Syst. 42 (2), 11–19. doi:10.7500/AEPS20170705006
Yan, C., Bie, Z., Liu, S., Urgun, D., Singh, C., Xie, L., et al. (2021). A reliability model for integrated energy system considering multi-energy correlation. J. Mod. Power Syst. Clean Energy 9 (4), 811–825. doi:10.35833/MPCE.2020.000301
Yan, Z. (2020). “Evaluation of operation reliability of distribution network in electric-gas integrated energy system,” [dissertation/master's thesis]. ([Nanjing]: Southeast University).
Yang, C., Gao, L., and Tang, W. (2021). Reliability evaluation of gas-electric coupling system based on bayesian network time series simulation. Electr. Drive 51 (11), 75–80. doi:10.19457/j.1001-2095.dqcd21268
Yu, J., Ma, M., Guo, L., and Zhang, S. (2018). Reliability evaluation of integrated electrical and natural-gas system with power-to-gas. Proc. CSEE 38 (3), 708–715. doi:10.13334/j.0258-8013.pcsee.170980
Yuan, H., Li, G., Long, T., Hou, Z., and Zhang, H. (2019). Power system reliability assessment considering state estimation and observability. Power Syst. Technol. 43 (12), 4274–4282. doi:10.13335/j.1000-3673.pst.2019.1679
Zhang, C., Tang, Q., Yan, W., and Wei, J. (2017). Reliability evaluation of integrated community energy system based on particle-swarm-interior-point hybrid optimization algorithm. Electr. Power Constr. 38 (12), 104–111. doi:10.3969/j.issn.1000-7229.2017.12.013
Zhang, Y., Liu, W., Liu, G., and Huang, S. (2021). Modeling and vulnerability analysis of electric cyber physical system considering topological correlation and double coupling. Proc. CSEE 41 (16), 5486–5499. doi:10.13334/j.0258-8013.pcsee.210224
Keywords: electricity-gas integrated system, cyber attack, N-n predicted fault set, reliability assessment, multi-time scale improvement strategy
Citation: Zhao Z, Wang Y, Jiang M and Liu X (2022) Research on reliability assessment and multi-time scale improvement strategy of electricity-gas integrated energy system under cyber attack. Front. Energy Res. 10:1049920. doi: 10.3389/fenrg.2022.1049920
Received: 21 September 2022; Accepted: 28 October 2022;
Published: 10 November 2022.
Edited by:
Haochen Hua, Hohai University, ChinaReviewed by:
Mo Zhao, Civil Aviation University of China, ChinaLili Cui, Shenyang Normal University, China
Fei Teng, Dalian Maritime University, China
Copyright © 2022 Zhao, Wang, Jiang and Liu. This is an open-access article distributed under the terms of the Creative Commons Attribution License (CC BY). The use, distribution or reproduction in other forums is permitted, provided the original author(s) and the copyright owner(s) are credited and that the original publication in this journal is cited, in accordance with accepted academic practice. No use, distribution or reproduction is permitted which does not comply with these terms.
*Correspondence: Xinrui Liu, bGl1eGlucnVpQGlzZS5uZXUuZWR1LmNu