 Yue Wang
 Xinyu Kang
- College of Management Science, Chengdu University of Technology, Chengdu, China
Aluminum is an essential strategic mineral resource. The geographical space distribution characteristics make the aluminum ore trade relationship more complicated. This paper analyzes the evolution characteristics, spatial migration, and trade competition of aluminum ore trade from 2011 to 2020. This paper constructs the aluminum supply risk propagation network Aluminum Supply Risk Spread Network to analyze the propagation path, impact scope, and potential impact of different risk outbreak sources. The results show that a few countries control more aluminum ore resources, and the trade community and center of trade gravity have changed significantly. Trade competition gradually intensifies, mainly concentrated in Asia and Europe. When supply risk occurs, the threat spreads rapidly. This paper selects four major trading countries Brazil, Guinea, Australia, and China, as risk outbreak countries. Risk outbreak mainly shows three typical characteristics. Meanwhile, indirect infections account for a large proportion, and China plays an essential role in trade. Finally, based on these findings, some suggestions to maintain the stability of the aluminum resource trade and improve its ability to resist risks for China.
1 Introduction
Aluminum is an essential strategic mineral resource. It occupies an important position in the development of the national economy. Aluminum has good flexibility, corrosion resistance, and electrical conductivity, widely used in home appliance communication, transportation, the construction industry, durable consumer goods, and other fields (David and Kopac, 2018). Aluminum is an essential primary material in industrial construction. It is the most widely used metal after iron (Recalde et al., 2008). Significant separation of supply and demand is characteristic of strategic mineral resources. However, the distribution of resources is uneven. According to USGS data, the total global aluminum resource is about seventy-five billion tons. Aluminum ore is mainly concentrated in Guinea, Australia, and Vietnam in Africa, Oceania, and Asia. The aluminum ore reserves in these regions account for 64% of the World’s total reserves. Imports are concentrated in Europe, Asia and North America. Meanwhile, aluminum is one of the five energy-intensive industries, accounting for 2% of global carbon emissions. The climate crisis has led countries around the world to adopt measures to limit high-carbon industries (Ren et al., 2022). Pollution from the mining process is obvious, and many areas have gradually begun to restrict the mining and export of aluminum ore. In addition, with the acceleration of global industrialization and the upgrading of the manufacturing industry, the demand for aluminum is increasing yearly (Yi et al., 2022). The imbalance in supply and demand has intensified competition among countries for aluminum. Trade protectionism and the unsafe international trade environment hinder the sustainable supply of aluminum resources and the sustainable development of the economy and society (Wen, Tong, and Ren, 2022). Various and increasingly frequent crises, such as the outbreak of the new crown epidemic, have further exacerbated the vulnerability of the world’s aluminum supply. Therefore, countries need to ensure the safe supply of aluminum resources through trade networks. Safe and stable access to aluminum resources through trade has become an issue of increasing concern to countries worldwide. Under the background of this national trade, understanding the aluminum mining trade’s competitive characteristics and supply risks is crucial for different countries to develop strategies.
The research on aluminum is focused on aluminum inventory (Chen and Graedel, 2012), material flow (Chen and Shi, 2012), and recycling (Gaustad et al., 2012). However, with the rapid development of the global aluminum industry, trade between countries is becoming more and more frequent. The trade volume of aluminum ore is increasing year by year. Previous studies are difficulty reflecting the aluminum trade network’s overall and systematic characteristics. Therefore, expanding the research perspective on the aluminum trade is urgent. In the aluminum trade network, different countries constitute a highly interconnected and interacting complex system (Sun et al., 2017; Chen et al., 2020). Complex networks quantify these complex trade network relationships and their underlying characteristics (Hu et al., 2020). In recent years, the complex network has been widely used in the international trade of resources to analyze the structural characteristics of the metal resources trade network and community division. For example, Wang and Huang (2020) used complex network theory to draw the structural evolution of global copper scrap trade from 1988 to 2017. The study found that the copper scrap trade was reshaped from previous geopolitical realities. Hu et al. (2021) constructed the global trade network and analyzed its backbone structure, geospatial characteristics, and trading communities from 2021 to 2019. The study found that trade is shifting. Hou et al. (2018) studied the spatio-temporal evolution of rare earth trade and the trade position of significant countries. Therefore, the complex network analysis provides the basis for the evolution of the aluminum mining trade pattern and community.
It is also worth discussing to analyze the competition based on the characteristics of the trade network (Liu et al., 2020). The traditional way of analyzing trade competition between two countries is through some simple index such as the revealed comparative advantage index (RCA) (Balassa, 1965), trade competitiveness index (TC), the international market share (IMS), and relative trade advantage (RTA) (Vu et al., 2019). However, due to the complexity of global trade networks and the dependence between countries, it is difficult for a single indicator to reflect the competition pattern within the system. Therefore, scholars use complex network theory to study trade competition. Zhang et al. (2014) primarily proposed a complex network approach to study the evolution of the global oil trade competitive pattern and proposed the “5C” policy framework. The trade competition analysis framework has been used in many trade competition studies, such as cobalt (Sun et al., 2022), rare earth (Zhang et al., 2022), lithium (Shao et al., 2021), graphite (Wang et al., 2019), iron ore (Hao et al., 2018), etc.
At the same time, as the process of globalization continues to accelerate, the ties between trading countries have become increasingly close. The potential risks in trade are increasing year by year. Trade relations are among the most critical risk communication channels (Cheewatrakoolpong and Manprasert, 2014; Wang and Zhao, 2020). Trade relations between countries will break in extreme weather, economic disputes, political conflicts, and other factors (Egging and Holz, 2016). Risks may spread to other countries through trade relationships, affecting entire trade networks. When exploring the transmission path after the outbreak of potential trade risks, scholars refer to the infectious disease model (Wenli and Yaowen, 2009), the cascading failure model (Gephart et al., 2016), etc., for simulation. Currently, the research mainly focuses on oil (Zheng et al., 2021), natural gas, grain, and others (Cao et al., 2022; Zheng et al., 2022). Less research on strategic mineral resources. Wang explores the impact of the new crown epidemic on trade based on studying the characteristics of the solar photovoltaic cell trade (Wang et al., 2021). The study finds that the network is resilient to shocks caused by reduced demand. Chen explores the global natural gas trade structure based on network dynamic simulation, simulates the potential propagation process of the risk outbreak, and analyzes the role of countries after the risk outbreak (Chen et al., 2018). Wang combines the complex network method and the cascading failure model to explore the global graphite supply crisis propagation and calculate the impact of different risk outbreak sources (Wang et al., 2018). Sun Xiaoqi analyzes the potential risks in the cobalt trade network and quantifies the risk propagation path (Sun et al., 2022).
In general, there are few studies on the characteristics of aluminum ore trade networks and the evolution of communities. The competitive relationship between countries in the trade network is also unclear. The risks in the aluminum ore trading network are yet to be revealed. Based on the evolution of aluminum ore, this study analyzes the competition mode and establishes the impact propagation model. The impact of supply reduction on the whole aluminum trade network is studied. This paper is of great significance to timely prevent the spread of trade risks in, maintain the supply security of aluminum resources, and formulate risk prevention mechanisms. The rest of this paper is summarized as follows: Section 2 describes the data and methods used in this paper. Section 3 shows the structural features of the aluminum ore trading network and the division of communities. Section 4 introduces the competitive network of aluminum ore trade. Section 5 presents the spread of risk in the aluminum ore trading network. Section 6 provides conclusions and recommendations.
2 Data sources and model building
2.1 Data
The aluminum ore data in this paper are from the UN Comtrade database. Select the aluminum import and export data (commodity code 2606) from 2011 to 2020. Import and export data are unequal due to different basis of import and export trade data calculation. This paper processed the data. The sum of import and export data is averaged as raw data for analysis. This article removes some countries and regions, leaving 189 countries after removal. Refer to Supplementary Material S1 for the abbreviations of the participating countries.
2.2 Evolution network of aluminum ore trade
This paper defines the trade network model of aluminum as T= (V, E). V is the set of nodes in the inter-aluminum trade network. E is the aluminum trade edge set. In the aluminum international trade network, the country is the network node. Aluminum trade relations between countries are marginal. The trade volume is the weight of the edge. Add a border if there is trade between country i and country j. The weights represent the trade volume represented by
This paper aims to understand the evolution of global aluminum ore trade characteristics from 2011 to 2020. This paper uses the Leiden algorithm to divide the communities to which trading countries belong. The existing commonly used community division method is the Louvain algorithm. Louvain algorithm maximizes the network modularity benefit through the iterative loop and has high operating efficiency. However, when the community is divided, there may be poor or even disconnection within the original community (Blondel et al., 2008). In this paper, the Leiden algorithm proposed by V. Traag et al. is used to divide the aluminum trade network community at different stages. The accuracy of the classification results is significantly improved (Traag et al., 2019). The detailed calculation flow of the Leiden algorithm is shown in Supplementary Material. In addition, this paper analyzes the spatial evolution characteristics of the aluminum ore trade by calculating the shift of the trade center of gravity. Some scholars have used the trade center of gravity concept to study global economic changes and the evolution of resource trade characteristics. The trade center of gravity transformation reflects the spatial attributes of trade development (Sciarra et al., 2020; Hu et al., 2021). The spatial transfer characteristics of global aluminum ore trade are analyzed by calculating the center of gravity value of import trade and the center of gravity value of export trade, respectively. The calculation formula is as follows:
In the formula,
2.3 Aluminium trade competition network
The imbalance of resource endowment and demand between regions leads to trade. The inherent locational fixity of mineral resources determines their mobility on a global scale. For these reasons, there is greater trade competition among aluminum ore importing countries. To build a network, this paper uses countries as nodes and the trade competition relationship between countries as edges. In the trade competition network, this study calculates the competition relationship proposed by Zhang to measure the trade competition relationship between aluminum ore countries (Zhang et al., 2014). If two trading countries import aluminum ore from the same resource-exporting country, there is competition.
In the formula,
2.4 Aluminium supply risk spread network
Resource trade is a double-edged sword. On the one hand, countries can meet their own development needs through trade. On the other hand, when a crisis occurs in some countries, it is very likely to be transmitted to other countries through trade channels and even spread worldwide (Lee and Goh, 2016). Exporting countries may reduce resource exports in the aluminum resource trade network, such as extreme weather, conflicts, etc. This will lead to a certain degree of resource shortage in the relevant resource-importing countries, affecting the country’s industrialization.
Based on the trade evolution and trade competition model, the Susceptible-Infectious (SI) infectious disease model, and referring to the algorithm proposed by Lee et al. (2011), this paper presents the Aluminum Supply Risk Spread Network (ASRSN). This paper explores the transmission path of risks and the impact on different countries when aluminum resources are at risk. The standard SI model divides nodes into susceptible and susceptible (Ji, 2019). The disease spreads to the susceptible population at a certain speed of transmission. Once infected, there is no cure. As time increases, all nodes are eventually infected (see Eq. 5).
The spread of risk in the aluminum ore trade network is similar to the spread of an infectious disease—risk propagation through cascading failure models on weighted directed networks. The cascade failure model consists of three main components: load, distribution strategy, and failure rules (Wang et al., 2018). The load is the maximum load value that the nodes and edges in the network can withstand. And the distribution strategy is to redistribute the excess load when the node collapses. The collapse continues to occur after the residual node load exceeds the maximum threshold to be infected by the collapsed node. Based on the above description, the cascading failure model proposed by Lee is used to simulate the diffusion effects of the aluminum supply crisis throughout the trading network. The dynamic process of the cascade failure model is shown in Figure 1. The specific propagation process is as follows:
(a) Assume that initially, all countries are in a normal state. Define the capacity
(b) Due to the collapse of country i as a result of some crisis, there is a supply crisis leading to a decrease in its export volume, assuming that its total export volume decreases ε (See Figure 1A).
(c) For any country linked to a collapsed country whose total reduction in imports ΔW exceeds its ability to resist risk T × β, then that country also collapses and its export share decreases in the same proportion as its proportional reduction in imports (See Figure 1B), unlike the fixed proportional ε reduction, we argue that reducing exports according to the country’s proportional import loss better reflects the actual situation (the country will dynamically adjust the export reduction ratio according to the extent of its losses, rather than using a fixed reduction ratio strategy). This process leads to the continued infection of the neighboring countries of the collapsed country (See Figure 1C).
(d) Repeat step c until no additional collapsed countries, and this avalanche process ends (See Figure 1D).
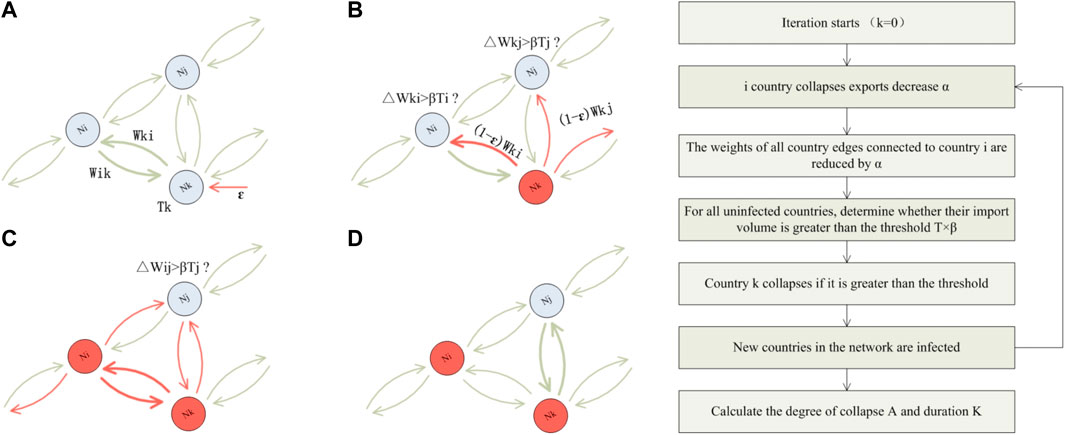
FIGURE 1. Algorithm process of global aluminum risk propagation model. Note: The picture on the left is the propagation process of the cascade failure model. Red nodes represent infected countries after a sudden shock, i.e., active nodes; blue nodes represent normal countries, i.e., inactive nodes. This figure is revised by Lee et al.
3 Analysis of the evolution of the aluminum ore trade
This paper constructs an aluminum ore trade network and analyzes the characteristics of global aluminum trade flows from 2011 to 2020. This paper mainly explores trade structure, geospatial features, and community division and provides a theoretical basis for quantitative analysis of risk propagation paths.
Figure 2 shows the global aluminum trade volume distribution, trade country, and trade relationship from 2011 to 2020. It can be seen that the growth of trade relations and trade volume was relatively slow from 2011 to 2015. State relations concentrate between 690 and 700. Trade participating countries focus on 132–135. Due to the reduction of global aluminum ore production and the prohibition of the export of aluminum ore issued by Indonesia in 2014, the aluminum ore trade has caused a significant impact. This led to a sharp decline of the aluminum ore trade and the countries involved in the trade after 2013. Trade relations have fallen by a third of what they were in previous years. Only 423 trade relations exist between countries. Trade participants and trade relations have picked up after 2016. Trade relations remain between 710 and 720. Trading countries and trade relations have stabilized.
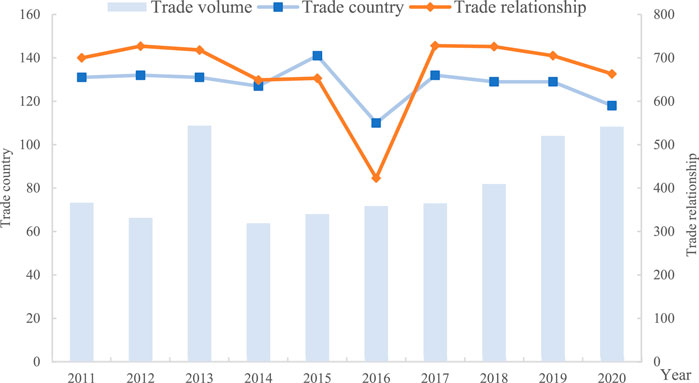
FIGURE 2. Distribution of aluminum ore trade volume, trade country, and trade relationship from 2011 to 2020.
To further analyze the characteristics of trade structure, this paper calculates the cumulative distribution map of in-degree and out-degree aluminum ore, respectively. As shown in Figure 3, about 40% of countries account for 86% of trade relations. The degree distribution of aluminum exhibits a power-law distribution. There are slow fluctuations in the relationship of imports between trading countries. The trade-import relationship rebounded after a slow decline. Trade relations are more concentrated. The export relationship between trading countries is far greater than the import trade relationship. Trade relations are relatively fragmented, and exports are diversified.
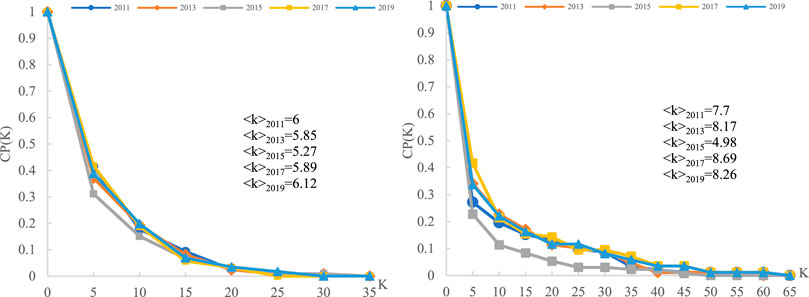
FIGURE 3. The cumulative distribution of in-degree and out-degree in the aluminum ore trade network Note: the left picture is the cumulative distribution of in-degree; the right image is the cumulative distribution of out-degree.
After analyzing the overall trade characteristics, the paper selects different years to explore the aluminum trade network features. As shown in Figure 4, the node size represents the out-degree size of the trading country. This paper uses the Leiden algorithm to divide the community. China has occupied a relatively important position in the aluminum ore trade since 2011. Trade relations and trade volumes are at the forefront. The trade structure in 2011–2014 was similar. The trade structure from 2015 to 2019 is identical. Since 2020 was hit by the COVID-19 pandemic, this paper studies the trade structure in 2020 separately. Before 2014, trade relations were relatively stable. Developed countries led by Europe and the United States occupy the primary position in the trade network. After 2015, trade relations began to show a trend of diversification. Asian countries headed by China, India, and Japan have gradually developed closer trade relations. The American countries, led by the United States, began to separate from the European trading community. Trade relations are getting closer. The new crown epidemic in 2020 has a more significant impact on the aluminum ore trade network. The epidemic’s effect has disrupted the supply of resources in some trading countries. Reduced trade relationships and trade volumes in the network. Fewer communities are involved in trade networks. In general, the countries participating in the aluminum resource trade are relatively concentrated. A few countries have more resources. Trade participating countries are concentrated in Australia, China, Guinea, Malaysia, and other countries, primarily distributed in Asia, Europe, Africa, and other places. Therefore, countries urgently need to expand to new trading countries to diversify trade risks and maintain a stable supply of resources.
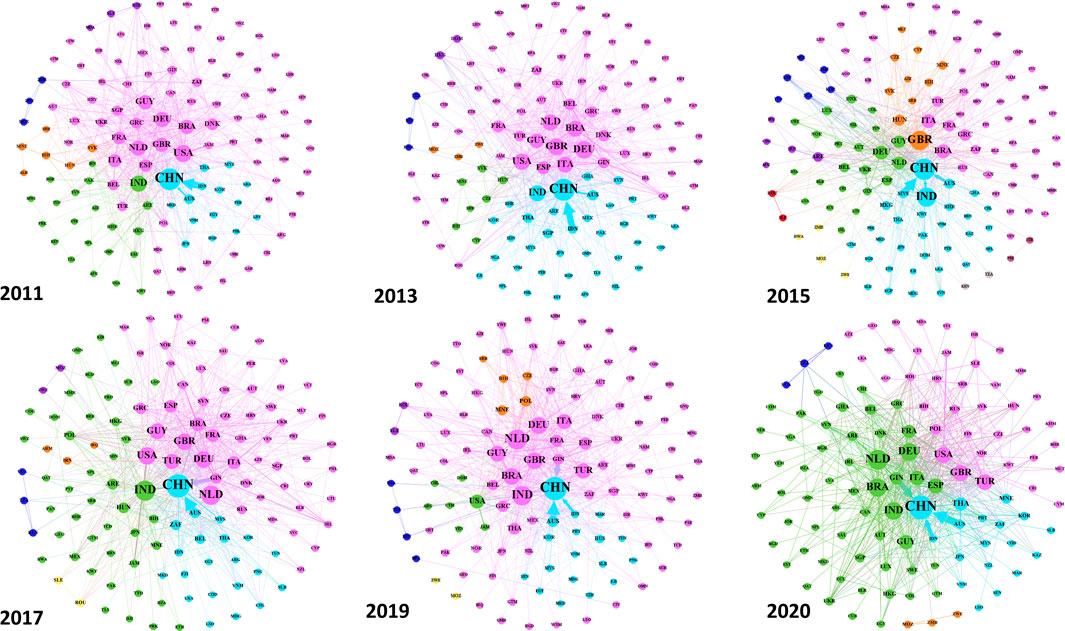
FIGURE 4. Global Aluminium Ore Trade Evolution Network in 2011, 2013, 2015, 2017, 2019, and 2020. Note: The weight of the edge means the trade volume. Arrows indicate the direction of trade. The node’s color indicates the community category the trading country belongs to. Nodes with the same color indicate that they are in the same neighborhood.
This paper explores the process of intra-community trade flows and evolution from 2011 to 2020. Figure 5 shows three significant communities that have been formed since 2011. The flow of major trading communities is relatively stable. There are some processes of national community separation. The United States gradually separated from the first community led by Europe and slowly moved closer to the fifth community. Eventually, a tertiary community was formed in some American countries. Asian countries led by China are evolving progressively from the third community to the second community. The second community also occupies an essential position in the trade network progressively. The exporting countries headed by Guinea have been concentrated in the first community. The trading community has not changed. These countries play a more important role in maintaining the stability of the aluminum ore trade. The trading community of Asian countries, Africa, and some European countries are relatively stable. Some American countries are still in the trade network where the community category changes frequently. These countries will bring greater instability and higher potential risks to the trade network.
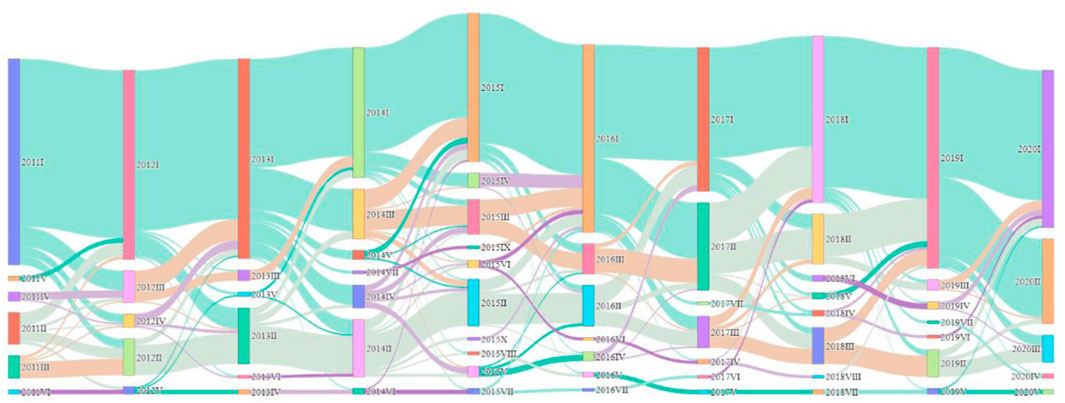
FIGURE 5. Flow chart of community division from 2011 to 2020. Note: The trading countries flowing into the same community are of the same color.
The changes in the global aluminum trade center of gravity from 2011 to 2020 are shown in Figure 6. The distribution of the gravity center can more intuitively and dynamically reflect the spatial variation characteristics of trade. The figure shows the trend changes of the gravity center in trade exports and imports. Different colors indicate the category of the continent to which the country belongs. Countries on the same continent have the same color. The changes of the green and red dots represent the changing trends of the export center of gravity and the import center of gravity, respectively. It can be seen that the focus of import trade flows from Europe to China. The emphasis of import trade has shifted to the east, indicating that the aluminum industry in some parts of Europe has completed the transformation. Asia’s national aluminum resource industry is moving toward the middle and downstream industries. Therefore, the country needs to formulate effective policy measures to protect domestic industrial production. On the one hand, Eastern countries headed by China can ease the pressure on their production by developing their existing resources. On the other hand, expanding the import source countries diversifies the trade risks. The focus of export trade flows from Australia to African countries led by Guinea. The shift of export focus to Africa shows that these major trade exporting countries need to solve the problem of excess production in their countries through trade, to promote local economic development.
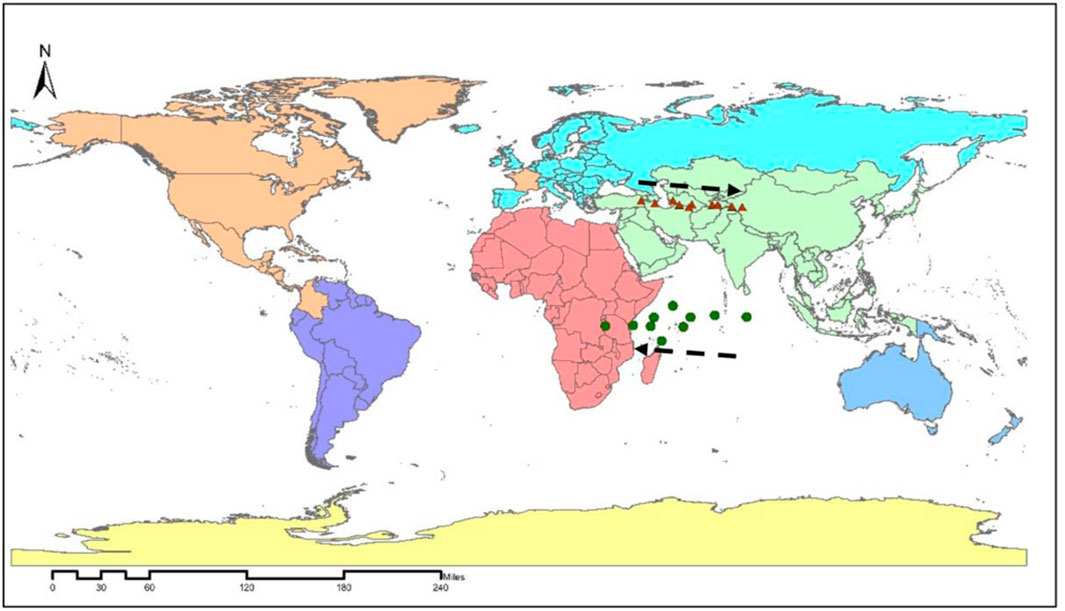
FIGURE 6. The global aluminum ore trade center of gravity shifted from 2011 to 2020.
4 Analysis of competition in aluminum ore trade
Based on analyzing the evolution of the aluminum trade, this chapter explores the overall competition pattern of aluminum ore based on the constructed trade competition network. Analyze the competition between major trading countries from 2011 to 2020. This paper divides the trade regions into Asia, America, Africa, Europe, and Oceania and calculates the trade import competition relationship and intensity between different continents, as shown in Figure 7. Overall, the import competition relationship of the global aluminum ore trade is relatively stable. The intensity of competition between regions is gradually increasing. Europe and Asia occupy a larger import volume from the main distribution area. Therefore, the trade competition relationship and competition intensity of global aluminum ore are mainly concentrated between Asia-Europe, Asia-Asia, and Asia-America. Some continents, such as Europe-Europe, Europe-Africa, America-Europe, and other regions, have more trade competition relations. The degree of competition among trading countries is relatively low. This may be because there are no significant trade competitors in these regions, and the endowment of aluminum resources is rather large. However, the trade competition and competition between Oceania are relatively low. But competition in Oceania and Asia is increasing.
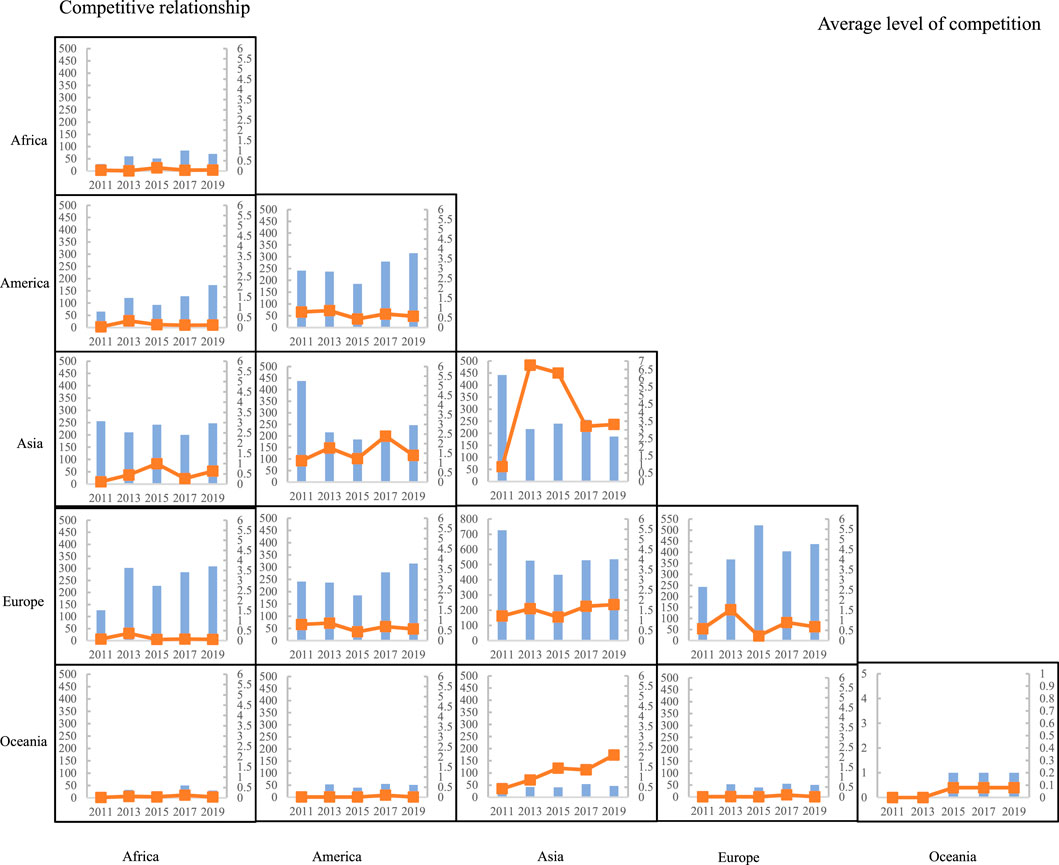
FIGURE 7. Trade competition relationship and average competition intensity between different continents from 2011 to 2020.
After analyzing the trade competition between different continents, the paper explores the competition intensity among trading countries. Table 1 shows the competitive intensity of the top five in additional years. The global trade of aluminum ore has completely shifted from the European region to the Asian region since 2011. The competition is now mainly concentrated in the Asian area. The competition intensity is dominated by the competition between China and other Asian countries, such as China and Japan, China and South Korea, etc. The intensity of competition is increasing year by year. This phenomenon also indirectly indicates that the development of the aluminum industry in Asia has not entirely transformed. Trade between countries is less stable. Governments should enact policies and regulations to reduce the dependence on external resources. This paper provides policy recommendations to mitigate trade competition among countries and improve the risk resistance of the aluminum ore trade network.
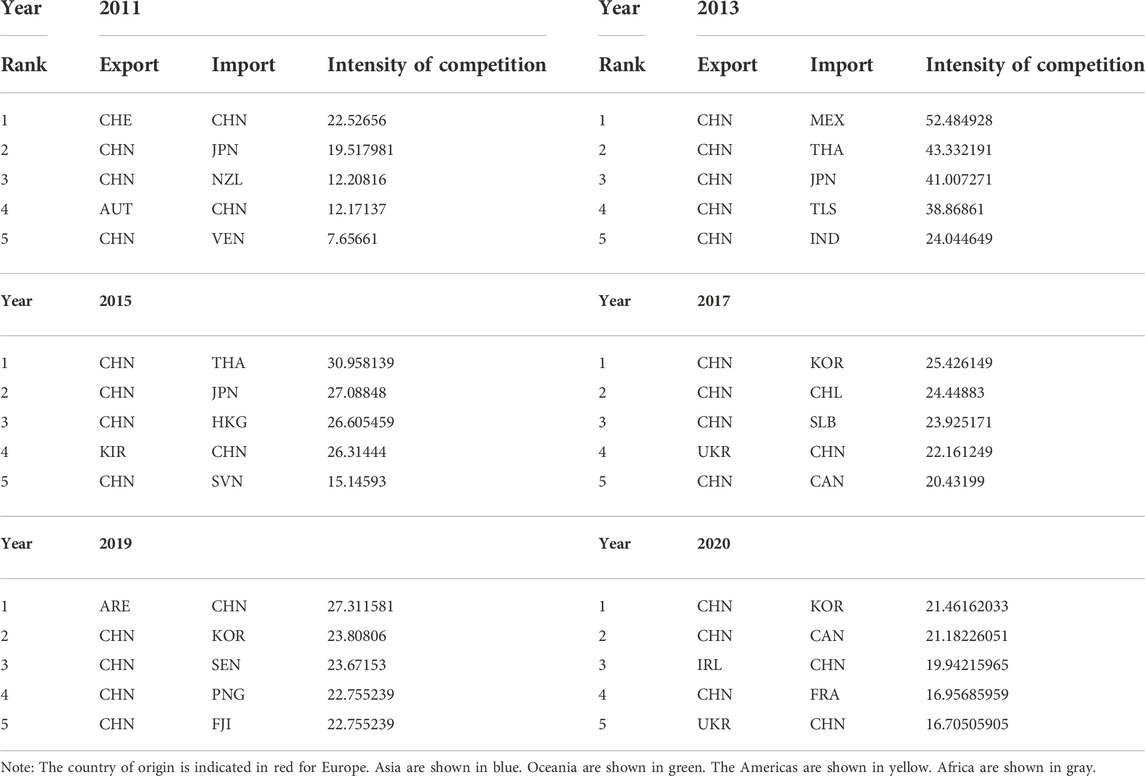
TABLE 1. Ranking of competitive intensity of trading countries in 2011, 2013, 2015, 2017, 2019, and 2020.
5 The impact of potential conflict on the aluminum ore trade network
The occurrence of extreme events may affect the export capacity of trading countries. To understand the impact of potential contingencies, this paper explores the risk propagation path of aluminum ore trade under potential contingencies based on the ASRSN risk propagation model constructed in Section 2.4. Most of the risks are not from the supply side but the demand side. Therefore, this paper takes supply-reduction-driven shocks as an example to quantify the risk propagation path under different shocks. The trade structure after 2015 is more similar, so this paper takes the sum of 2015–2019 data as an example for analysis when exploring the risk propagation path.
In this paper, the value of r(r = ɛ/β) is used to determine the propagation range when a risk occurs in the network. If the ratio is too large, the disruption of any risk point significantly impacts the network. If the ratio is small, the disruption of a risk point does not affect the aluminum trade network and cannot be effectively propagated. Assuming that each country is a risk outbreak source, adjusting the value of r obtains the avalanche size P(A) distribution. By comparison, finding that when r = 7, the avalanche size of each node shows a power-law distribution (as shown in Figure 8), which can better reflect the differences between different nodes. Table 2 shows the top ten countries with r of 1, 3, 5, 7, and 10 in terms of transmission scale. As the ratio increases, the proportion of affected countries increases gradually. When the ratio is 1, the burst source does not affect the entire network. When the ratio is 3, the network suffers only a slight shock, Guinea and China influence more than 100 countries when the ratio exceeds five. Compared with the top 2 or 3 countries, the influence of other countries on the network is rapidly reduced. For example, Turkey ranks seventh but only affects 36 countries, showing that several countries dominate the aluminum ore trade network. The market share of other countries is relatively low.
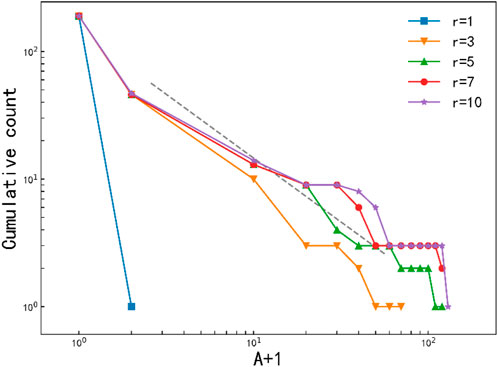
FIGURE 8. Avalanche size distribution. Note: This graph represents the number of countries with cumulative avalanche sizes equal to or greater than A. The horizontal axis is shifted by 1 to plot countries with A = 0 on a logarithmic scale.
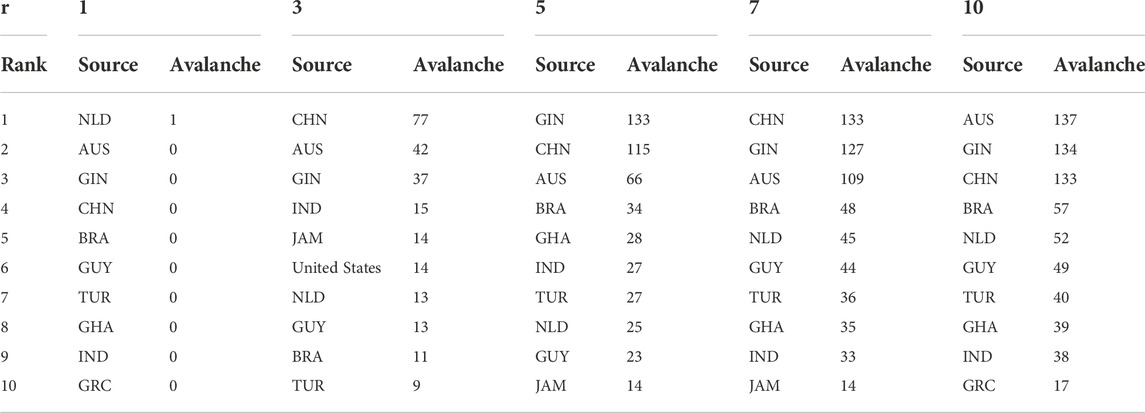
TABLE 2. Ranking of sources for different ε/β ratios.
To gain insight into the risk propagation process, this paper selects ɛ = 0.2; ɛ/β = 7 as the analysis basis to explore the risk propagation paths of simulates each country in the trade network and selects four typical trading countries, Brazil, Guinea, Australia, and China as risk outbreak points. The article explores the risk propagation paths of these countries in the trade network. Table 3 shows the transmission scale of each round of these four countries. Figure 9 shows the transmission paths of these four countries. The study finds that Brazil, Guinea, Australia, and China present three different risk propagation characteristics.
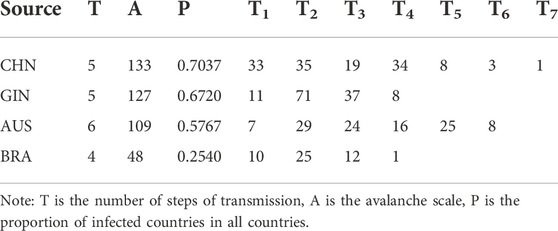
TABLE 3. Propagation rounds in China, Guinea, Australia, and Brazil.
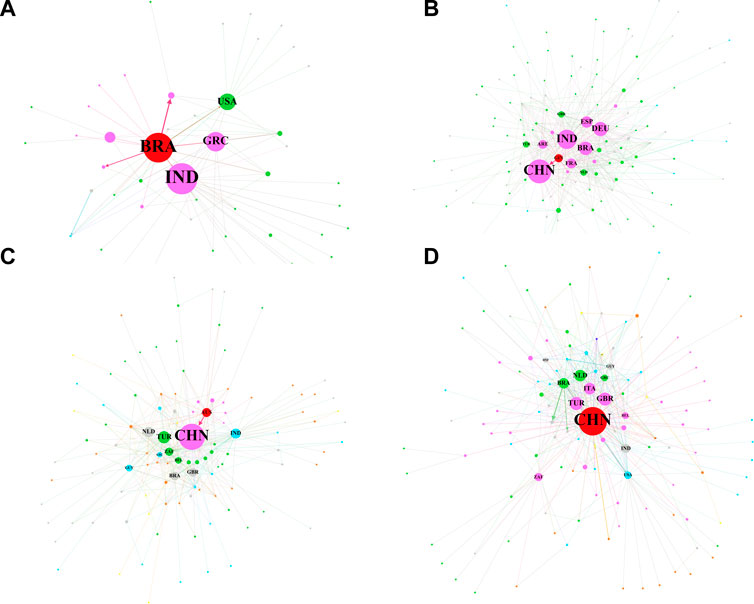
FIGURE 9. Risk propagation paths in Brazil, Guinea, Australia, and China. Note: the initial outbreak country is red, and the others, in order of avalanche, are purple, green, light blue, gray, orange, yellow, and blue. The node size represents the trading country’s output, and the edge’s thickness represents the trade volume of the trading country. Highlight the main countries of risk transmission.
Brazil has unique risk transmission characteristics. Figure 9A shows the transmission path of Brazil as the source of the outbreak. The main transmission occurred in the second cycle, accounting for 52.08% of the total infection (see Table 3). Brazil has more trade relations in the network and export trade relations with 47 countries. But except for India and Germany, the trade volume in imports is small. Therefore, when Brazil is the source of risk outbreak, the risk impact is small and cannot affect large-scale countries. The trade network soon leveled off, with the avalanche accumulating only 48 countries.
Unlike Brazil, as significant aluminum exporters ore, Guinea and Australia exhibit similar risk transmission characteristics. Figure 9B presents the risk spread profile in Guinea, affecting 127 countries. Guinea has a small trade relationship in the network, having export trade relations with only 19 countries. But Guinea has close ties with core countries such as China, Brazil, India, and Germany, which account for 29%, 27%, 40%, and 86% of their imports, respectively. After four iterations, no new risk contagion countries appear in the network, and the trade network is stable. The first iteration of risk propagation affected only 11 countries. As more core countries are in trade, they will be involved in the second round of transmission from these core countries, and the risk will spread to the surrounding countries quickly. Avalanche’s national cumulative for the first two rounds is about 64.57%. Figure 9C shows the characteristics of risk transmission in Australia. Australia has almost the same number of trading relationships in the trade network as Guinea. However, there are fewer core trading nations linked to Australia. However, with fewer core trading countries connecting to Australia, China is the main affected country, and the collapse of China mainly causes the subsequent spread. The avalanche process in Australia has been stable after affecting 109 countries for six iterations. The first round of risk transmission affected only seven countries. Risks slowly spread to neighboring countries because of trade relations with core countries. The cumulative amount of avalanches in the country in the first two rounds was only 33.03%. As the number of iterations increased, more than 92.66% of countries fell into an avalanche after the fifth transmission. The risk almost spread to the entire network.
Figure 9D shows the characteristics of risk transmission in China. Unlike the above two modes of communication, China has many trade relations, with as many as 78 exporting countries. But China is not a significant producer of aluminum ore, exporting less than Brazil, Guinea, and Australia, and is positioned more as a “transit country”. Most countries connected with China are non-core countries, and their trade relationship is relatively single and highly dependent. Most of these countries will collapse when China collapses as the initial outbreak country. With the collapse of China, seven iterations took place, affecting 133 countries. China has more average number of infected countries per round. The first round of avalanches involved 33 countries, accounting for 24.81% of the affected countries. By the end of the fourth transmission, the risk had spread almost to the entire network. More countries are affected in each round of risk transmission. As the source of risk outbreak, China mainly affects countries with fragile trade structures in the trade network. These countries dominate the trade network. Therefore, the transmission of risk in China has the characteristics of fast transmission speed and a wide range of influence.
The above analysis shows that the infected countries are not necessarily directly connected to the source of the outbreak. Some countries have no trade relationship with the outbreak’s source but are infected. Avalanches in Guinea and Australia follow a similar pattern. Through indirect transmission, the risk outbreak source can infect countries with no directly linked. This approach will speed up the crisis spread. To identify the important role of indirect transmission in risk diffusion, this paper adopts the classification method proposed by Lee et al. to divide the infected countries into three parts: 1) direct infection, in the first round of direct infection, countries infected by the source of infection; 2) multi-step infection, countries with a trade relationship with the source of the outbreak, but not infected in the first round; 3) indirect infection, countries with no trade relationship with the source of the outbreak, but infected countries. Figure 10 shows that Guinea, Australia, and Brazil’s indirect infections account for a large proportion of the overall avalanche size. The proportions are 86%, 83%, and 60%, respectively. China’s ratio is 45% less than these three countries, indicating the avalanche process of Guinea, Australia, and Brazil’s propagation mainly through the intermediate countries. Meanwhile, China mainly affects countries with direct trade relations. These different propagation modes imply that the spread of supply crises exhibits a highly complex network nature.
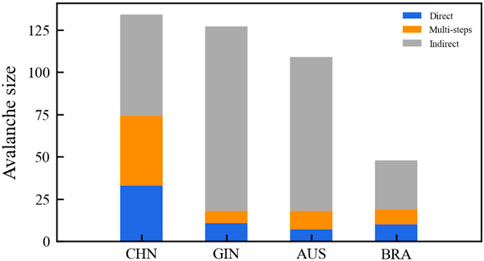
FIGURE 10. Avalanche profiles. A bar plot showing the avalanche profile of four countries’ avalanche sizes is displayed. The avalanche process is divided into three parts. CHN, GIN, AUS, and BRA represent China, Guinea, Australia, and Brazil, respectively.
6 Conclusion and suggestions
By constructing the global aluminum ore trade network, this paper analyzes the dynamic structural evolution of aluminum trade network from 2011 to 2020, including the overall characteristics, geographical characteristics and trade communities. Based on evolution analysis, the competition network is constructed to explore the competition patterns of aluminum trade. Furthermore, the avalanche process from four key economies due to supply interruption is simulated by cascading failure model. The main conclusions are as follows:
1) The global aluminum ore trading countries and trade relations are relatively stable. The export relationship between trading countries is far greater than the import relationship. Trade relations show a three-stage change and diversified development trend. In the evolution process of the aluminum ore trade, it belongs to a relatively stable community type. Community categories in several countries change frequently. This will affect the stability of the trade network, leading to higher potential risks.
2) The exports barycenter is between Guinea and Australia, and the imports barycenter is gradually shifting from European countries to Asian countries, mainly dominated by China. The change in the direction of space trade reflects that the aluminum resource industry in Asia is not yet perfect, and active policies are being introduced to promote industrial development. The import competition of the global aluminum ore trade is relatively stable, and the intensity of competition among regions is gradually rising. The main areas of competition are within Europe, Asia, and between Asia and the Americas. China and other Asian countries dominate the intensity of competition.
3) Brazil, Guinea, Australia, and China are four specific trading countries. Risk outbreak has three particular characteristics. Guinea and Australia, as the largest aluminum ore exporters, and China, as the largest aluminum ore importer and transshipment country (the largest trade relationship), would both have a significant impact on the entire trade network in the event of their collapse, with Brazil in between with a lower propagation and rounds than them. In addition, Guinea and Australia both transmit risks through China, and the collapse of China itself also has a significant impact, indicating that China plays a key role in transmitting risk to the aluminum ore trade network.
The aluminum international trade market is facing both opportunities and challenges. Once the trade supply is interrupted, how to take measures to mitigate the impact will be the focus of future research. This paper provides suggestions for maintaining the stable development of the aluminum resource trade system. Expanding import channels is an effective way to reduce potential risks. Strengthening cross-social trade cooperation can enhance resilience to threats. The country should pay close attention to those countries with frequent changes in community categories to improve the stability of the aluminum mining trade. Governments should establish trade relations and links with potential alternatives to aluminum resources. Meanwhile, indirect infection plays a vital role in risk transmission. To better manage the risk of aluminum resources, the country should attach great importance to the indirect risk sources and constantly improve its ability to resist the threat.
Data availability statement
The original contributions presented in the study are included in the article/Supplementary Material, further inquiries can be directed to the corresponding author.
Author contributions
YW wrote the original manuscript. XW and NT performed the data collection and treatment. LC contributed to the conception of the study. XK reviewed and revised the manuscript. All authors commented on previous versions of the manuscript and all authors read and approved the final manuscript.
Conflict of interest
The authors declare that the research was conducted in the absence of any commercial or financial relationships that could be construed as a potential conflict of interest.
Publisher’s note
All claims expressed in this article are solely those of the authors and do not necessarily represent those of their affiliated organizations, or those of the publisher, the editors and the reviewers. Any product that may be evaluated in this article, or claim that may be made by its manufacturer, is not guaranteed or endorsed by the publisher.
Supplementary material
The Supplementary Material for this article can be found online at: https://www.frontiersin.org/articles/10.3389/fenrg.2022.1048186/full#supplementary-material
References
Balassa, B. (1965). Trade liberalisation and “revealed” comparative advantage. Manch. Sch. 33 (2), 99–123. doi:10.1111/j.1467-9957.1965.tb00050.x
Blondel, V. D., Guillaume, J. L., Lambiotte, R., and Lefebvre, E. (2008). Fast unfolding of communities in large networks. J. Stat. Mech. 2008 (10), P10008. doi:10.1088/1742-5468/2008/10/P10008
Cao, J., Wen, F., Zhang, Y., Yin, Z., and Zhang, Y. (2022). Idiosyncratic volatility and stock price crash risk: Evidence from China. Finance Res. Lett. 44, 102095. doi:10.1016/j.frl.2021.102095
Cheewatrakoolpong, K., and Manprasert, S. (2014). Trade linkages and crisis spillovers. Asian Econ. Pap. 13 (1), 84–103. doi:10.1162/ASEP_a_00253
Chen, G., Kong, R., and Wang, Y. (2020). Research on the evolution of lithium trade communities based on the complex network. Phys. A Stat. Mech. its Appl. 540, 123002. doi:10.1016/j.physa.2019.123002
Chen, W. Q., and Graedel, T. E. (2012). Dynamic analysis of aluminum stocks and flows in the United States: 1900-2009. Ecol. Econ. 81, 92–102. doi:10.1016/j.ecolecon.2012.06.008
Chen, W. Q., and Shi, L. (2012). Analysis of aluminum stocks and flows in mainland China from 1950 to 2009: Exploring the dynamics driving the rapid increase in China’s aluminum production. Resour. Conservation Recycl. 65, 18–28. doi:10.1016/j.resconrec.2012.05.003
Chen, Z., An, H., An, F., Guan, Q., and Hao, X. (2018). Structural risk evaluation of global gas trade by a network-based dynamics simulation model. Energy 159, 457–471. doi:10.1016/j.energy.2018.06.166
David, E., and Kopac, J. (2018). Toxic compounds generated by metalworking fluids and aluminum slag landfill and their effects on environment and people. Environ. Eng. Manag. J. 17 (3), 739–748. doi:10.30638/eemj.2018.074
Egging, R., and Holz, F. (2016). Risks in global natural gas markets: Investment, hedging and trade. Energy Policy 94, 468–479. doi:10.1016/j.enpol.2016.02.016
Fan, X., Li, X., Yin, J., and Liang, J. (2019). Temporal characteristics and spatial homogeneity of virtual water trade: A complex network analysis. Water Resour. manage. 33 (4), 1467–1480. doi:10.1007/s11269-019-2199-2
Gaustad, G., Olivetti, E., and Kirchain, R. (2012). Improving aluminum recycling: A survey of sorting and impurity removal technologies. Resour. Conservation Recycl. 58, 79–87. doi:10.1016/j.resconrec.2011.10.010
Gephart, J. A., Rovenskaya, E., Dieckmann, U., Pace, M. L., and Brannstrom, A. (2016). Vulnerability to shocks in the global seafood trade network. Environ. Res. Lett. 11 (3), 035008. doi:10.1088/1748-9326/11/3/035008
Hao, X., Sun, X., and Zhong, W. (2018). The import competition relationship and intensity in the international iron ore trade: From network perspective. Resour. Policy 57 (26), 45–54. doi:10.1016/j.resourpol.2018.01.005
Hou, W., Liu, H., Wang, H., and Wu, F. (2018). Structure and patterns of the international rare earths trade: A complex network analysis. Resour. Policy 55, 133–142. doi:10.1016/j.resourpol.2017.11.008
Hu, X., Wang, C., Lim, M. K., and Koh, S. L. (2020). Characteristics and community evolution patterns of the international scrap metal trade. J. Clean. Prod. 243, 118576. doi:10.1016/j.jclepro.2019.118576
Hu, X., Wang, C., Zhu, X., Yao, C., and Ghadimi, P. (2021). Trade structure and risk transmission in the international automotive Li-ion batteries trade. Resour. Conservation Recycl. 170, 105591. doi:10.1016/j.resconrec.2021.105591
Ji, C. (2019). Permanence of a regime-switching malaria transmission model. Phys. A Stat. Mech. its Appl. 523, 222–233. doi:10.1016/j.physa.2019.02.027
Lee, K. M., and Goh, K. I. (2016). Strength of weak layers in cascading failures on multiplex networks: Case of the international trade network. Sci. Rep. 6, 26346–26349. doi:10.1038/srep26346
Lee, K. M., Yang, J. S., Kim, G., Lee, J., Goh, K. I., and Kim, I. m. (2011). Impact of the topology of global macroeconomic network on the spreading of economic crises. PLoS ONE 6 (3), e18443. doi:10.1371/journal.pone.0018443
Liu, C., Xu, J., and Zhang, H. (2020). Competitiveness or complementarity? A dynamic network analysis of international agri-trade along the belt and road. Appl. Spat. Anal. Policy 13 (2), 349–374. doi:10.1007/s12061-019-09307-5
Recalde, K., Wang, J., and Graedel, T. E. (2008). Aluminium in-use stocks in the state of Connecticut. Resour. Conservation Recycl. 52 (11), 1271–1282. doi:10.1016/j.resconrec.2008.07.006
Ren, X., Li, Y., yan, C., Wen, F., and Lu, Z. (2022). The interrelationship between the carbon market and the green bonds market: Evidence from wavelet quantile-on-quantile method. Technol. Forecast. Soc. Change 179, 121611. doi:10.1016/j.techfore.2022.121611
Sciarra, C., Chiarotti, G., Ridolfi, L., and Laio, F. (2020). Reconciling contrasting views on economic complexity. Nat. Commun. 11 (1), 3352–3410. doi:10.1038/s41467-020-16992-1
Shao, L., Hu, J., and Zhang, H. (2021). Evolution of global lithium competition network pattern and its influence factors. Resour. Policy 74, 102353. doi:10.1016/j.resourpol.2021.102353
Sun, Q., Gao, X., Zhong, W., and Liu, N. (2017). The stability of the international oil trade network from short-term and long-term perspectives. Phys. A Stat. Mech. its Appl. 482, 345–356. doi:10.1016/j.physa.2017.04.047
Sun, X., Shi, Q., and Hao, X. (2022). Supply crisis propagation in the global cobalt trade network. Resour. Conservation Recycl. 179, 106035. doi:10.1016/j.resconrec.2021.106035
Traag, V. A., Waltman, L., and van Eck, N. J. (2019). From Louvain to leiden: Guaranteeing well-connected communities. Sci. Rep. 9 (1), 5233–5312. doi:10.1038/s41598-019-41695-z
Vu, T. T. H., Tian, , Khan, , Zada, , Zhang, , and Nguyen, (2019). Evaluating the international competitiveness of Vietnam wood processing industry by combining the variation coefficient and the entropy method. Forests 10 (10), 901. doi:10.3390/f10100901
Wang, C., Huang, X., Hu, X., Zhao, L., Liu, C., and Ghadimi, P. (2021). Trade characteristics, competition patterns and COVID-19 related shock propagation in the global solar photovoltaic cell trade. Appl. Energy 290, 116744. doi:10.1016/j.apenergy.2021.116744
Wang, C., Huang, X., Lim, M. K., Tseng, M. L., and Ghadimi, P. (2020). Mapping the structural evolution in the global scrap copper trade network. J. Clean. Prod. 275, 122934. doi:10.1016/j.jclepro.2020.122934
Wang, C., Zhao, L., Lim, M. K., Chen, W. Q., and Sutherland, J. W. (2020). Structure of the global plastic waste trade network and the impact of China’s import Ban. Resour. Conservation Recycl. 153, 104591. doi:10.1016/j.resconrec.2019.104591
Wang, X., Li, H., Yao, H., Chen, Z., and Guan, Q. (2019). Network feature and influence factors of global nature graphite trade competition. Resour. Policy 60, 153–161. doi:10.1016/j.resourpol.2018.12.012
Wang, X., Li, H., Yao, H., Zhu, D., and Liu, N. (2018). Simulation analysis of the spread of a supply crisis based on the global natural graphite trade network. Resour. Policy 59, 200–209. doi:10.1016/j.resourpol.2018.07.002
Wen, F., Tong, X., and Ren, X. (2022). Gold or Bitcoin, which is the safe haven during the COVID-19 pandemic? Int. Rev. Financial Analysis 81, 102121. doi:10.1016/j.irfa.2022.102121
Wenli, W., and Yaowen, X. (2009). Simulating risk of information sharing of node entities in supply chain complex network. J. Syst. Simul. 21 (19), 6276–6279. doi:10.16182/j.cnki.joss.2009.19.063
Yi, X., Lu, Y., He, G., Li, H., Chen, C., and Cui, H. (2022). Global carbon transfer and emissions of aluminum production and consumption. J. Clean. Prod. 362, 132513. doi:10.1016/j.jclepro.2022.132513
Zhang, H., Wang, X., Tang, J., and Guo, Y. (2022). The impact of international rare Earth trade competition on global value chain upgrading from the industrial chain perspective. Ecol. Econ. 198, 107472. doi:10.1016/j.ecolecon.2022.107472
Zhang, H. Y., Ji, Q., and Fan, Y. (2014). Competition, transmission and pattern evolution: A network analysis of global oil trade. Energy Policy 73, 312–322. doi:10.1016/j.enpol.2014.06.020
Zheng, Y., Wen, F., Deng, H., and Zeng, A. (2022). The relationship between carbon market attention and the EU CET market: Evidence from different market conditions. Finance Res. Lett. 50, 103140. doi:10.1016/j.frl.2022.103140
Keywords: aluminum ore trade, complex network model, cascading failure model, risk propagation, trade stability
Citation: Wang Y, Chen L, Wang X, Tang N and Kang X (2023) Trade network characteristics, competitive patterns, and potential risk shock propagation in global aluminum ore trade. Front. Energy Res. 10:1048186. doi: 10.3389/fenrg.2022.1048186
Received: 19 September 2022; Accepted: 28 October 2022;
Published: 12 January 2023.
Edited by:
Xiaohang Ren, Central South University, ChinaCopyright © 2023 Wang, Chen, Wang, Tang and Kang. This is an open-access article distributed under the terms of the Creative Commons Attribution License (CC BY). The use, distribution or reproduction in other forums is permitted, provided the original author(s) and the copyright owner(s) are credited and that the original publication in this journal is cited, in accordance with accepted academic practice. No use, distribution or reproduction is permitted which does not comply with these terms.
*Correspondence: Xinyu Kang, a2FuZ3hpbnl1QHN0dS5jZHV0LmVkdS5jbg==