 Bixing Ren
 Qiang Li1,2
95% of researchers rate our articles as excellent or good
Learn more about the work of our research integrity team to safeguard the quality of each article we publish.
Find out more
ORIGINAL RESEARCH article
Front. Energy Res. , 25 January 2023
Sec. Smart Grids
Volume 10 - 2022 | https://doi.org/10.3389/fenrg.2022.1047624
This article is part of the Research Topic Increasing Penetration of Renewable Sources in Power Systems: Opportunities and Challenges View all 18 articles
In recent years, sub-synchronous oscillation incidents have been reported to happen globally, which seriously threatens the safe and stable operation of the power system. It is difficult to locate the oscillation source in practice using the parameterized model of open-loop modal resonance. Therefore, this paper aims at the problem of oscillation instability caused by the interaction between the multiple voltage source converters in the wind farm grid-connected system, proposes a method for locating the oscillation source of a wind farm using measurement data based on the transfer learning algorithm of transfer component analysis. At the same time, in order to solve the problem of the lack of oscillation data and the inability to label in the real system, a simplified simulation system was proposed to generate large batches of labeled training samples. Then, the common features of the samples from simulation system and the real system were learned through the transfer component analysis algorithm. Afterward, a classifier was trained to classify samples with common features. Finally, two grid-connected wind farms with VSC access are used to verify that the proposed method has good locating performance. This has important reference value for the practical application of power grid dispatching and operation using measurement to identify oscillation sources.
In recent years, as renewable energy has become more and more dominant in the power grid, various new Flexible Alternative Current Transmission Systems (FACTS) devices including Voltage Sourced Converter (VSC) have been continuously connected. Through flexible power flow, voltage regulation and reactive power compensation technology, the optimal allocation of resources in a wider range can be realized (CHEN and JIANG, 2017; GAO et al., 2020; MA et al., 2020).
However, some studies have shown that the interaction between VSCs or between VSCs and the synchronous generator shafting is easy to cause oscillation instability (SONG et al., 2017; Chen et al., 2018). For example, in (ZHOU et al., 2018), the static synchronous compensator (STATCOM) is prone to strong dynamic interactions with the control loop of the wind generator. (REN et al., 2020). discusses the possible interaction between the Unified Power Flow Controller (UPFC) and the synchronous generator shafting. It can be found that the internal structures of UPFC and STATCOM are both VSC-controlled devices. Therefore, when wind farms use such VSC-controlled power conversion devices to connect to the power grid, there is a risk of oscillation and instability due to dynamic interaction. It has become a hot research issue to locate the wind farm with improper control parameters (the accidental wind farm, also known as the oscillation source) and take targeted suppression measures in time.
The research on the localization of oscillation sources mainly based on mechanism analysis and damping control has been fully developed in the past 10 years, but most of them are aimed at the localization of low-frequency oscillation sources (WANG and SUN, 2017; WU et al., 2018). However, in recent years, there have been many reports on sub-synchronous oscillation (SSO) of wind farms (WANG et al., 2020; XUE et al., 2020). In order to quickly locate the SSO oscillation source, measurement-based methods led by the energy method and the impedance method have emerged (ZHENG et al., 2016; XU, 2018). Calculate the total energy and amplitude of the system, and then judge the contribution of the energy-consuming components to the oscillation attenuation, so as to realize the method of locating the SSO oscillation source; (Ma et al., 2021); adopts the method of combining real-time monitoring data and aggregated impedance model, and proposes sub-synchronization Oscillation stability evaluation index and oscillation traceability method. Obviously, the above methods are either numerical algorithms based on parametric models, or nested numerical methods based on signal parameter identification algorithms. The common point is that they all need to derive numerical calculation models for specific problems. Therefore, there will inevitably be time delays when these methods are applied online. In addition, because the concept of energy is not clearly defined in many components, and the impedance method is greatly affected by noise, if the resonant frequency point is inaccurate, the equivalent impedance calculation will be inaccurate, which will further affect the positioning accuracy of the model.
In recent years, artificial intelligence technology has become an emerging effective method by virtue of the advantages of data sample-based and weakened mechanism modeling (Zhu et al., 2017; HUANG et al., 2019; YANG B et al., 2020), but the research on the localization method of sub-synchronous oscillation sources in wind farms is still insufficient (Yao et al., 2021). For example, (Shuang et al., 2020), once proposed the method of model transfer to transfer the VGG16 grid to the localization of the forced power oscillation source, and obtained high localization accuracy. Limited to the VGG16 model and training samples, this model is not necessarily more suitable for the SSO sub-synchronous oscillation source localization problem. Therefore, the adaptability of the proposed method and the generalization from the training system to the actual system are still insufficient. However, based on the feature transfer method in (CHEN et al., 2021), the characteristics of the simulation system are transferred to the actual system, and the sub-synchronous oscillation source induced by the resonance of a single synchronous machine and a single fan in the wind-fire baling system is located. However, considering that this method requires measurement at the port of each wind turbine, and the actual wind farm has hundreds or thousands of wind turbines, the coverage of the measurement points is very high, and the possibility of practical application needs to be further verified. In addition, in engineering practice, the computer used for computing usually does not have a computing GPU, so it is difficult to meet the hardware conditions required for building a complex deep learning grid.
In order to solve the above problems based on deep learning methods, this paper proposes a method for locating sub-synchronous oscillation sources of wind farms based on transfer component analysis (TCA) based on the engineering practice of wind farms. In this method, TCA is used to extract the features of the measurement data, and a simple classifier is used to locate the oscillation source. Compared with other deep learning methods, this method has fast calculation speed, high positioning accuracy, and low requirements on computer hardware, which is more suitable for practical applications in wind farm engineering.
FACTS devices are often installed in the grid-connected system of wind farms to adjust the system power flow or provide reactive power compensation. However, studies have demonstrated (ZHOU et al., 2018; REN et al., 2020) that such VSC-type FACTS devices can interact dynamically with wind farms. In order to study the oscillation source in the actual wind farm, as shown in Figure 1, two typical wind farm grid-connected systems equipped with FACTS devices are given. Among them, Figure 1A is a system equipped with a series-parallel combined UPFC; Figure 1B is a system equipped with STATCOM, its structure contains a single-ended VSC, so the connection method is usually connected in parallel; among them, the system of wind farm is formed by the aggregation of N1 wind farms, through the bus W Assemble and send.
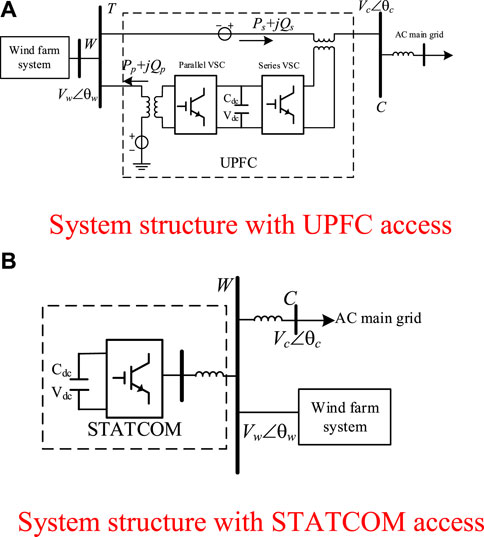
FIGURE 1. Schematic of hybrid power system with VSC. (A) System structure with UPFC access .(B) System structure with STATCOM access
The open-loop mode resonance modeling method (REN et al., 2020) is to take the output power of the wind farm as a node at a certain operating point, and divide the system in Figure 1 into the open-loop subsystem of the wind farm to be studied and the remaining systems (including other VSC-type devices and All components of the AC main grid) are two parts, and the transfer function can be expressed as:
Among them,
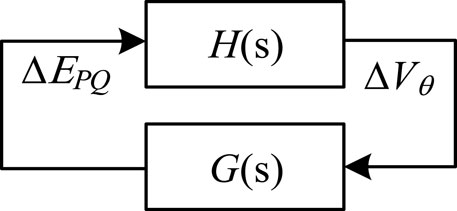
FIGURE 2. Closed-loop interconnected linearized models of multi-wind-turbine power system with VSC.
The wind farm system and the remaining system constitute an interconnected system. According to the open-loop mode resonance theory (WANG et al., 2019), the influence of the wind farm on the system is mainly caused by the interaction between its control system and the remaining control system, which causes the mode change of the closed-loop system, that is, The mode of H(s) interacts with the mode of G(s), which will affect the changes of input and output variables
The steps of calculating the system oscillation source according to the parametric model can be summarized as follows: first, calculate the oscillation mode li of the state matrix As of the system, and the corresponding participation factor PFki; secondly, calculate the element corresponding to the mode with the largest participation factor |PFki|, which is the participation interaction element to determine the element as an oscillation source. Due to engineering practice, it is difficult to measure at the grid-connected location of each wind turbine. Usually, monitoring is performed in units of a line or a wind farm. Therefore, the wind farm is used as a unit here, and a wind farm is regarded as an element. Denote the oscillation source yn as the number of the wind farm participating in the dynamic interaction of the system, then there is a function g between the oscillation source
From this, it can be seen that the relationship between the measurable measurement ΔEPQ and ΔVθ and the label of the oscillation source can be expressed as:
Therefore, the relational modeling of Eq. 5 can be extended to machine learning problems, where the function g (⋅) is the relational expression of the oscillation source localization model, the input of the machine learning function g (⋅) is the measurement data sample, and the output is the oscillation source tag.
At the same time, based on the open-loop mode resonance theory, it is easy to obtain the measurement data of the grid-connected port of the wind farm under different operating conditions by offline simulation. The nth sample measurement data obtained is recorded as
The TCA method belongs to a feature-based transfer learning method (Yang Q et al., 2020), which learns a pair of mapping functions from the source domain and the target domain. The classifier is retrained, and finally the prediction of the classifier is performed. Therefore, measures of data distribution can be used to narrow the distribution differences between different data domains, enabling transfer learning, as shown in Figure 3.
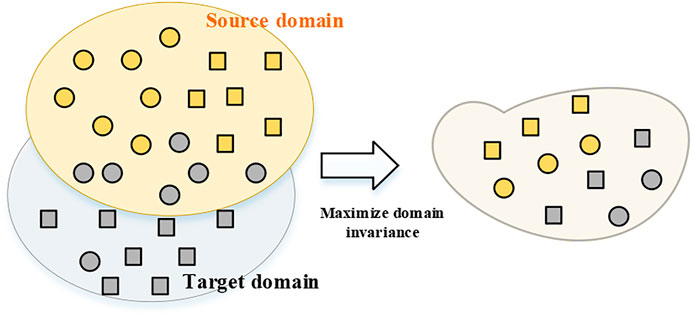
FIGURE 3. Schematic of feature-based transfer learning.
In the power system, the data samples obtained by the simulated system and the actual system are quite different because their distributions are not the same. Therefore, the most critical step in transfer learning is to reduce the distribution difference of the data samples obtained by the simulated system and the actual system. Let the simulation system be the source domain and the actual system be the target domain, where the source domain is a labeled system, denoted as Ds = {(X1, Y1),…, (Xn, Yn)}; and the target domain is an unlabeled system, Denoted as Dt = {Xn+1, … , Xn+m}. Currently, the most widely used measure of domain distribution discrepancy is the Maximum Mean Discrepancy (MMD) (Yang Q et al., 2020) measure. MMD is a non-parametric measure used to measure the distance between distributions based on kernel embeddings in the regenerated kernel HilBert space, the MMD distance formula is as follows:
Where, ϕ: x→H represents the infinite order non-linear feature map in the kernel space, ns and nt represent the sample length respectively; By using the kernel function, Eq. 6 can be simplified as:
Among them, K is a composite kernel matrix composed of kernel matrices in the source domain, target domain and intersection domain, and k in each domain is the kernel function corresponding to ϕ, satisfying < ϕ xi), ϕ (xj) ≥ k (xi, xj),<⋅> represents the inner product of two functions. L represents the sample size matrix, see (Yang B et al., 2020) for the detailed definition.
Since the kernel function k in Eq. 7 may be a highly non-linear form of the mapping function, and the function ϕ x) is also unknown, the TCA method decomposes the kernel matrix in the equation to obtain the following optimization problem:
Among them, H is a centering matrix, the first term of the objective function is to minimize the MMD distance between the mapped source and target domain data, the second term is the regularization term for W, and the constraint is to maximize the variance of the data after mapping.
The W obtained by the final calculation contains the m main feature vectors of
According to the above TCA algorithm, the data-driven wind farm sub-synchronous oscillation source localization model in the actual system is established, that is, the relationship between the common features and the classification labels is fitted.
In this paper, the Softmax classifier is combined with the transfer learning algorithm to construct a deep transfer learning framework to establish a sub-synchronous oscillation source localization model. Applying the Softmax classifier on the obtained new source domain feature space realizes the relational modeling of Eq. 5. To sum up, the transfer model learning framework form based on TCA metric can be expressed as:
where gsoft = wTϕ represents the predicted output classifier function. In order to facilitate the function training, the CNN structure is used for the classification and identification of the common feature space, that is, the above gsoft representation function is replaced by a CNN grid with weight parameters, and the final location model of the wind farm sub-synchronous oscillation source is a CNN grid model.
The specific scheme of model construction is mainly divided into three parts: system construction and data sample acquisition, offline model training, and online application testing, as shown in Figure 4.
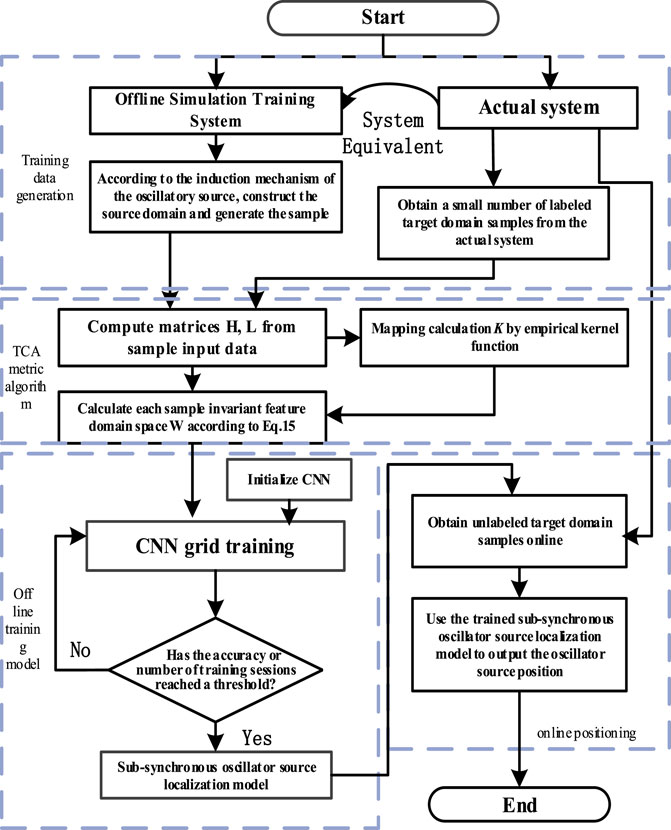
FIGURE 4. Single-machine equivalent model of the grid-connected wind farm.
The details are as follows:
1) Simulation system construction and data sample generation:
The source domain training data required for offline learning can be obtained from the following two aspects: First, based on the power system equivalence theory (DONG et al., 2021), a simulation system is built (the equivalent system is used to generate source domain training samples). According to the open-loop mode resonance theory, the control parameters of the open-loop subsystem are set so that the system may have open-loop mode resonance in the target range. Combined with various possible topological structures, operation modes, fault types, fault locations and disturbance accidents of the system, time-domain simulation is carried out, and the power on the grid-connected connection lines of all wind farms and the node voltage composition data of the grid-connected ports of the wind farm are collected as sample Xs, and according to the system parameterized state matrix, the label set Ys is constructed by calculating the participation factor labeling samples, and finally the source domain training sample Ds is formed. Since the transfer learning training data not only comes from the source domain, but also includes part of the data in the target domain. Therefore, the measured data Xt of the actual operation case records of the system in the past period of time are widely collected from the historical operation records of the system, and the data target domain is constructed as training sample Dt.
2) Feature extraction and localization learning of sub-synchronous oscillation source:
The obtained time series datasets Xs and Xt of the source and target domains are used as input, and the aforementioned TCA-based transfer learning method is used to extract the common features of the source and target domains. On this basis, a simple CNN with Softmax classifier is built. The grid is trained to perform classification learning on the extracted common features. Among them, the dimension of the input layer of the CNN model is determined by the number of columns of common features, the convolution pooling layer is set with two modules, the size of the convolution kernel is 5 × 5, and the size of the pooling kernel is set to 2 × 2. Connected to the Softmax classifier, the dimension of the output layer is determined by the label type. The model can combine the comprehensive statistical characteristics of the representative data samples to quickly establish a practical model for the location of oscillation sources through CNN.
3) Online application test:
During the online monitoring process, when the system has the risk of sub-synchronous oscillation, the measurement information in the 2s time window is collected in real time by the wind farm port of the system to form the target domain test sample. The sub-synchronous oscillation source location model is obtained through the above learning, and the feature extraction and corresponding oscillation source location are performed on the sample, and the current possible oscillation source wind farm number is quickly given. If the number is 0, it is determined that the system is stable, and the next monitoring is performed through the sliding time window; otherwise, an early warning signal is issued to facilitate the dispatcher to take control measures in time to prevent further deterioration of the oscillation. Considering that when the actual system is running, the operating state of the system is constantly changing. In order to improve the reliability of the model, in practical application, new target domain samples can be collected and constructed periodically, so as to repeat the above two steps of offline learning, so as to update Maintain a sub-synchronous oscillator source localization model.
This example analyzes the rationality of the training process of the method in this paper by designing a simulation case of open-loop mode resonance between the fan and the UPFC. The computer hardware configuration used in the experiment is: Intel core-i5-4570 CPU, 128G memory. Among them, the simulation system construction and data preprocessing were completed on Matlab 2019a, and the TCA and classifier models were built in the CPU version of Python 3.7 using the CNN architecture.
A wind farm grid-connected system with UPFC, its system structure is shown in Figure 5. Two of the wind farms each contain 20 direct-drive fans of the same type, which are collected through the bus W, and the power of the adjacent thermal power units is collected on the PCC bus. A 3-machine 9-node system is used to replace the AC main grid).
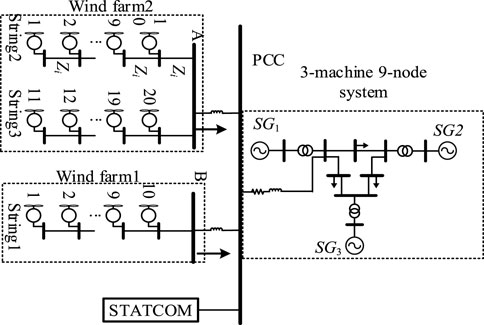
FIGURE 5. Real system structure of numerical example one.
As shown in Figure 5, take the wind farm grid connected system with UPFC system as an example, in which the SG4 model of direct drive wind turbine and the model of synchronous machine adopts the 15th order model and six mass block model given in document (Ren, 2019), and the 3-machine 9-node system adopts IEEE typical parameter settings.
Assuming that the wind turbine s in the wind farm 1 may interact dynamically with the UPFC, according to the open-loop mode resonance theory, the control parameters of the UPFC and the wind farm one in the actual system are adjusted to a state that is prone to interaction. Considering that different operating point conditions will affect the stability of the system, set the rated output of the wind farm and 80%–110% load to simulate the typical power flow mode of steady-state operation; simulate the disturbance with the sudden change of the wind turbine output and load, and set the disturbance amount to the rated value 80%–110% of the value/initial value, the duration of the disturbance is 100 m. The sampling window length and frequency are 2s and 1,000 Hz, respectively. Record the U/P/Q on the wind farm one and wind farm two port lines. On the basis of these simulation settings, Matlab is used for batch simulation, 200 cases are generated, and unlabeled training samples in the target domain are formed.
According to the implementation process of the sub-synchronous oscillation source location method introduced in 1.2, for the actual system in Figure 5, based on the system equivalence theory, the wind farm is equivalent to a wind turbine, and the AC power grid is equivalent to a single-machine infinite system, and then a simulation system is built.
The open-loop mode resonance theory is used to analyze the stability of the system under actual operating conditions in the simulation system. The specific method is: according to the operation mode in the actual system, set the operation point in the simulation system as ± 20% of the actual system operation point: The rated power of each unit is increased or decreased by 0–20%, and the load on the line is 80%–120% of the actual system operation. Then, according to the disturbance and frequency settings in the actual system, the time domain simulation is performed, and the measurement data Xs of the wind farm port is recorded. The state space equation of the parametric model of the simulation system is used to calculate the participation factor, and the sample data obtained by each simulation is marked to form the real label set Ys of the simulation system. Thus, training samples with labels are generated in large batches in the simulation system. Therefore, some unlabeled samples obtained in the above-mentioned actual system and the labeled samples obtained in the simulation system are unified to form training samples, and finally, 2,464 training samples of calculation example one are obtained. Figure 6 presents the system training sample feature representation obtained by t-SNE dimensionality reduction.
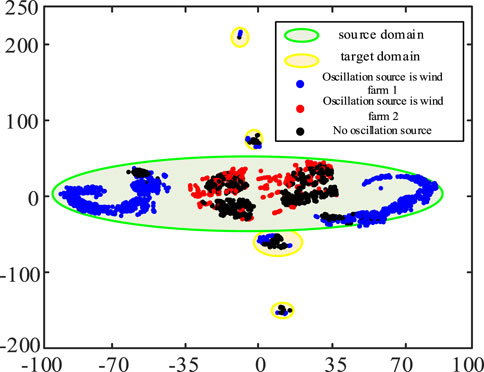
FIGURE 6. Features representation of training samples.
From the characteristic roots of the system generated under different oscillation sources in the example of Figure 6, the different oscillation sources are non-linear, and it is difficult to distinguish them by traditional methods.
In order to establish a localization model with better performance, it is hoped to clearly distinguish different oscillation source samples in the same domain. The source domain and the target domain are as similar as possible. Therefore, the TCA algorithm is used to perform feature learning on the training samples, so as to learn the common features of the source domain and the target domain. Figure 7 presents the t-SNE feature representation of the training samples after training using the TCA algorithm.
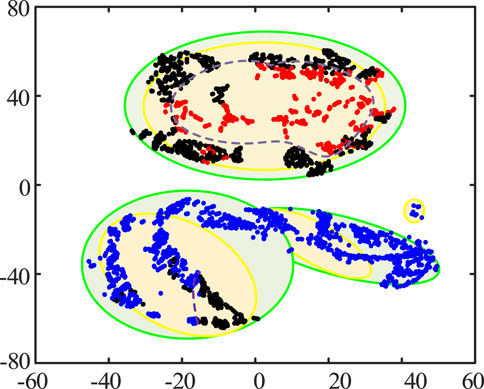
FIGURE 7. Membership function of each variable.
By comparing with Figure 6, it can be seen that the original training sample source domain and target domain are clearly demarcated, and different oscillation sources in the same domain are non-linear and inseparable. After TCA transformation, the source domain and the target domain appear common feature areas, and the boundaries of different oscillation sources in the same domain are gradually clear. This shows that TCA can realize feature learning for the training samples of oscillation source localization.
Considering that the TCA-transformed training samples are separable between different oscillation sources, as shown by the purple dotted line (the periphery of oscillation source in wind farm 2, shown as red dot in Figure 6) in Figure 7, the classification boundary line shows that the relationship between different oscillation sources is still non-linear, and the traditional linear Classifiers are still intractable. Therefore, a simple CNN grid with Softmax classifier needs to be adopted to achieve non-linear classification.
In the training process, in order to evaluate the performance of the model, the method of cross-validation is adopted, the training data is divided into training set and validation set for training, and the positioning accuracy index LAI is defined to evaluate the oscillating source positioning performance of the model:
Among them, the number of samples of the true prediction of wind farm 1 as an oscillation source is denoted as TN1; similarly, the number of samples of true prediction of wind farm n as an oscillation source is denoted as TNn. TO,FO,TS, FS represent the number of samples in the classification confusion matrix, respectively.
For the oscillation stability of the power system, both “misjudgment stability” and “missing judgment instability” will have a serious impact on the system. Therefore, this paper defines the precision rate (PR) and recall rate (RR) from the perspective of sample stability and instability. The classification discriminant index SCAI expressed comprehensively to evaluate the classification performance of the model for unstable samples:
Taking the above positioning accuracy index and classification discrimination index as the statistical indexes of model performance, Table.1 summarizes the training results of the model in the training process.
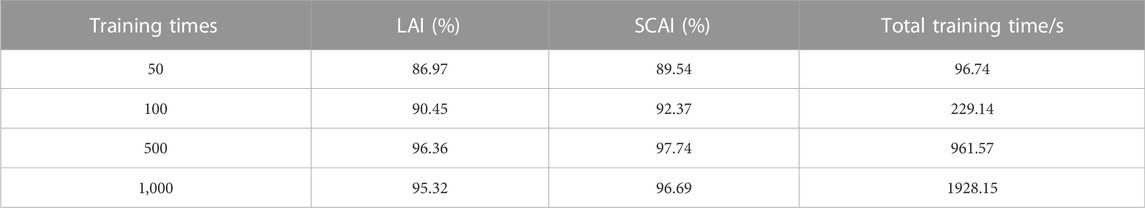
TABLE 1. Training results with different epochs.
It can be seen from the results in Table.1 that because the model is relatively simple, high positioning accuracy can be achieved after 100 times of training. If the number of training times is increased, the accuracy index of the model does not change much, which indicates that the model is stable and can be used for model migration testing. After 500 times of training, the accuracy index of the model has reached about 95%. When the training times continue to increase, the model accuracy index does not increase but decreases, which indicates that the model training has already reached saturation. Increasing the training times may make the model over fit. Therefore, a model trained 500 times is selected for saving.
The computer hardware and software configuration used in example one are the same. This example is simplified and generated by an actual offshore wind power system, and is mainly used to test the applicability of the method in this paper in different scenarios.
The structure of the example system is shown in Figure 8, which includes 30 direct drive fans belonging to two wind farms. Wind farm one is collected through bus B, and wind farm two is collected through bus A. finally, it is connected to the AC main grid with STATCOM through PCC bus. It is assumed that in the system shown in Figure 8, there is a risk of dynamic interaction between the wind turbines in the wind farm two and STATCOM.
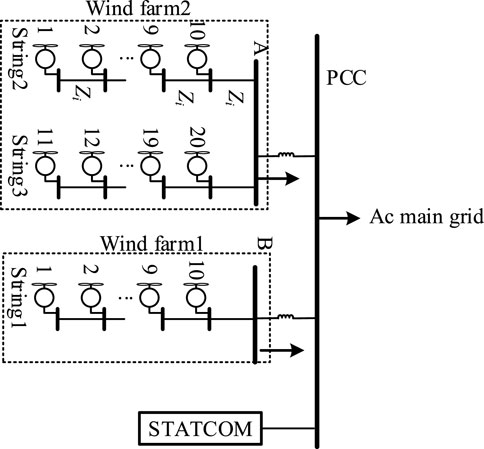
FIGURE 8. Real system structure of numerical example two.
Same as Example 1, in the actual system shown in Figure 8, the possible operating conditions in the system are comprehensively considered, and the output and load level of the wind farm under typical power flow mode are used as the basis for steady-state operation according to the operation mode provided by the system operator. Data; take the sudden change of the fan output and load as the disturbance, also set the duration of the small disturbance to 100 m, the sampling window length and frequency are 2s and 1000 Hz respectively. Based on the above simulation settings, time-domain simulations were performed at different operating points, and measurements were made at the grid-connected ports of two wind farms to generate 200 cases, which were recorded as unlabeled training samples.
Then, according to the training process in 3.2, the simplified simulation system of Figure 8 is used to generate a large batch of labeled training samples, and TCA is used to extract and transform the training samples, and train the classifier. Finally, save the positioning model of Example 2.
In order to verify the generalization of the model established by the method proposed in this paper, two sets of scenarios are designed according to the following rules in the actual system of the two examples to generate test samples:
Scenario 1: Simulate the measurement samples with noise in the actual system. The measurement data sampled in the actual system randomly increases the noise with the signal-to-noise ratio SNR = 10dB, and generates 200 samples for testing.
Scenario 2: Using the open-loop mode resonance theory, adjust the control parameters of the wind farm in the two examples (different from the parameters in the target domain training sample generation process), so that the system resonates between the wind farm and the UPFC (or STATCOM). A total of 200 samples are also obtained for testing.
In order to facilitate the calculation of the test accuracy of the model, the linearization equation of the actual system is used to label the samples in the process of generating the above test set. During the test, the measurement data of the grid-connected port of the wind farm is collected from each case by the method of active time window to simulate the online evaluation. For the models saved in the two examples, four groups of test sets were used for testing, and the test results are shown in Table.2.
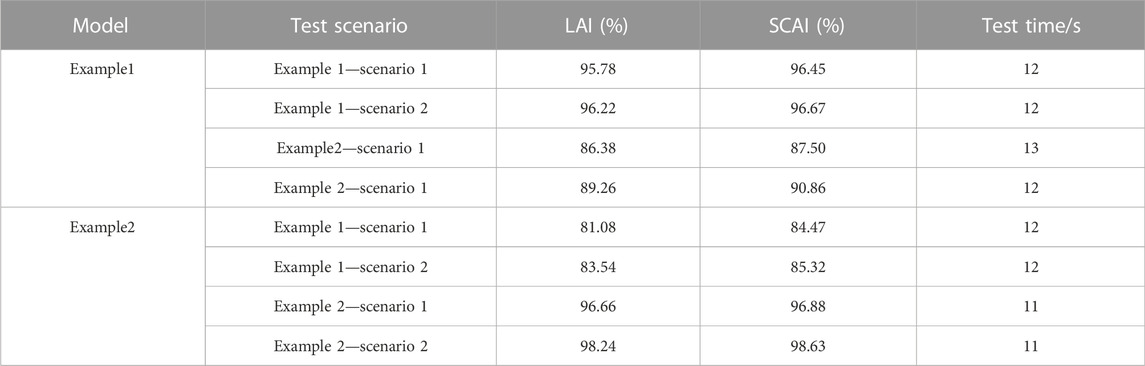
TABLE 2. Test results with two models.
It can be seen from Table.2 that the trained model can still achieve high positioning accuracy in different scenarios in the same system, indicating that the model has a certain generalization. However, from the perspective of the positioning accuracy of the model for different systems, although the model has a certain generalization ability, the extracted common features cannot be well applied between different systems, indicating that there are still differences in the characteristics of wind farm oscillation sources between different systems.
The test accuracy of samples containing noise decreases slightly, but the positioning accuracy can also be above 95% in the same system. It can be seen that even in the serious measurement error, the method in this paper still has strong robustness. Judging from the test time, the use of TCA algorithm for preprocessing does not have a great impact on the test time. The computing speed under the CPU can complete the discriminative positioning of any sample within 0.5 m, which proves that the method meets the requirements of online applications.
Quickly locating the sub-synchronous oscillation source of wind farm is very important to ensure the stability of wind farm grid-connected system. Compared with the traditional positioning method, the wind farm sub-synchronous oscillation source positioning method has higher requirements for rapidity and adaptability to different induced scenarios, and for the positioning accuracy, positioning to the wind farm is easier to operate in engineering practice. It can also meet the control requirements of the load during operation. Therefore, this paper presents a method for locating the oscillation source of wind farms under open-loop mode resonance conditions based on TCA transfer learning.
In this paper, the detailed implementation process of applying the method in a practical system is given, and the feasibility and applicability of the proposed method are analyzed from the aspects of training process and comparative test using two simplified wind farm system examples. The results show that the method in this paper can realize feature extraction and classification according to the measurement of wind farm ports, and shows high positioning accuracy and anti-noise ability when locating the oscillation source of the grid-connected system of multiple wind farms.
With the widespread access of new energy sources to the power grid and the large-scale application of power electronic devices in the power grid, the problem of sub-synchronous oscillation of wind farms has been paid more and more attention. The research results of this paper will lay the foundation for the grid monitoring and location analysis technology adapted to the stability of wind farms.
The original contributions presented in the study are included in the article/supplementary material, further inquiries can be directed to the corresponding author.
BR: Conceptualization, Funding acquisition, Methodology,Writing, Software, Validation QL: Project administration, Validation YJ: Investigation, Supervision QZ: Validation, Resources CW: Data Curation, Software XZ: Software, Investigation.
This work was supported by the Natural Science Foundation of Jiangsu Province (No. BK20210057).
Authors BR, QL, YJ, QZ, CW, and XZ were employed by the company Jiangsu Electric Power Test Research Institute Co., Ltd. Authors BR, QL, YJ, QZ, CW, and XZ were employed by the company State Grid Jiangsu Electric Power Company Ltd, Research Institute
All claims expressed in this article are solely those of the authors and do not necessarily represent those of their affiliated organizations, or those of the publisher, the editors and the reviewers. Any product that may be evaluated in this article, or claim that may be made by its manufacturer, is not guaranteed or endorsed by the publisher.
Chen, C., Du, W., Wang, H., et al. (2018). An examination of SSOs induced by grid-connected wind farms in power systems under near strong open-loop modal resonance [J]. Power Syst. Technol. 42 (09), 2778–2788.
Chen, J., Du, W., and Wang, H. (2021). A method of locating the power system sub-synchronous oscilla-tion source unit with grid-connected PMSG using deep transfer learning[J]. Trans. China Electrotech. Soc. 36 (01), 179–190.
Chen, Q., and Jiang, P. (2017). Mechanism and impact evaluation of strong dynamic interaction between UPFC and generator shaft [J]. Electr. Power Engi-neering Technol. 36 (02), 56–60.
Dong, W., Wang, Y., and Wang, H. (2021). Sin-gle-machine equivalent model of a group of wind turbine generators for small-signal stability analysis[J]. Power Syst. Technol. 45 (04), 1241–1250.
Gao, B., Wang, F., Yu, H., et al. (2020). The suppression method of wind power sub-synchronous oscillation using static synchronous series compensator [J]. Trans. China Electrotech. Soc. 35 (06), 1346–1356.
Huang, R., Du, W., and Wang, H. (2019). Short-term prediction of wind power considering turbulence intensity[J]. Power Syst. Technol. 43 (06), 1907–1914.
Ma, N., Xie, X., and He, J. (2020). “Review of wide-band oscillation in renewable and power elec-tronics highly integrated power systems[J],” in Proceedings of the CSEE, 4721–4731.4015
Ma, N., Xie, X., and Kang, P. (2021). Wide-area monitoring and analysis of sub-synchronous oscillation in power systems with high-penetration of wind power [J]. Proc. CSEE 41 (01), 65–74.
Pan, S. J., Tsang, I. W., Kwok, J. T., and Yang, Q. (2011). Domain adaptation via transfer component analysis. IEEE Trans. neural grids 22 (2), 199–210. doi:10.1109/tnn.2010.2091281
Ren, B., Du, W., and Wang, H. (2020). Mechanism and impact evaluation of strong dynamic interaction between UPFC and generator shaft [J]. Proc. CSEE 40 (04), 1117–1129+1404.
Ren, B. (2019). Impact of voltage source converter controlled power devices on power system dynamic interaction [D]. Beijing: North China Electric Power University.
Shuang, F., Chen, J., and Tang, Y. (2020). Location method of forced oscillation source based on SPWVD image and deep transfer learning[J]. Automation Electr. Power Syst. 44 (17), 78–91.
Song, R., Guo, J., and Li, B. (2017). Mecha-nism and characteristics of sub-synchronous oscillation in direct-drive wind power generation system based on input-admittance analysis [J]. Proc. CSEE 37 (16), 4662–4670+4891.
Wang, B., and Sun, K. (2017). Location methods of oscillation sources in power systems: A survey. J. Mod. Power Syst. Clean Energy 5 (2), 151–159. doi:10.1007/s40565-016-0216-5
Wang, Lichao, Yu, Yongjun, Zhang, Mingyuan, et al. (2020). Impedance model and analysis of sub-synchronous os-cillation influence factors for grid-connected full-converter wind turbines [J]. Electr. Power Engi-neering Technol. 39 (01), 170–177.
Wang, Y., Du, W., and Wang, H. (2019). Compar-ative analysis of negative-resistance effect and open-loop modal coupling in sub-synchronous control interaction problem[J]. Proc. CSEE 39 (S1), 225–234.
Wu, S., Xu, Y., Zhang, S., et al. (2018). Research on propagation characteristics and locating method of low frequency oscillations induced by turbine generator unit [J]. Power Syst. Technol. 42 (06), 1917–1921.
Xu, P. (2018). Study on sub-synchronous components PropagationPath and disturbance source location of wind power collection areas [D]. Beijing: North China Electric Power University.
Xue, A., Fu, X., and Qiao, D. (2020). Review and prospect of research on sub-synchronous oscillation mechanism for power system with wind power participation[J]. Electr. Power Autom. Equip. 40 (09), 118–128.
Yang, B., Du, W., and Wang, H. (2020). Equivalent modeling of virtual synchronous generator based on data-driven method[J]. Power Syst. Technol. 44 (01), 35–43.
Yang, Q., Zhang, Y., Dai, W., et al. (2020). Transfer learning[M]. Cambridge: United Kingdom:Cambridge University Press, 29–38.
Yao, M., Yu, Z., Lu, N., and Shi, D. (2021). Time series classification for locating forced oscillation sources. IEEE Trans. Smart Grid 12 (2), 1712–1721. doi:10.1109/tsg.2020.3028188
Yap, K. Y., Beh, C. M., and Sarimuthu, C. R. (2021). Fuzzy logic controller-based synchronverter in grid-connected solar power system with adaptive damping factor. Chin. J. Electr. Eng. 7 (2), 37–49. doi:10.23919/CJEE.2021.000014
Zheng, B., Shuang, F., and Wu, X. (2016). Localizing disturbance source of power system forced oscillation caused by wind power fluctuation[J]. Electr. Power Eng. Technol. 35 (05), 32–34+43.
Zhou, P., Guangfan, L., Song, R., et al. (2018). Sub-synchronous oscillation characteristics and interac-tions of direct drive permanent magnet synchronous generator and static var generator[J]. Proc. CSEE 38 (15), 4369–4378+4637.
Keywords: machine Learning, transfer component analysis (TCA), voltage source converter (VSC), oscillation source localization, mode resonance
Citation: Ren B, Li Q, Jia Y, Zhou Q, Wang C and Zou X (2023) A machine learning method for locating subsynchronous oscillation source of VSCs in wind farm induced by open-loop modal resonance based on measurement. Front. Energy Res. 10:1047624. doi: 10.3389/fenrg.2022.1047624
Received: 18 September 2022; Accepted: 12 December 2022;
Published: 25 January 2023.
Edited by:
Siqi Bu, Hong Kong Polytechnic University, Hong Kong SAR, ChinaCopyright © 2023 Ren, Li, Jia, Zhou, Wang and Zou. This is an open-access article distributed under the terms of the Creative Commons Attribution License (CC BY). The use, distribution or reproduction in other forums is permitted, provided the original author(s) and the copyright owner(s) are credited and that the original publication in this journal is cited, in accordance with accepted academic practice. No use, distribution or reproduction is permitted which does not comply with these terms.
*Correspondence: Bixing Ren, cmVuYml4aW5nQDEyNi5jb20=
Disclaimer: All claims expressed in this article are solely those of the authors and do not necessarily represent those of their affiliated organizations, or those of the publisher, the editors and the reviewers. Any product that may be evaluated in this article or claim that may be made by its manufacturer is not guaranteed or endorsed by the publisher.
Research integrity at Frontiers
Learn more about the work of our research integrity team to safeguard the quality of each article we publish.