- 1PetroChina Southwest Oil & Gasfield Company Safety, Environment & Technology Supervision Research Institute, Chengdu, Sichuan, China
- 2Materials Branch of Sichuan Huayou Group Co., Ltd., Chengdu, China
- 3Petroleum Engineering School, Southwest Petroleum University, Chengdu, Sichuan, China
The strength of the natural gas transmission pipe is reduced due to sag deformation and corrosion defects. However, there are rare experiment data to quantitatively describe the effect of the defect’s size and position on the pipe strength. This paper designed seven groups of steel pipes with various defects to perform the hydrostatic bursting experiments, and to research the effects of the defects on the strength of the steel pipe. The experimental pipe sample is selected as the X52 material. Three types of defects were set up: concave and corrosion combinational defects, one corrosion defect, and two corrosion defects. The pipe rupture size, the strain around defects, and pipe perimeters before and after experiments are measured, finally yielding the strain-pressure curve of each steel pipe. Comparisons of experimental results show that the defect depth is the dominant factor affecting the pipe strength. Moreover, results show that the DNV-RP-F101 code tends to yield less distance beyond which two defects will not affect each other. The ASME B31G code also tends to give a lower residual strength of the pipe. However, in comparison with the PCORRC criterion, the ASME B31G formula has higher accuracy for X52 pipes. The average relative deviation between the experimental and calculated corroded pipe strength is 14.87%.
1 Introduction
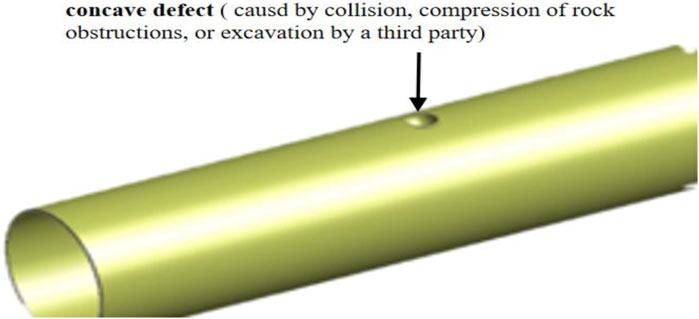
Internal concave defects and corrosion defects are commonly found in natural gas pipelines. These defects reduce the strength of the pipe and finally cause severe pipe fault accidents, such as gas leakage, fire, explosion accidents as well as environmental pollution (Milos et al., 2019; Jia et al., 2021a; Jia et al., 2022; Jia et al., 2023). The corrosion defects on the gas pipe can be classified into two types: uniform corrosion and local corrosion. There are no pure uniform corrosion defects. Instead, local corrosion is the dominant reason that causes pipe failure, including pitting corrosion, crevice corrosion, intergranular corrosion, erosion-corrosion, and stress corrosion (American Petroleum Institute, 2012; Sultan et al., 2018; Jia et al., 2021b). Besides, the concave defect is often caused by rock obstacles, mechanical damage, and third-party excavation, during the pipeline construction and installation processes. The concave defect is not a convex defect that often occurs in the pipeline installation process, but a local elastic-plastic deformation caused by the impact or extrusion of external forces, which causes a significant change in the curvature of the pipeline surface, as shown in Figure 1. However, it is difficult to predict the effects of the defect size and its position on the pipe strength because of the shape and position of the complicated defect as well as the interaction between different defects.
Representative evaluation standards and methods have been studied all over the world since the end of the 1960s, to evaluate the residual strength of defective pipes, such as ASME B31G (ASMEB31G-2012, 2012) and DNV-RP-F101 (DNV-RP-Fl01, 2010). These standards were built based on more than 70 full-size pipe bursting tests, and a large number of three-dimensional, nonlinear, elastic-plastic finite element analysis results.
Many scholars have researched the strength of the pipe with various defects by the use of experimental methods. Vanaei et al. (2017) reviewed the common pipe corrosion forms, the current status of state-of-the-art online detection (ILI) techniques, and corrosion growth rate models considering the advantages and limitations of each model. Some studies found that when the initial crack length of the steel pipe is known, the residual life of the pipe can be predicted (Jun et al., 2014). For example, when the crack length of the long crack surface is 10 mm, the residual life of the pipe is approximate 41320 h (4.71 years), and the target reliability is 98. When the penetration crack is 40 mm, the remaining life reduces to 10520 h (1.20 years). Bouledroua et al. (2019) performed burst tests on the API 5L X60 pipe steel. The experimental bursting pressures are compared with the simulation results obtained from the finite element method. The comparative study of the experimental and simulation results is used to evaluate the pipe structure integrity evaluation method, including the standard and fault assessment diagram (FAD). Zhang and Fan (Huimin and Jiazhen, 2009) carried out internal pressure bursting tests of the pipe when there are pit defects distributed along with the axial and the circumferential directions of the pipe, and finally proposed an internal pressure limit load estimation formula.
The theoretical method, including the finite element method, also has been widely applied in pipe strength research. Shuai et al. (Yi et al., 2017) proposed a new model to predict the bursting pressure for the corroded pipeline by the finite element method. They presented that the corrosion depth and the pipeline operation pressure have the largest influence on the pipe failure probability. However, they do not research the effects of the interaction between different defects. Ma et al. (Ma et al., 2013) applied the finite element method to predict the limit load of the buried pipeline. The simulation results are consequently used to evaluate the accuracy of the bursting test results. They found that pipe failure occurs when the von-Mises equivalent stress of the pipe reaches the ultimate tensile strength of the material. The failure mechanism of high-strength grade steel is plastic instability and is mainly controlled by the ultimate tensile strength of the material. Zhang and Fan (Huimin and Jiazhen, 2009) also used the finite element method to build the internal pressure limit load estimation formula for a steel pipe with various defects. Fekete and Varga (Gábor and László, 2012) studied the influence of axial and circumferential defect depth, length, and width on the bursting pressure. Yeom et al. (Kyu et al., 2015) studied the influence of axial defect depth and length on the failure pressure of the pipe. They also proposed a corresponding evaluation equation. These researches mainly focus on the effect of a single defect on the pipe strength.
On the other hand, the interaction between different defects also affects the pipe strength. Chandra et al. (2016) researched the effects of the interaction defects on the residual strength of the X46 steel pipe. They found the pipe residual strength is significantly reduced with increasing defect depth. Milos et al. (2019) studied the relationship between the pipe strength and the defect’s depth, length, width, and defect distance, yielding a criterion to determine the limit distance beyond which the defects will not affect each other. Behrooz et al. (2018) suggested that the limit axial distance between two defects is 25.4 mm. Cao et al. (Cao et al., 2017) stated that using the DNV model can accurately predict the actual bursting pressure when there are two axial rectangular defects on the X80 steel pipe.
Current achievements mainly focus on researching the effects of a single defect on the pipe strength for a specified pipe. The numerical simulation method based on the finite element method also has been widely involved in determining the pipe residual strength. However, some of the simulation results lack experimental verifications. The X52 steel pipe is widely used in the raw gas gathering and transmission process (Wenlong et al., 2020a; Wenlong et al., 2020b). We also lack experiment data regarding the strength of the pipe with one or two defects, which limits the pipe residual strength evaluation and the numerical simulation verification.
In this paper, the failure pressure and yield pressure of the X52 steel pipe are measured. The effect of the interaction between two defects on the strength is obtained through hydrostatic bursting tests. In what follows, the experimental materials and methods are introduced in Section 2. The experimental results are summarized in Section 3, and the effects of the shape and positions of the defect are analyzed based on experimental results. Finally, the accuracy of the DNV-RP-F101 and ASME-B31G are analyzed based on experimental results.
2 Materials and methods
2.1 Experimental pipe samples
The experiments selected seven groups of seamless steel pipe sections with various defects. The steel pipe material is X52, the external diameter is 406 mm, the wall thickness is 10 mm, and the length is 4000 mm. A total of seven pipes are selected and marked with the sample number: #1, #2, #3, #4, #5, #6, #7. The two end-sides of the pipe are sealed with reinforcement plates, and the pressurized medium is water, as depicted in Figure 2. A hydrostatic bursting test system is applied to gradually boost the pressure by injecting water into the sealed pipe, and the strain of the pipeline is recorded during the whole testing process (Shuai et al., 2006; Jian, 2010). The test procedure follows the DNV-RP-F101 code (DNV-RP-Fl01, 2010).
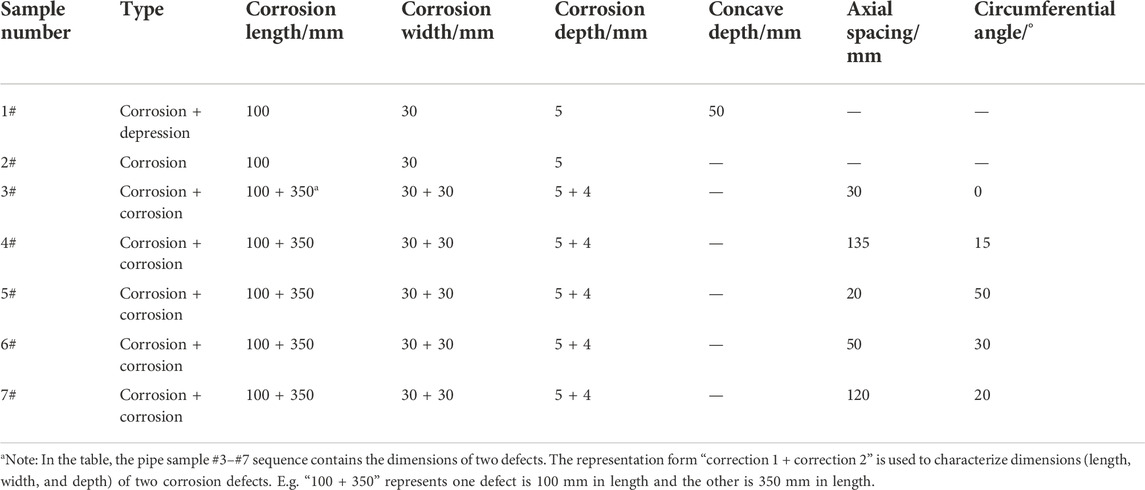
The size of the corrosion defect is represented by its length, width, and depth. Also, the concave is represented by its depth on the test pipe samples (Chinedu et al., 2015). A total of seven pipe samples are set according to different defect combinations. Firstly, a pure corrosion defect with 100 mm in length, 30 mm in width, and 5 mm in depth is set in pipe sample #2 as the control group. Secondly, the above corrosion defect is combined with a concave defect of 50 mm in depth. This combination is set in pipe sample #1, which revealed how the residual strength of pipe with corrosion changes when there is a concave on the corrosion at the same time. Finally, the above corrosion defect and another corrosion defect (350 mm in length, 30 mm in width, and 4 mm in depth) are carved in five pipe samples with different axial distances and circumferential angles. The list of the pipe samples is given in Table 1. Since the three dimensions of a defect (length, width, and depth) instead of its shape have the main influence on the residual strength of the pipe, the corrosion defect is made into a standard rectangle to ensure the accuracy of the measurement of the above three dimensions. The depressions were prefabricated by hardball extrusion, and the corrosion defects were prefabricated by cutting tool and fillet.
2.2 Static tensile experiments
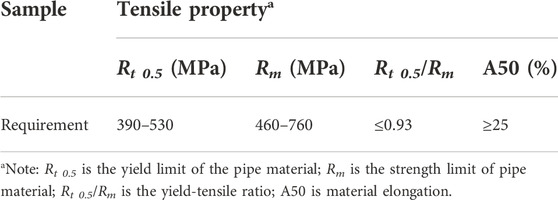
As the most important property of pipeline steel, the tensile property is the basic index for pipeline safety evaluation. To measure the tensile properties of the pipe samples mentioned above, seven X52 steel standard specimens were prepared from the above seven pipe samples to perform the material axial tensile experiment, obtaining the yield strength, tensile strength, and corresponding elongation of the material. The tensile test was carried out on the Instron-426 universal material testing machine following GB/T 228.1-2010 standard, and the experimental results should meet the standard requirements of API 5L, as shown in Table 2.
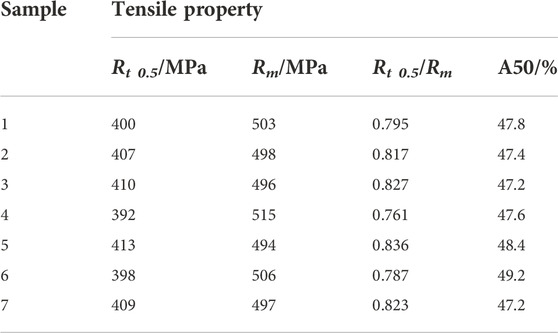
Table 3 presents that the yield strength of the material is in the range of 392–410 MPa, and the tensile strength is in the range of 494–515 MPa, which meets the requirements of the API 5L standard. Moreover, both the yield-tensile ratio and the elongation of the material reach the prescribed standards of API5 L, indicating that all the tested pipes have good plastic deformation capacity and deformation resistance.
2.3 Principles to determine the bursting pressure
Based on the above experimental samples, variations of the pressure with the time can be obtained by continuously injecting water into the sealed pipes. The first rupture occurs when the von-Mises equivalent stress at the defect position is equal to the strength limit of the pipe material. The bursting pressure of the pipe is equal to the water pressure when the pipe rupture occurs. The von-Mises equivalent stress is calculated by Eq. 1 (ASMEB31G-2012, 2012; DNV-RP-Fl01, 2010):
where σs is the von-Mises equivalent stress; σ1 is the principal stress along the pipe hoop direction; σ2 is the principal stress along the axial direction; σ3 is the principal stress along the radial direction.
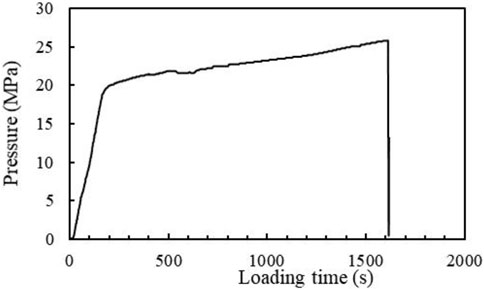
The pipe material is an elastic material when the equivalent stress at the defect position is less than the yield strength of the material. However, the pipe material becomes a plastic material when the equivalent stress is beyond the yield strength. Hence, two different pressure-increasing stages can be measured during the whole experimental process. We take the pressure loading process of sample #1 as an example to show the two stages. The pressure-loading time curve is shown in Figure 3. According to the pressure-loading time curve, the yield pressure of the pipe is 19.00 MPa, and the bursting pressure is 25.82 MPa.
2.4 The strain and stress test around defects
The pipe rupture generally occurs at the defect position because of the stress concentration. The strain and stress test around the defect is essential to determine the pipe bursting pressure. Sample #1 is still taken here as an example to show the method of measuring the strain and stress around the defect. The strain gauge parameters are as follows: the resistance 120 ± 0.2 Ω, the sensitivity coefficient K = 2 ± 1%, measuring range 20000 με.
Nine strain measuring points numbered 0, 1, 2, 3, 4, 5, 6, 7, and 8 around the defect, and the stick strain gauges are installed on these nine points. Four points are installed along the axial direction, and four points are installed along the hoop direction. One point is located at the intersection point of the axial and the hoop axis, as shown in Figure 4A. Besides, for the pipe sample containing two defects, it is not clear which defect will be the first broken one in the priority of experiments. We assume that the bigger defect will be firstly broken, so the strain measurement points are installed around the bigger one, as shown in Figure 4B. The actual installations of these measured points are shown in Figure 5A. Finally, sample #1 steel pipe shows fusiform rupture after bursting, and the specific morphology is shown in Figure 5B. Following the above method, Figure 6 shows the pressure-axial strain and pressure-circumferential strain curves for different test points for sample #1.
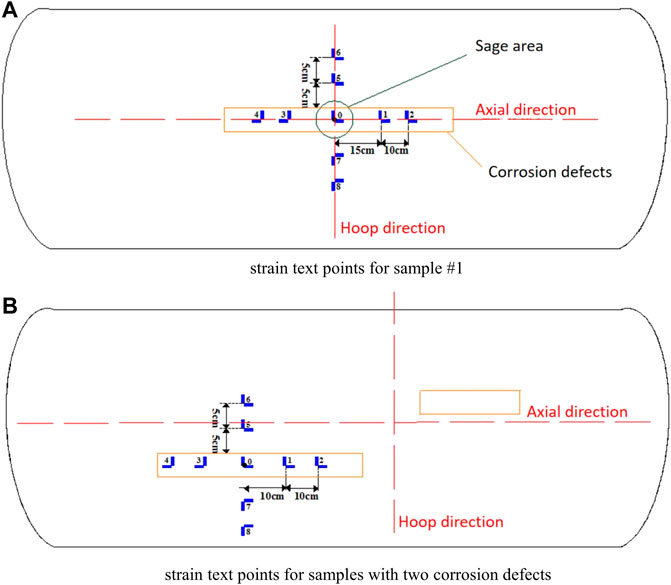
FIGURE 4. Nine strain test points around the defect on test samples, where (A) shows the strain test points for sample #1, and (B) shows the strain test points for samples with two corrosion defects.
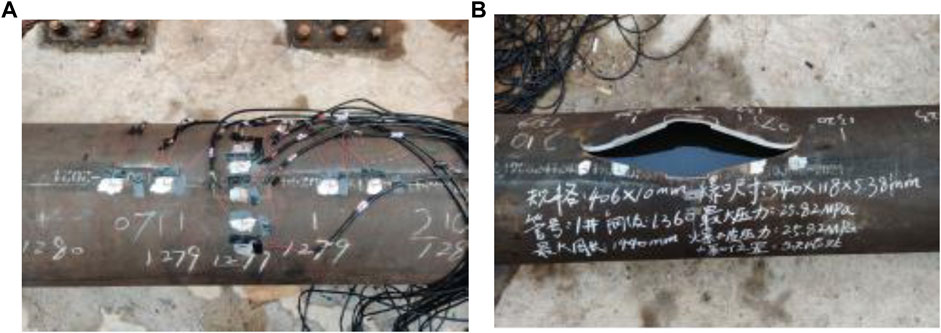
FIGURE 5. The strain test sample #1 steel pipe, where (A) shows the Strain test installation on the pipe, and (B) shows the piperuptureafter the experiment.
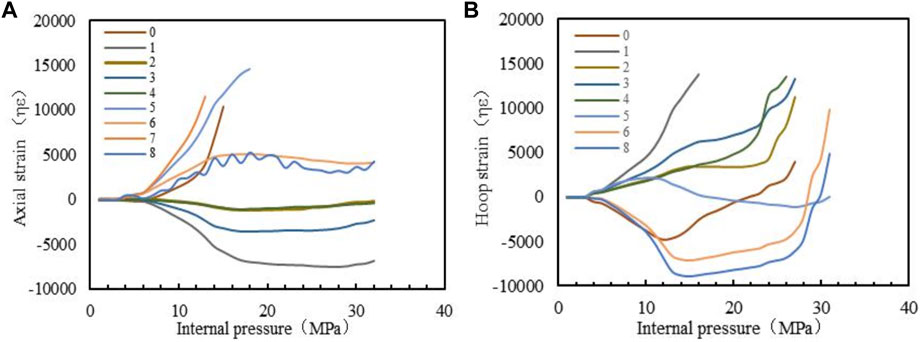
FIGURE 6. The pressure-straincurves for Sample #1, where (A) shows the pressure-axial strain curves, and (B) shows the pressure-circumferentialstrain curves.
In Figure 6A, curves (0, 1, 2, 3, 4) indicate the axial strain variation of five measured axial points around defects, where point 0 is located at the defect center, points 2 and 4 are closer to the defect center, and points 1 and 3 are far away from the defect center. We can find that the maximum axial strain occurs at the defect center. Also, axial strain decreases with increasing the distance from the measured point to the defect center. That is because the stress concentration at the defect position causes the largest strain in the pipe. Curves (5, 6, 7, 8) represent the axial strain variation of four measured points along with the circumferential position of the defect center (but it doesn't have to be inside the defect). Results show that the axial strain firstly increases and then decreases with increasing the distance from the defect center to the measure points. Additionally, the measured points along the axial direction have negative strains, whereas measured points along the circumferential direction always have positive axial strains. These results indicate that the axial position of the defect is subjected to the axial compressive stress, while the angular position of the defect is subjected to the axial tensile stress. These tendencies are following those presented by Hossein et al. (Al-Owaisi et al., 2016).
Figure 6B shows the variations of circumferential strain with pressure. It presents that before the pressure is loaded up to the burst pressure value, the circumferential strain at the axial position of the defect is positive but the circumferential strain at the circumferential position of the defect is negative. These results mean that the axial position of the defect is subjected to the circumferential tensile stress and the circumferential position of the defect is subjected to the circumferential compress stress. what’s more, Figure 6B shows that variations of the hoop strain curves change abruptly when the pressure is approaching the pipe bursting pressure. That is, the rupture is caused by the hoop strain.
2.5 Pipe circumferential deformation test
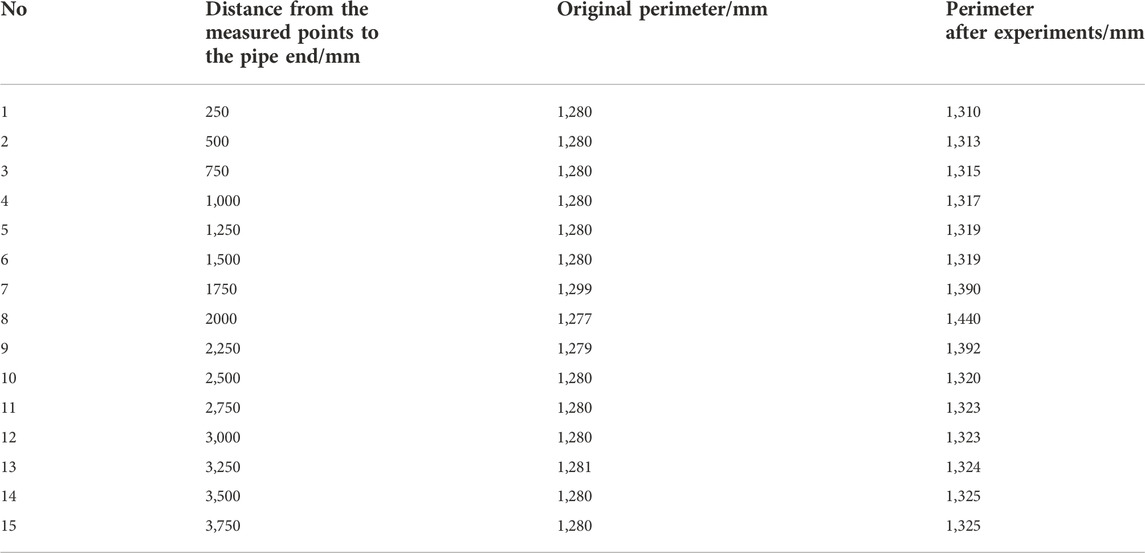
Following DNV-RP-F101 (DNV-RP-Fl01, 2010) code, fifteen circumferential deformation instruments are installed along the axial direction of the pipe with a spacing of 250 mm between two test points, as given in Table 4. Firstly, adjust the displacement output knob of the instrument until the initial displacement value is equal to zero. Secondly, collect the perimeter data at different positions of the pipe during the pressure boosting process until the sample yields. Thirdly, releasing the pressure to the atmospheric pressure to observe the deformation recovery. Fourthly, stop injecting water into the pipe, and remove the tester. Finally, draw the pressure deformation curve during the pressure boosting and releasing processes according to the measured data.
Sample #1 is still taken as an example to analyze the circumferential deformation of the pipe. The pipe’s original perimeters and the perimeters after experiments at fifteen different positions are listed in Table 4. This sample finally forms a rupture with 540 mm in length, 118 mm in width, and 5.38 mm in depth. The rupture extends both axially and circumferentially, as shown in Figure 5B.
Table 4 shows that the pipe has almost the same original perimeter. However, after experiments, the perimeter becomes larger because of the circumferential deformation. The middle position along the axial direction (2000 mm point) has the largest perimeter, that is because the defect is located at this position, resulting in the largest hoop strain of the pipe. Figure 7 shows the change of perimeter of each measuring point before and after pressurizing the pipeline.
3 Results and discussions
3.1 Pipe bursting pressure
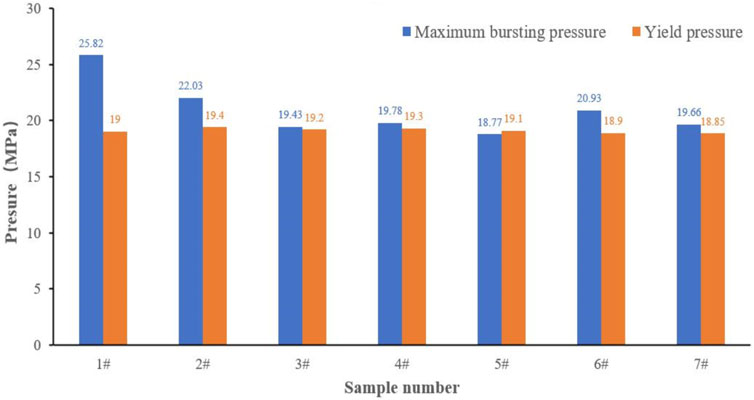
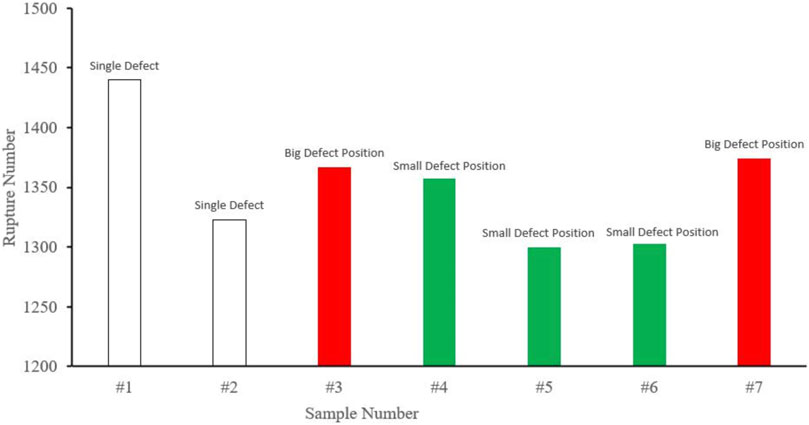
According to the above experimental methods, the yield pressure and the maximum bursting pressure of all seven samples listed in Table 1 are obtained from the pressure-loading time curves and derived strain-stress curves. The results are given in Figure 8. It presents that the seven samples have similar yield pressures although the defects on the sample are different. These results are reasonable because theoretically, the yield pressure is only dependent on the material itself. However, the bursting pressures of these seven samples are different, as shown in Figure 8, because the bursting pressure is dependent on the defect size and position.
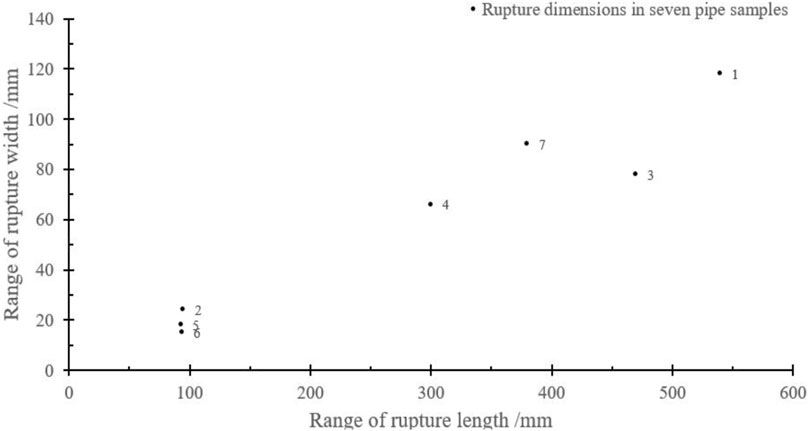
The rupture pictures of #2, #3, #4, #5, #6, and #7 samples are shown in Figure 9. The rupture size and positions of all these seven samples are summarized in Table 5. Comparisons of the rupture size and positions are given in Figures 9, 10. These results demonstrate that almost all the ruptures of the pipe are located at the small defect positions, although the length of the large defect is much higher than that of the small defect. That indicates the defect depth is the dominant factor affecting the pipe strength, because the depth of the small defect is 5 mm, and that of the large defect is 4 mm.
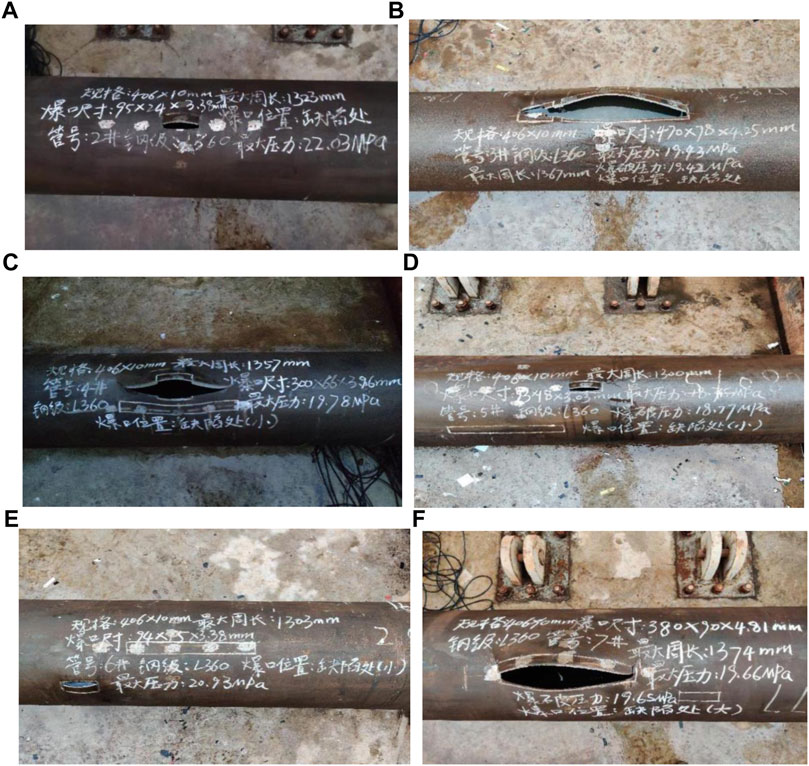
FIGURE 9. The rupture shape of six pipe samples, where (A–F) represent pipe samples 2# to 7#, respectively.
On the other hand, sample #1 has the highest bursting pressure among all these seven samples. The only difference between samples #1 and #2 is that sample #1 has one additional concave defect which is manufactured by pressing a hardball on the external surface of the pipe wall, resulting in the initial compressive stress for the sample. Contrary, the hydrostatic rupture experiments produce tensile stress on the sample. Hence, sample #1 has higher residual strength in comparison with other samples.
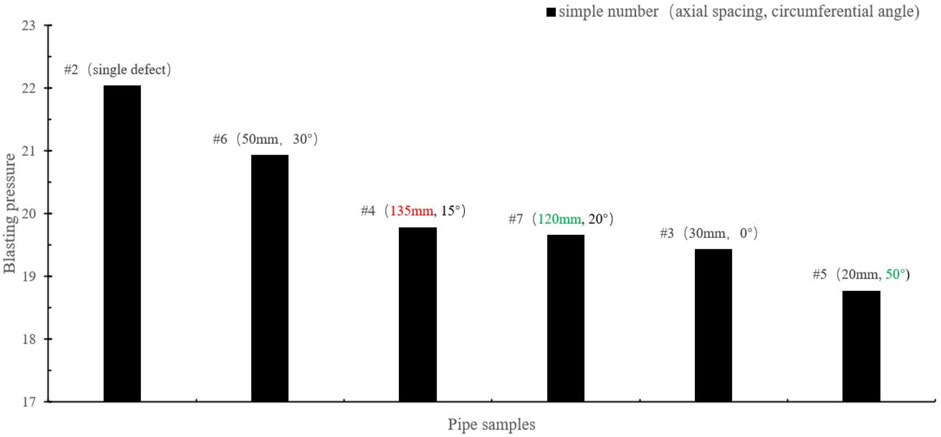
Except for sample 1#, sample #2 has the highest bursting pressure in comparison with samples #3, #4, #5, #6, and #7 because sample 2# has only one defect. The experimental results of these six samples can be applied to analyze the effects of the spacing between different defects on the pipe strength. Results demonstrate that the defects affect each other, resulting in a decrease in the failure pressure of the steel pipe. The interaction between the defects is related to the axial spacing and the circumferential angle (Al-Owaisi et al., 2016; Ghaednia and Sreekanta, 2018).
3.2 Evaluations on the interaction relationships between two defects
3.2.1 DNV-RP-F101 formula
The code DNV-RP-F101 recommends a formula to calculate the limit axial distance between two defects beyond which the two defects will not affect each other. The formula is as follows:
where, S is the limit axial distance, mm; D is the pipe external diameter, mm; t is the thickness, mm.
DNV-RP-F101 also recommends a formula to calculate the limit circumferential angle between two defects beyond which the two defects will not affect each other. The formula is as follows:
where Φ is the l circumferential angle.
According to Eqs 2, 3, the limit axial distance and limit circumferential angle are equal to 127 mm and 56.4°, respectively. However, these two equations do not consider the defect size and depth. We rearranged the bursting pressure of samples #2-#7 in Figure 12, in which we marked the limit axial spacing in the red color and the limit annular angle in the green color. The axial spacing of sample #4 is beyond the limit value calculated from the DNV-RP-F101 method, so there should be no interaction between the two defects, and the residual strength should be determined by the most serious single-point corrosion defect. In other words, the burst pressure of sample #4 should be equal to that of sample #2. However, the experimental results do not follow this rule. Similarly, the circumferential angle between defects of sample #5 is close to the limit value calculated from DNV-RP-F101, so its burst pressure should be close to the value of sample #2. Nevertheless, sample #5 has the lowest residual strength in the experimental results, indicating that it is still affected by the interaction between defects. It seems that DNV-RP-F101 is not accurate for calculating the limit axial distance and the limit annular angle for the pipeline with two defects. In the future, more experiments should be designed to validate and improve the above two equations.
3.2.2 ASME B31G formula for evaluation of pipeline residual strength
ASME B31G recommends a formula to calculate the residual strength of the corroded steel pipe as follows:
where Pf is the residual strength; SMYS is the material yield strength; M is the expansion correction factor; l is the defect length; t is the defect depth.
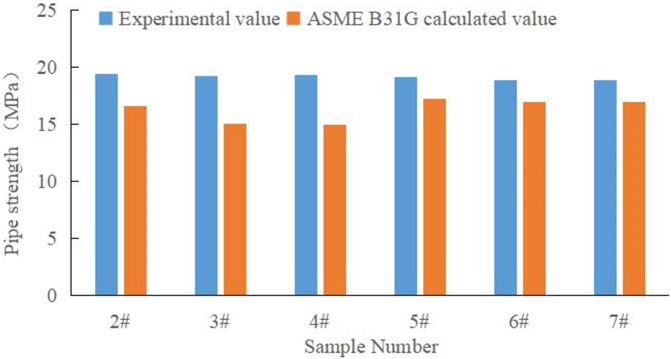
Based on Eqs 4, 5, the residual strength of the corroded pipe is related to the pipe material, the external diameter, the wall thickness, the defect length, and depth. Using Eq. 4, the calculated pipe residual strength is obtained. Comparisons between the calculated residual strength and the experimental values are depicted in Figure 13. It demonstrates that the ASME B31G code tends to yield lower residual strength, and the average relative deviation between the experimental and calculated value is 14.87%.
3.2.3 PCORRC formula for evaluation of pipeline residual strength
PCORRC formula is a fitting formula based on a large number of finite element results, which can be very suitable for evaluating medium and high-grade steel pipelines (Wang et al., 2019) but not applicable to evaluating cracked pipes (Bi et al., 2021). The PCORRC criterion states that the failure of pipe defects is dominated by material tensile strength instead of yield strength. Therefore, different from the ASME B31G standard, PCORRC uses tensile strength to calculate the residual strength of the pipeline. The PCORRC formula is as follows:
where M is the swell factor; σb is the tensile strength of pipe; P is the residual strength of pipe; d is the depth of corrosion defect; D is the outside diameter of the pipe; L is the length of corrosion defect; t is the wall thickness of the pipe.
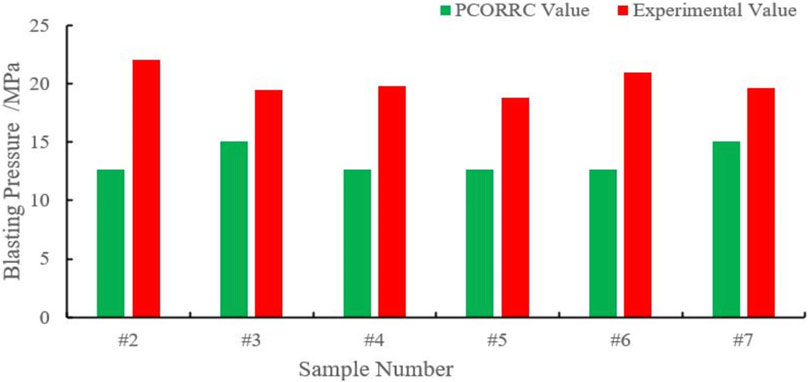
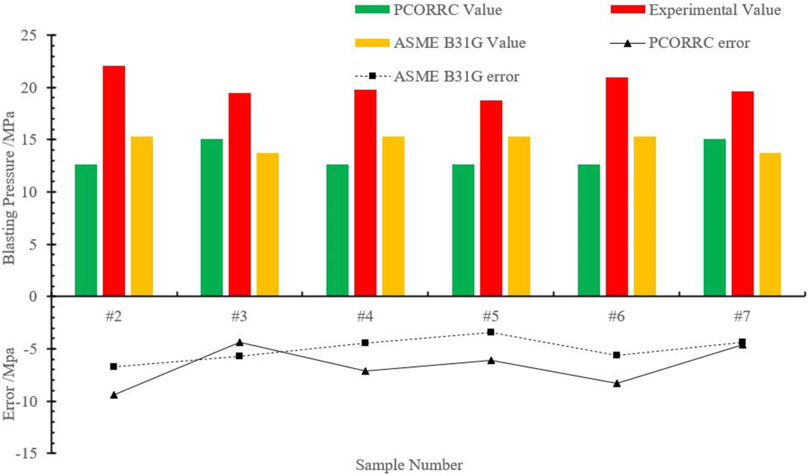
For seven pipe samples in hydrostatic bursting experiments, only two types of corrosion defects contain, including one with a depth of 5 mm and length of 100 mm, and the other with a depth of 4 mm and length of 350 mm. According to the experimental results shown in Figure 9, six defects leading to the failure of six pipe samples are selected to be the detective defects Separately. Taking the size of detective defects as a calculation parameter of the PCORRC criterion and the results are shown in Table 6 and Figure 14.
It is clear that there are errors between PCORRC values and experimental values of six pipe samples, and PCORRC values are always lower than experimental values, which shows the conservatism of the PCORRC criterion. Further comparison with ASME B31G formula shown in Figure 15 demonstrates the calculation error of PCORRC formula is larger than that of ASME formula, that is because PCORRC formula is more suitable for evaluating medium and high-grade pipes (Stephens and Leis, 1999) such as X70 ∼ X100. Therefore, compared with the PCORRC criterion, the ASME B31G formula that is suitable for evaluating medium and low-strength pipe has more accuracy for pipe samples of X52 steel.
However, both PCRRC and ASME B31G codes cannot avoid the issue that these criteria can only be used for a single corrosion defect pipeline and are too conservative. Therefore, the influence of axial distance or circumferential angle between defects on the bearing capacity of the pipeline cannot be reflected when evaluating pipeline samples with two defects.
3.2.4 Summary
The verification of DNV-RP-F101, ASME-B31G, and PCRORRC codes indicates that there is still a lack of effective evaluation criteria for multidefect pipelines, and the most direct embodiment is that the change of defect location can not be reflected in the formula of residual strength. In addition, the results of the full-scale pipe hydrostatic blasting test do not exactly match the DNV-RP-F101 discriminant of ultimate axial spacing and circumferential angle, indicating that study of the interaction between defects in the pipeline is still insufficient. Therefore, it is suggested that the evaluation of residual strength of the pipeline could be related to the positions of two defects, and the interaction between defects could be further studied. Meanwhile, the ASME B31G formula and the criterion in DNV-RP-F101 that calculate the limit distance between two defects need to be modified in further work to improve the accuracy in the evaluation of pipe residual strength with multidefects.
4 Conclusion
The subject of this paper is to test the strength of X52 steel pipes with various defects. The effect of the axial distance and the circumferential angle between two defects on the pipe strength is also discussed based on experiments. The following conclusions and suggestions are drawn from a comparative analysis.
1) The hydrostatic experiment method can effectively measure the strain around the defect, the yield pressure, and the bursting pressure of X52 steel pipes. The defect depth is the dominant factor affecting the pipe strength.
2) For the X52 steel pipe, the bursting pressure of the pipe with one concave defect and one corrosion defect is greater than that of the pipe with only one corrosion defect. The pipe with two corrosion defects has less strength in comparison with that that has only one corrosion defect.
3) Experimental data are applied to evaluate the limit circumferential angle, limit axial distance formulas in the DNV-RP-F101 code, and verify the corroded pipe residual strength in ASME B31G code and PCORRC code. Results show that the DNV-RP-F101 code tends to yield a less limit axial distance. The ASME B31G code also tends to give a lower residual strength of the pipe, the calculated value of corroded pipe strength which has 14.87% error compared with experimental data.
4) Compared with ASME B31G code, PCORRC code tends to give more conservative results when evaluating X52 pipe, that is because PCORRC is more suitable for evaluating medium and high-grade pipes. It is suggested that the PCORRC code be used in the evaluation of X70 to X100 pipe (SMYS 485MPa–690 MPa) and that the ASME B31G code be used in evaluating pipe strength of steel grade below X70 (SMYS lower than 485 MPa).
5) Evaluation of multi-defect pipeline is still lacking, and the most direct embodiment is that the evaluation of the bearing capacity of defective pipeline in the current criterion can not be combined with positions of two defects. Thus, it is suggested that the interaction between defects could be taken into account in future studies of the residual strength of pipelines.
6) In future work, it is necessary to carry out hydrostatic blasting experiments of pipes with a combination of more than three defects. Meanwhile, more experiments should be designed to validate and modify the formulas proposed in the existing criteria.
Data availability statement
The original contributions presented in the study are included in the article/supplementary material, further inquiries can be directed to the corresponding author.
Author contributions
CQ: Conceptualization, Methodology, Data curation, TL: Validation, Writing–Reviewing and Editing, CL: Writing—original draft preparation, JG: Formal analysis, XD: Investigation, QR: Writing- Reviewing and Editing; WJ: Writing–Reviewing and Editing, Supervision.
Funding
This study was financially supported by a project of the National Natural Science Foundation of China (No. 52274065), the Science and technology projects of Sichuan Province (No. 2022NSFSC0235).
Acknowledgments
The authors acknowledge the valuable research ideas and writing assistance of Jia of Southwest Petroleum University.
Conflict of interest
Authors CQ, TL, CL, JG and XD, were employed by the company PetroChina Southwest Oil & Gasfield Company Safety and Author TL was employed by the company Materials Branch of Sichuan Huayou Group Co., Ltd.
The remaining authors declare that the research was conducted in the absence of any commercial or financial relationships that could be construed as a potential conflict of interest.
Publisher’s note
All claims expressed in this article are solely those of the authors and do not necessarily represent those of their affiliated organizations, or those of the publisher, the editors and the reviewers. Any product that may be evaluated in this article, or claim that may be made by its manufacturer, is not guaranteed or endorsed by the publisher.
Supplementary material
The Supplementary Material for this article can be found online at: https://www.frontiersin.org/articles/10.3389/fenrg.2022.1046900/full#supplementary-material
References
Al-Owaisi, S. S., Becker, A. A., and Sun, W. (2016). Analysis of shape and location effects of closely spaced metal loss defects in pressurised pipes. Eng. Fail. Anal. 68, 172–186. doi:10.1016/j.engfailanal.2016.04.032
American Petroleum Institute (2012). API spec 5L specification for line pipe. 45 th. Washington, D.C., USA: API Publishing Services.
ASME B31G-2012 (2012). Manual of determining the remaining strength of corroded pipelines. New York, NY, USA: American Society of Mechanical Engineers ASME.
Behrooz, K., Mohamed, A., and Seghier, B. (2018). Modified response surface method basis harmony search to predict the bursting pressure of corroded pipelines. Eng. Fail. Anal. 89, 177–199. doi:10.1016/j.engfailanal.2018.02.016
Bi, T. F., Li, Y., Tian, Y. D., Gao, D., Sun, D. W., and Jiang, Y. Z. (2021). Discussion on the selection of safety evaluation criteria for corrosion defects of long-distance pipeline. Automation Petro-Chemical Industry 57 (03), 53–56. doi:10.3969/j.issn.1007-7324.2021.03.013
Bouledroua, O., Zelmati, D., and Hassani, M. (2019). Inspections, statistical and reliability assessment study of corroded pipeline. Eng. Fail. Anal. 100, 1–10. doi:10.1016/j.engfailanal.2019.02.012
Chandra, S. K., Saravanan, K., and Patil, S. S. (2016). Buckling strength of corroded pipelines with interacting corrosion defects: Numerical analysis. Int. J. Str. Stab. Dyn. 16 (9), 1550063. doi:10.1142/s0219455415500637
Cao, Y., Yao, D., Su, X., Zhou, Y., Yu, J., and Li, H. (2017). The ultimate bearing capacity of defects in X80 pipeline steel. Oil gas storage Transp. 36, 1361–1367. doi:10.6047/j.issn.1000-8241.2017.12.003
Chinedu, I. O., Brian, B., and Ian, J. D. (2015). Pipeline failures in corrosive environments – a conceptual analysis of trends and effects. Eng. Fail. Anal. 53, 36–58. doi:10.1016/j.engfailanal.2015.03.004
Gábor, F., and László, V. (2012). The effect of the width to length ratios of corrosion defects on the bursting pressures of transmission pipelines. Eng. Fail. Anal. 21, 21–30. doi:10.1016/j.engfailanal.2011.12.002
Ghaednia, H., and Sreekanta, D. (2018). Structural performance of oil and gas pipe with dent defect. J. Pipeline Syst. Eng. Pract. 9 (1), 04017031. doi:10.1061/(asce)ps.1949-1204.0000301
Huimin, Z., and Jiazhen, F. (2009). Limit load analysis of defective pipelines containing body rent. Eng. Mech. 26, 20–25.
Jia, W. L., Yang, F., Li, C., Huang, T., and Song, S. (2021a). A unified thermodynamic framework to compute the hydrate formation conditions of acidic gas/water/alcohol/electrolyte mixtures up to 186.2 MPa. Energy 230, 120735. doi:10.1016/j.energy.2021.120735
Jia, W. L., Zhang, Y., Li, C., Luo, P., Song, X., Wang, Y., et al. (2021b). Experimental and numerical simulation of erosion-corrosion of 90° steel elbow in shale gas pipeline. J. Nat. Gas Sci. Eng. 89, 103871. doi:10.1016/j.jngse.2021.103871
Jia, W. L., Zhang, Y. R., Li, C. J., Wu, X., Song, S., and Yang, F. (2022). Optimal diameter of liquid-phase ethane transportation pipeline considering the liquid-vapor phase change. J. Nat. Gas Sci. Eng. 107, 104797. doi:10.1016/j.jngse.2022.104797
Jia, W. L., Ren, Q. Y., Zhang, H., Yang, M., Wu, X., and Li, C. (2023). Multicomponent leakage and diffusion simulation of natural gas/hydrogen mixtures in compressor plants. Saf. Sci. 157, 105916. doi:10.1016/j.ssci.2022.105916
Jun, H., Yangyang, T., Haipeng, T., Yu, L., and Zheng, M. (2014). The probabilistic life time prediction model of oil pipeline due to local corrosion crack. Theor. Appl. Fract. Mech. 70, 10–18. doi:10.1016/j.tafmec.2014.04.002
Kyu, J. Y., Lee, Y. K., Kyu, H. O., and Woo, S. K. (2015). Integrity assessment of a corroded API X70 pipe with a single defect by bursting pressure analysis. Eng. Fail. Anal. 57, 553–561. doi:10.1016/j.engfailanal.2015.07.024
Ma, B., Jian, S., Dezhu, L., and Li, S. (2013). Accuracy analysis of limit load of buried pipeline pre-deleted by bursting test based on finite element method. Gas. Ind. 6, 108–112. doi:10.3787/j.issn.1000-0976.2013.06.020
Milos, B. D., Gordana, M. B., Vera Sijacki, Z., Sedmak, A., and Rajicic, B. (2019). The synergistic action and interplay of hydrogen embrittlement mechanisms in steels and iron: localized plasticity and decohesion. Eng. Fract. Mech. 216, 106528. doi:10.1016/j.engfracmech.2019.106528
Shuai, J., Zhang, C., and Chen, F. (2006). Comparative study on the evaluation method of residual strength of corrosion pipeline. Nat. Gas. Ind. 26, 122–125. doi:10.3321/j.issn:1000-0976.2006.11.038
Stephens, D. R., and Leis, B. N. (1999). Development of an alternative criterion for residual strength of corrosion defects in moderate- to high-toughness pipe. Int. Pipeline Conf. 2, 781–792.
Sultan, A. O., Adib, A. B., Wei, S., Abdullah, A. S., Majid, A. M., Tasneem, P., et al. (2018). An experimental investigation of the effect of defect shape and orientation on the bursting pressure of pressurised pipes. Eng. Fail. Anal. 93, 200–213. doi:10.1016/j.engfailanal.2018.06.011
Vanaei, H. R., Eslami, A., and Egbewande, A. (2017). A review on pipeline corrosion, in-line inspection (ILI), and corrosion growth rate models. Int. J. Press. Vessels Pip. 149, 43–54. doi:10.1016/j.ijpvp.2016.11.007
Wenlong, J., Jiuqing, B., Fangjian, L., Cheng, T., He, Y., and Li, C. (2020a). A new homogeneous non-equilibrium model to compute vapor-liquid two-phase critical pressure ratios of multicomponent hydrocarbon mixtures. J. Loss Prev. Process Industries 68, 104338. doi:10.1016/j.jlp.2020.104338
Wenlong, J., Shuoshuo, S., Changjun, L., and Wu, X. (2020b). Predictions on CH4 recovery factors using the CO2 replacement method to develop natural gas hydrate resources. J. CO2 Util. 41, 101238. doi:10.1016/j.jcou.2020.101238
Yi, S., Jian, S., and Kui, X. (2017). Probabilistic analysis of corroded pipelines based on a new failure pressure model. Eng. Fail. Anal. 81, 216–233. doi:10.1016/j.engfailanal.2017.06.050
Keywords: natural gas pipe, corrosion defect, hydrostatic bursting experiment, strength, evaluation
Citation: Qi C, Li T, Liu C, Gao J, Du X, Ren Q and Jia W (2023) Experiments and evaluation on residual strength of X52 steel pipe with various internal defects. Front. Energy Res. 10:1046900. doi: 10.3389/fenrg.2022.1046900
Received: 17 September 2022; Accepted: 29 September 2022;
Published: 12 January 2023.
Edited by:
Xuewen Cao, China University of Petroleum, ChinaReviewed by:
Ying Zhu, Nanchang Hangkong University, ChinaBingyuan Hong, Zhejiang Ocean University, China
Wang Qingfeng, Beijing University of Chemical Technology, China
Copyright © 2023 Qi, Li, Liu, Gao, Du, Ren and Jia. This is an open-access article distributed under the terms of the Creative Commons Attribution License (CC BY). The use, distribution or reproduction in other forums is permitted, provided the original author(s) and the copyright owner(s) are credited and that the original publication in this journal is cited, in accordance with accepted academic practice. No use, distribution or reproduction is permitted which does not comply with these terms.
*Correspondence: Wenlong Jia, amlhd2VubG9uZzA4QDEyNi5jb20=
 Changchao Qi1
 Qingyang Ren
 Wenlong Jia