 Felix Oehme
 Daniel Gleichauf1
95% of researchers rate our articles as excellent or good
Learn more about the work of our research integrity team to safeguard the quality of each article we publish.
Find out more
ORIGINAL RESEARCH article
Front. Energy Res. , 29 November 2022
Sec. Wind Energy
Volume 10 - 2022 | https://doi.org/10.3389/fenrg.2022.1043065
This article is part of the Research Topic Advances in Wind Turbine Rotor Design View all 8 articles
A thermographic detection and localization of unsteady flow separation on an operating wind turbine of type GE1.5sl is presented and verified by means of tufts flow visualisation. Unsteady flow separation phenomena such as dynamic stall are an undesired flow state as it causes fatigue failures, limits the turbine efficiency and increases noise emissions from the rotor blades. In comparison to available methods for stall detection on wind turbines, the presented infrared thermographic measurement approach is non-invasive, in-process capable and provides a high spatial resolution. On the basis of the thermodynamic response behaviour of the surface temperature in case of unsteady flow events, a two-step signal processing approach is proposed, to achieve the highest possible spatio-temporal resolution in the detection and localisation of stall. First, the identification of distinct maxima of the spatial standard deviation of difference images, enables to determine potential stall events in time. In the subsequent combined image evaluation with a transient approach and a principal component analysis, unsteady flow separation is detected during the occurrence of a strong wind gust with the maximum time resolution (image exposure time) as well as the maximum spatial resolution (image resolution), respectively, despite the limited signal-to-noise ratio compared to wind tunnel experiments. In addition, a geometric assignment of the image data to the rotor blade geometry is conducted, which enables a localization of the separation point on the 3 days rotor blade geometry with a maximal uncertainty of 2.3% of the chord length.
Unsteady flow separation phenomena like dynamic stall on wind turbines result in time-varying structural loads, an aerodynamic performance loss and an increased noise emission of the rotor blades (Martinez Suarez et al., 2018; Melius et al., 2016). Thus, dynamic stall models are needed for load calculations and aeroelastic simulations. Currently used dynamic stall models such as ONERA (Rapin and Ortun, 2007), Beddoes–Leishman (Pereira et al., 2013) and Snel (Adema et al., 2019) are so-called semi-empirical models. These models require different empirical coefficients, which are determined in wind tunnel experiments for specific airfoils and Reynolds numbers (Holierhoek et al., 2013). Accordingly, the validation of the models is limited to the specific experimental test conditions, which differ from the real wind turbine operating environment. Also, the onset of dynamic stall is not reliably predictable (Leishman, 2002). As a result, beside numerical simulations and wind tunnel experiments on scaled airfoils, the measurement of unsteady flow separation on non-scaled wind turbines is an important task (van Kuik et al., 2016). More specifically, an in-process capable, non-invasive measurement method with a high spatio-temporal resolution is needed for the detection and localisation of unsteady flow separation on operating wind turbines.
Available methods for boundary layer flow measurements on operating wind turbines are tufts (Vey et al., 2014), stall flags (Corten and Veldkamp, 2001), oil solutions (Medina et al., 2011), surface pressure sensors (Kuester et al., 2016), hot-film sensors (Schaffarczyk et al., 2017), and temperature-sensitive paint (Costantini et al., 2019). However, these methods require a time-consuming installation during a shutdown of the wind turbine, are invasive and have a limited spatial resolution.
A non-invasive flow visualisation method that enables field measurements on rotor blades of wind turbines is infrared thermography (IRT) (Gartenberg and Roberts, 1992). The measurement principle of IRT flow visualisation is based on forced convective heat transfer and exploits the relation between the resulting surface temperature gradients and the properties of the boundary layer flow. The spatial surface temperature gradients are measurable by detecting the infrared radiation with a respective camera. Thus, IRT enables a non-invasive, in-process flow visualisation with a high spatial resolution. Currently, IRT is particularly used in wind tunnel measurements with defined steady or unsteady inflow conditions, actively heated rotor blades and small measuring distances. On operating wind turbines, atmospheric turbulences lead to a changing inflow velocity and angle of incidence, i. e. to arbitrary unsteady inflow conditions (Tobin et al., 2015). Moreover, actively heating the rotor blade is generally not possible on operating wind turbines. In field measurements, the temperature difference between the incoming fluid and the rotor blade surface is based solely on absorbed solar radiation and viscous heating, which leads to a low thermal contrast (typically <1 K) between different flow regions. Furthermore, the camera position and the rotating rotor blades are spaced by a large measurement distance of >100 m. As a result, measurements on real wind turbines are characterised by unsteady inflow conditions, low thermal contrasts, reduced spatial resolutions and motion blur.
IRT can cope with these demanding measurement conditions on operating wind turbines and is already applied to detect and localise the transition from laminar to turbulent flow on single thermograms assuming static inflow conditions (Dollinger et al., 2019; Dollinger et al., 2018b; Reichstein et al., 2019). In contrast, the thermographic detection of flow separation has so far primarily been investigated in wind tunnel measurements. First Gartenberg and Roberts (1991) detected stall on an actively heated airfoil with static inflow conditions by a qualitative evaluation of the steady-state surface temperature distribution. Due to the low thermal contrast measurement conditions at wind turbines, the approach of evaluating surface temperature distributions on individual thermograms is not suitable for the detection of static stall, since lateral heat conduction or material inhomogeneities attenuate the spatial temperature gradients between different flow regions. Also, unsteady flow phenomena are not resolvable, as the thermal inertia of the surface limits the temporal temperature gradients.
With the aim to increase the distinguishability between turbulent attached and turbulent separated flow regions for the measurement conditions on wind turbines, several wind tunnel studies with static inflow conditions were conducted. First, Dollinger et al. (2016) showed the detectability of flow separation by evaluating the spatial distribution of the temporal standard deviation of IRT image series. Dollinger et al. (2018a) and Oehme et al. (2021) analysed the temporal surface temperature response to changing inflow temperatures but static inflow conditions in wind tunnel experiments by means of the evaluation of image series. While Dollinger et al. (2018a) reached an enhanced thermal contrast in the thermogram between turbulent attached and separated flow regions, Oehme et al. (2021) presented an unambiguous detection of turbulent flow separation based on characteristic thermal stall features.
For the first time, we recently achieved an IRT-based detection of static stall at the rotor blade root of an operating wind turbine by evaluating the thermodynamic response to the unsteady inflow conditions at wind turbines (Oehme et al., 2022). However, since the proposed signal processing approaches for the measurement conditions on wind turbines are based on a time-averaged evaluation of surface temperature fluctuations, they are not suitable for a time-resolved detection of flow separation.
With the aim to realise a time-resolved detection of dynamic stall in wind tunnel experiments conducted on an intensively heated and fast moving helicopter airfoil, Gardner et al. (2016) published an alternative IRT measurement method, which evaluates the spatial standard deviation of differential infrared images (σDIT approach). While the presented σDIT approach provides only a poor spatial resolution, a time-resolved detection of dynamic stall was shown.
As a result, the time-averaged evaluation of surface temperature fluctuations enables a detection of static stall at wind turbines with a high spatial resolution, whereas the use of differential thermography enables a time-resolved evaluation of unsteady stall in idealised wind tunnel experiments. But how can both IRT evaluation approaches be combined in order to enable the detection of unsteady flow separation at operating wind turbines with a high spatial and a high temporal resolution?
Our aim is to realise a time-resolved detection and localisation of the occurrence of unsteady flow separation at the tip-near rotor blade region by means of infrared thermography (IRT). Therefore, a two-step signal processing approach is introduced. First, unsteady flow events during the wind turbine operation are roughly detected by evaluating the spatial standard deviation of differential infrared images (σDIT approach). Then two detailed, complementary analyses follow: a transient evaluation of difference images providing a maximal temporal resolution and a principle component analysis providing a maximal spatial resolution. In addition, to enable the localisation of the flow separation region on the 3 days rotor blade geometry, the 2 days thermogram is mapped to the rotor blade surface geometry. By employing and evaluating the geometric assignment approach from Dollinger et al. (2019), the achievable localisation uncertainty is clarified.
First, the measurement chain of IRT flow visualisation on wind turbines is described in Section 2. In addition, the thermal response during the occurrence of a wind gust is evaluated to investigate the expectable distinguishability of attached and separated flow regions. The experimental setup of the thermographic measurements on a real wind turbine is presented in section 3. In contrast to several stall experiments on scaled research wind turbines with controlled flow conditions but without IRT (Hand et al., 2001; Snel et al., 2007), the presented measurements are carried out under widely unknown inflow conditions on a non-scaled wind turbine of type GE1.5sl. To validate the thermographic measurement approach, a reference flow visualisation with tufts is conducted. The experimental results with the proposed two-step, complementary signal processing approach and the geometric assignment to the 3 days rotor blade surface to detect and localise an unsteady stall event are presented in Section 4. The article closes with a summary and outlook in Section 5.
In order to derive a suitable signal processing approach for the detection of unsteady flow separation using IRT, the measurement chain of the thermographic flow visualisation on wind turbines is presented at first. Under the condition of a temperature difference between the incoming boundary layer flow and the rotor blade surface, flow-dependent spatial temperature gradients arise on the rotor blade surface, since the magnitude of the resulting convective heat transfer depends on the boundary layer flow properties (Incropera and DeWitt, 1996). The surface temperature distribution is measurable by detecting the emitted infrared (IR) radiation from the rotor blade surface with a respective camera, as the radiation flux is a function of the surface temperature and the directional spectral emissivity.
Considering a differential volume element on the surface of a rotor blade, the thermographically measurable temperature Ts can be calculated by using the heat balance (Verein Deutscher Ingenieure, 2010)
Thus, the surface temperature distribution is determined by material and surface properties M as well as the following contributions to the heat flux density
• convective heat transfer
• heat conduction
• absorbed radiant heat flux
Considering the rotor blade flow on wind turbines as one-dimensional, the convective heat transfer
Note that the heat transfer coefficient h and the adiabatic wall temperature Tad contain flow information. The instantaneous value of the heat transfer coefficient h can be considered as a composition of the time-averaged mean value
With respect to the flow conditions at wind turbines,
Unfortunately, the thermal inertia of the rotor blade surface and the small temperature difference between the adiabatic wall temperature and the surface temperature lead to a low sensitivity of the measurable surface temperature to unsteady flow conditions. Therefore, the evaluation of the instantaneous surface temperature distribution by means of single thermographic images is not suitable for the detection of non-stationary flow phenomena such as unsteady flow separation. Instead, a targeted evaluation of temporal changes in the surface temperature as a thermodynamic response to unsteady inflow conditions is required to realise a detection of unsteady flow separation by means of IRT.
During operation of wind turbines, unsteady influences such as (Hansen et al., 2006):
• Gusts,
• Yaw/tilt misalignment,
• Pitching rotor blades
• The tower passage,
Result in sudden changes in the angle of attack and cause unsteady flow separation. For the measurements in the presented manuscript, the sudden increase in the speed of the wind during gusts is the dominant cause of unsteady flow separation. During the occurrence of gusts, the upstream wind speed Uw and subsequently the effective inflow velocity Ueff as well as the angle of attack α increases. Assuming a constant rotational speed of the rotor Ω, the change of the effective inflow velocity ΔUeff as well as the change of the angle of attack Δα is calculated according to.Where r is the radial rotor blade position, a the axial induction factor, a′ the tangential induction factor, θ the blade twist angle and Ueff,0, α0 are the initial effective inflow velocity and the initial angle of attack, respectively. When the upwind speed changes sufficiently, the angle of attack exceeds the static stall angle, resulting in a trailing edge flow separation (Melius et al., 2016). In addition, the laminar-turbulent flow transition moves upstream with an increasing angle of attack (Gartenberg and Roberts, 1991; Genç et al., 2012). The spatial shift of the boundaries of the different flow state regions and the non-constant flow velocities lead to a transient behaviour of the adiabatic wall temperature Tad and the non-stationary part
First, the influence of the adiabatic wall temperature on the surface temperature response to a gust is considered. In the case of gust accelerations, the adiabatic wall temperature increases with the change of the effective inflow velocity Ueff. According to experimental studies on viscous heating in separated flow regions, it is assumed that the adiabatic wall temperature in separated flow regions shows a lower increase than in attached flow regions due to the reduced recovery factor (Chang, 1970; Aleksyuk, 2021). As a result, separated flow regions are detectable by a smaller temporal temperature gradient compared to attached flow regions during a gust.
Second, an idealised consideration of the time-averaged non-stationary part
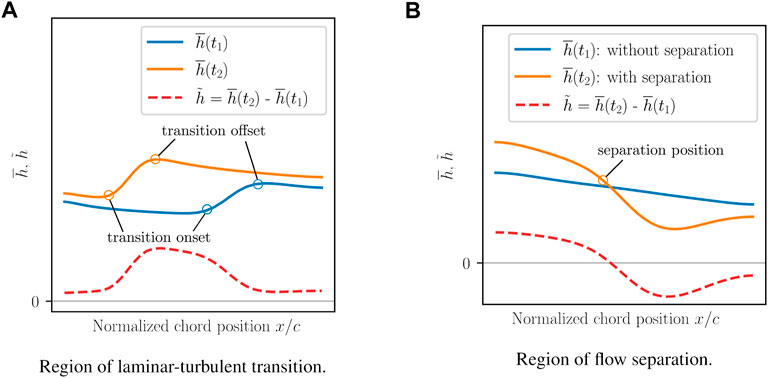
FIGURE 1. Idealised course of the mean value
Around the flow separation point, there is no common behaviour of
In conclusion, the following thermal features are available in the temporal evaluation of thermographic image series to detect times of gusts and to identify regions of laminar-turbulent transition and flow separation:
• Times with gusts: high spatial variance of the temporal temperature gradient, due to the spatial shift of the boundaries of the different flow state regions.
• Region of laminar-turbulent transition: minimum of the temporal temperature gradient, caused by an increasing convective cooling.
• Separation point: maximum of the temporal temperature gradient, due to decreasing convective cooling.
• Separated flow region: the temporal temperature gradient decreases towards the trailing edge, due to the influence of adiabatic heating and the increase in convective cooling.
The resulting research hypothesis is, that the evaluation of these thermal features enables the time-resolved detection and localisation of unsteady flow separation.In order to realise an IRT-based detection of unsteady flow separation with a high spatial and temporal resolution by evaluating the thermal rotor blade surface response characteristics to the unsteady inflow conditions during a gust, a two-step signal processing approach is proposed. The goal of the first step is to identify time steps with potential unsteady stall events (coarse detection of stall), while the second step aims to realise the time- and space-resolved detection of unsteady flow separation (fine detection and localisation of stall). Figure 2 illustrates the sequential order of the proposed signal processing approach.
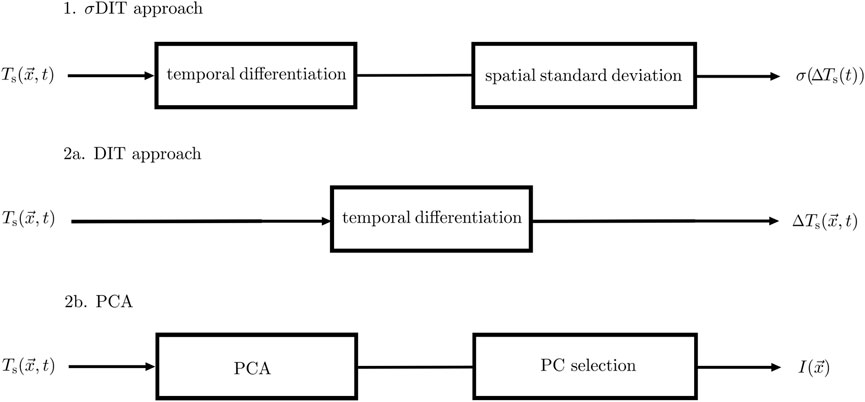
FIGURE 2. Schematic overview of the signal processing procedure.
The first step is based on the evaluation of the spatial standard deviation of temporal difference images (σDIT approach). The difference images ΔTs are calculated by means of a subtraction of time-sequential images of a thermographic image series
Subsequently, the spatial standard deviation σ(ΔTs) of each difference image is used as the evaluation quantity. In contrast to the introduction of the σDIT approach by Gardner et al. (2016), the evaluation is not focused on stationary random flow structures in separated flow regions but on the spatially different response behaviour of the surface temperature in case of unsteady inflow conditions such as gusts. As a result, time steps of potential unsteady stall events are identifiable by maxima of the spatial standard deviation σ(ΔTs).
The second signal processing step involves the further evaluation of the difference images and the application of a principle component analysis (PCA). The evaluation of differential images (DIT approach) is well established for the evaluation of changing transition positions (Wolf et al., 2020). Here, the application of the DIT approach aims to detect unsteady flow separation with the highest possible temporal resolution by evaluating thermograms during the onset of a gust using the interpretable thermal features derived in Section 2.2. While the DIT approach provides a low sensitivity to flow-independent cross-influences such as uneven heating or material inhomogeneities, the small temperature difference between two images leads to a low signal-to-noise ratio (SNR). To cope with the low SNR, a spatial averaging over multiple pixels is required, which reduces the spatial resolution. As a result, the evaluation of difference images enables a feature-based detection of unsteady flow separation with the highest possible temporal resolution, whereas the spatial resolution is limited by the low SNR.
Finally, a PCA is applied to a series of thermograms during the occurrence of a gust. As already shown by Gleichauf et al. (2021) in the context of thermographic flow visualisation at wind turbines, the application of a PCA allows the extraction of spatial and temporal varying image information, such as the position of laminar-turbulent flow transition, in the form of uncorrelated principal components (PC). Since the occurrence of unsteady flow separation is characterised by spatial and temporal variations of the surface temperature, we expect that the spatio-temporal evaluation IRT image series with a PCA is suitable for extracting thermal separation signatures. After the image processing by means of a PCA, an increase in contrast between attached and separated flow regions is achieved by considering the spatial intensities
Measurements on a wind turbine of type GE1.5sl are carried out in order to realise a thermographic detection of turbulent flow separation on a wind turbine in operation. The wind turbine has a rated power of 1.5 MW, a hub height of 62 m and is equipped with rotor blades made by the supplier LM Wind Power with a length of 37.3 m. Tape with tufts is attached to the suction side of a rotor blade as a reference method to validate the detection and localisation of turbulent flow separation with IRT. Figure 3 illustrates the tufts-covered rotor blade. Tuft flow visualisation provides an insight into the blade aerodynamics at a reduced complexity and enables the detection of flow separation based on the spatial orientation and dynamics of the tufts (Vey et al., 2014). In the present manuscript the location of the separation point is identified by a zero chord-wise velocity component. Since the tufts influence the flow, only one of the rotor blades is covered with tufts. The rotor blades which are not covered with tufts are used to detect flow separation with IRT. Furthermore, to verify and quantify the maximal deviations in the geometric assignment, markers with known geometric positions are attached in the profile section with the largest thickness at the radial position r = 9 m.
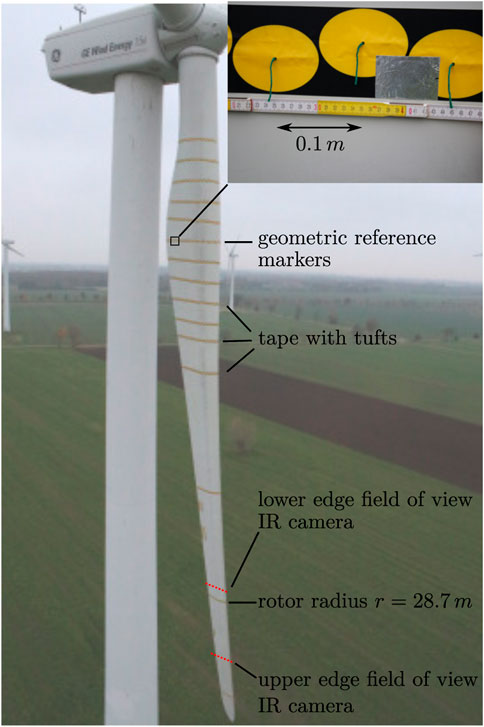
FIGURE 3. Front view on the tufts-covered rotor blade.
Figure 4 shows the experimental setup for the field measurements. The optical measuring equipment consists of an IR camera for the thermographic image acquisition, two cameras in the visible light range (VIS) that are used to photograph the tufts and as a trigger source, respectively, as well as a laser scanner for measuring the yaw movements of the rotor. The IR camera type IR8800 of the manufacturer InfraTec has an actively cooled mercury cadmium telluride detector, which is sensitive at wavelengths between (7.7–10.2) µm and has a noise equivalent temperature difference (NETD) of less than 35 mK at 30°C. According to the propagation of uncertainty, a NETD of less than 35 mK arises for the evaluation of difference images. For the measurement distance of 100 m between the wind turbine hub and the IR camera, a 200 mm focal length object lens provides a field of view with 5.28 m width and 4.28 m height, represented by 640 x 512 pixel2.With the aim to detect unsteady flow separation at a rotor blade position with a significant influence on the efficiency and loads of the wind turbine, the field of view is set to the tip-near rotor region around the rotor radius of 28.7 m at the rotor position of π rad. The rotor radius denotes the distance to the rotor blade flange. The rotor position of π rad is chosen to obtain a complete view on the trailing edge. The series of images that are needed to apply the signal processing approach are acquired by triggering the IR and VL cameras simultaneously each time one of the rotor blades passes the π rad rotor position. For the measurement duration of 10 min, the measured mean rotational speed of the wind turbine of about 16.5 min−1 and a camera integration time of 449 µs, the resulting image series consists of 165 images for each rotor blade with an acceptable motion blur of 2.5 pixel.
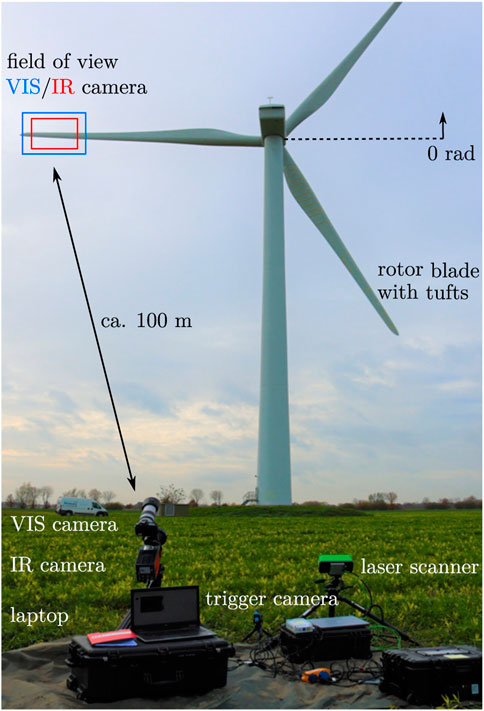
FIGURE 4. An overview of the measurement system for the measurement on the suction side of a wind turbine in operation. The field measurement took place on 14 November 2021, in Thedinghausen, Germany. Note that the orientation of the cameras does not correspond to the field of view respectively the orientation during the measurements.
The subsequent image and signal processing is performed with the software Python. First, the image series is parametrically aligned using an enhanced correlation coefficient maximisation algorithm from OpenCV with the aim to correct uncertainties regarding the trigger position and to enable a pixel-wise signal processing (Evangelidis and Psarakis, 2008). The implementation of the PCA analysis is based on the algotithm of the Python package scikit-learn.
The further objective is to characterise the field measurement conditions with respect to the solar radiation, the wind and the operating characteristics of the wind turbine. Also, we aim to verify the presence, time and position of unsteady flow separation using tufts flow visualisation. The measurements were conducted at a constant yaw angle and an approximately constant solar heat flux. As a result, temporal changes in the IRT-measured surface temperature are primarily caused by unsteady inflow conditions in the form of changes in wind and rotor velocity. During the measurement, the mean wind speed near the ground was about 6 m s−1 and up to 13 m s−1 in gusts. Figure 5 exposes the rotational speed over the measurement time. Since the wind turbine operates with a constant pitch angle and a constant power converter under the given wind conditions, there is a direct correlation between the rotational speed and the wind speed. Thus, the steep increase in the rotational speed at t = 390 s is an indicator of the occurrence of a strong gust, which is a typical cause for flow separation.
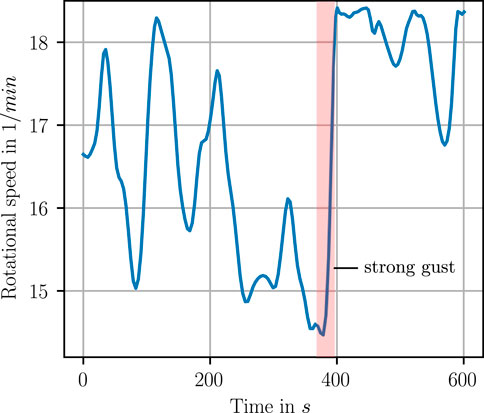
FIGURE 5. Rotational speed of the wind turbine over the time during the measurement. The steep increase of the rotational velocity at t = 390 s indicates the occurrence of a strong gust and, thus, a potential unsteady stall event.
Considering the tufts flow visualisation results shown in Figure 6, flow separation indeed occurs for the times around t = 390 s. The marked separation positions (solid lines) are visible by a zero chord-wise directional component of the tufts and prove the presence of a wide separated flow region. For example, the separation position at the time t = 390 s is localised at x/c = 0.66. Thus, the hypothesis that flow separation is present during the steep increase in rotor speed at t = 390 s is verified. In comparison, under more stationary flow conditions, such as at t = 500 s, no or no significant flow separation occurs, which is in accordance with the desired rotor blade flow behaviour near the tip. As a result, the tufts measurement verifies the existence and the time of occurrence of unsteady flow separation during the experiment.
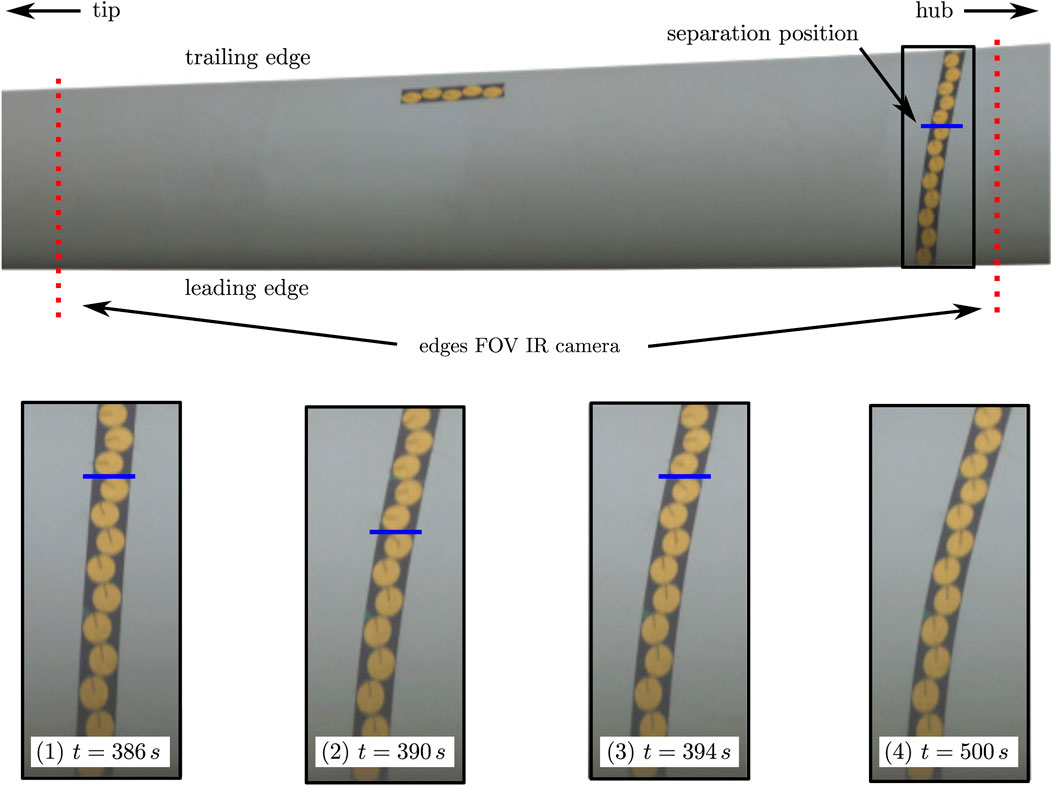
FIGURE 6. Verification of the occurrence and position of unsteady flow separation for the IR camera’s field of view using tufts flow visualisation. The blue solid lines across the tuft tapes reveal the occurrence and position of unsteady flow separation at different times. The location of the separation point is identified by a zero chord-wise alignment component of the tufts.
The potential of the proposed two-step signal processing approach for an IRT-based detection and localisation of unsteady flow separation is investigated. First, the rough identifiability of the occurrence of flow separation by means of the σDIT approach is evaluated. Subsequently, the time- and space-resolved detectability of unsteady flow separation is studied when combining the DIT approach with a PCA analysis, respectively.
The σDIT approach evaluates the standard deviation of difference images to identify the occurrence of unsteady inflow events represented by maxima of the evaluation quantity σ(ΔTs). The field measurement result of the σDIT approach is shown in Figure 7. Figures 7A,B show the course of the evaluation variable σ(ΔTs) including the 1σ confidence interval over the measurement time for the both rotor blades without tufts. The confidence interval is determined by calculating the standard deviation of the outlier-cleaned measurement data. To detect outliers, the Grubbs test with a significance level of 0.05 is used.
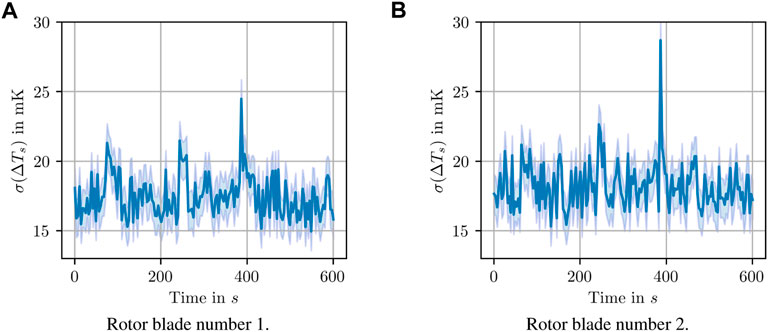
FIGURE 7. The standard deviation of difference images σ(ΔTs) (σDIT approach) over the time for both rotor blades without tufts. The distinct signal maxima at about t = 390 s reveal an unsteady inflow event.
Considering the course of σ(ΔTs) in Figures 7A,B, a distinct signal maximum is visible at t = 390 s and signal noise otherwise. The time of the detected maximum of σ(ΔTs) agrees with the tufts-measured time with flow separation. Furthermore, the noise level of σ(ΔTs) ≈ 18 mK is equal to the camera noise for the given measurement conditions and the confidence interval shows that the characteristic signal maximum is not caused by the uncertainty. Hence, the desired suitability of the σDIT approach for an IRT-based identification of time steps with potential unsteady flow separation events is proven.
In order to realise a time-resolved detection of unsteady flow separation during a gust with IRT, the DIT approach is applied. Here, the objective is to achieve a feature-based detection of unsteady flow separation by means of the thermal response features derived in Section 2.2.
The results of the thermographic field measurements with the DIT approach for the verified duration of the occurrence of unsteady flow separation are shown in Figure 8. Figures 8A1–C1 (left) show the respective difference image for the times t = [386, 390, 394] s. In addition, Figures 8A2–C2 (right) show the mean course of the normalised evaluation variable including the 3 σ confidence interval, over the normalised chord position. Note that each image column is normalised and the averaging is performed in the radial direction, excluding the marked region with the optical artefact. The optical artefact comes from the self-radiation of the optics and is visible due to the low SNR. The influences of cross-flow effects or rotor blade fouling are not considered, since the evaluated region is orthogonal to the leading edge of the rotor blade and the degree of contamination outside the leading edge region is roughly constant.First the time-resolved detectability of different flow regions, with the focus on detecting unsteady flow separation, during the onset of a gust in Figures 8A1,A2 is investigated. In Figure 8A1, the values of the difference image vary around the value ΔTs = 0 K, therefore the influence of adiabatic heating is neglected initially. Furthermore, the region of laminar-turbulent transition is detectable at the leading edge by means of negative temporal temperature gradients ΔTs. As a result of the changed inflow conditions during the gust, the transition moves from the original position (dashed line) upstream to the leading edge. The resulting increased convective cooling within in the region of transition explains the negative temperature gradients ΔTs. For rotor radii smaller than r ≈ 30 m, this effect is not visible, since surface disturbances force a laminar-turbulent transition close to the leading edge, which is independent of the inflow conditions. In comparison, a maximum of the temporal temperature gradient due to a decreasing convective cooling is expected in the separated flow region. In fact, the evaluation quantity ΔTs is maximal in the area of the trailing edge. However, neither the image contrast in Figure 8A1 nor the signal course in Figure 8A2 enable a clear distinction between the turbulent and separated flow region.
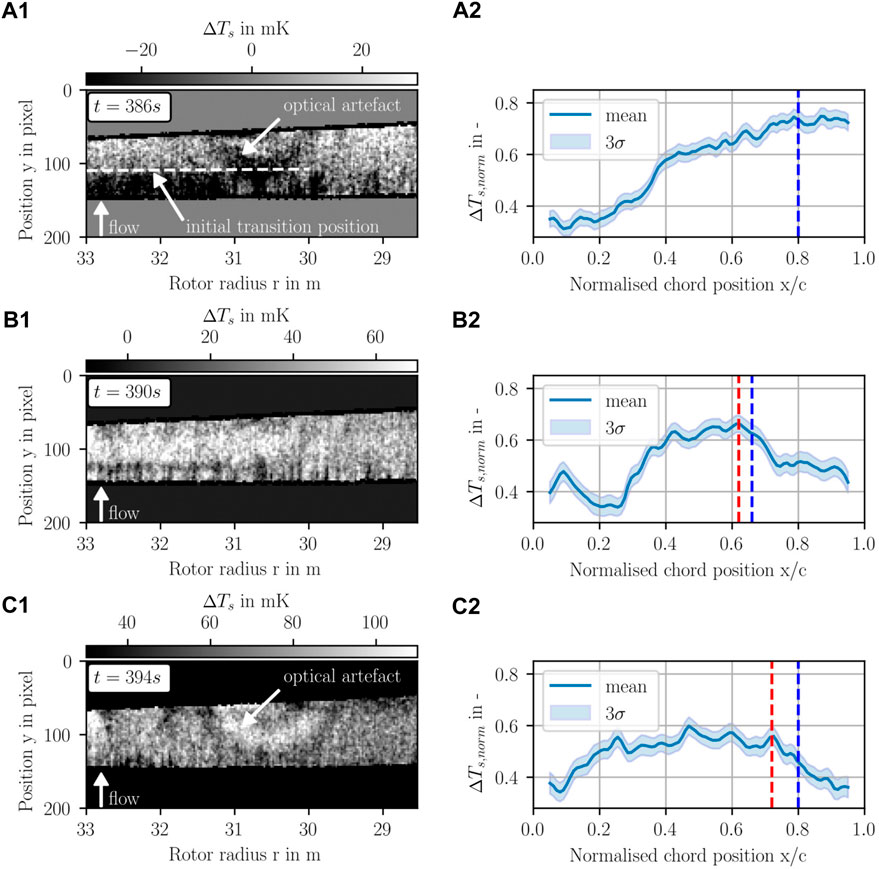
FIGURE 8. Evaluation of thermographic images using the DIT approach for a time range with unsteady flow separation. Left: processed difference images for different times, right: over the rotor radius, excluding the region with the optical artefact, averaged profiles over the normalised chord position. Flow separation is detected by identifying a local maximum and a subsequent clear decrease towards the trailing edge in the signal curves of (B)2 and (C)2 at x/c = 0.62 and x/c = 0.72, respectively (red dashed lines). Blue dashed lines: tufts measured separation position.
In the subsequent difference images Figures 8B1,C1, the range of ΔTs values is clearly positive, i.e.,the rotor blade surface temperature increases at an increased effective flow velocity. Also, the temporal heating of the rotor blade surfaces increases with an increasing rotor radius and, thus, with an increasing effective inflow velocity. Both effects indicate an influence of adiabatic heating. Consequently, a maximum at the separation point as well as a decrease of the temporal temperature gradient is expected in the separated flow region according to Section 2.2. Considering Figures 8B1,C1, regions with minimal values of ΔTs are detectable near the trailing edge, but an extensive region with flow separation is not visible due to the low SNR. In contrast, the spatial averaging over 350 pixel improves the SNR in Figures 8B2,C2 by a factor of 20, whereas the spatial resolution is limited. As a result, a feature-based detection of the spatially averaged separation position is realised on the basis of the clear decrease of ΔTs in Figure 8B2 at x/c = 0.62 and in Figure 8C2 at x/c = 0.72. The shown 3 σ confidence interval with a mean width of 0.25 proves, that the mentioned features for the detection of flow separation are not caused by uncertainties. Note that the detected separation positions using the DIT approach (red lines) are slightly upstream the tuft-measured separation positions (blue lines). Since the tufts act as a vortex generator, that can extend the region of the attached flow, the earlier stall location measured with IRT is plausible. As a result, the DIT approach enables the determination of a spatially averaged separation position during a gust with the maximum time resolution provided by the image acquisition.
The evaluation by means of the PCA comprises 20 consecutive images in the time range of the occurrence and decay of unsteady flow separation (from t = 387 s to t = 454 s). The hypothesis is, that the PCA extracts the time-varying flow information identified in section 4.2 in the form of uncorrelated principle components and, thus, enables the localisation of the separation position with the maximal image resolution.
Figure 9 depicts the results of the PCA-based flow visualisation using the two first principle components. The presented evaluation is limited to the two first principle components, as these represent the relevant flow information and already explain 65% of the variance of the data. The first principle component in Figure 9A and the second principle component in Figure 9B show great differences to each other. The dominant features of the intensity distribution in the first principal component are wedges in the leading edge region and a strong systematic gradient in the radial direction. The wedges are a typical feature for the formation of turbulent structures at the leading edge, while the systematic gradient is likely explained by the different convective cooling of the rotor blade depending on the radial position. In contrast, in the second principle component, an steep increase in intensity is visible over the entire rotor radius near the trailing edge in the direction of flow (dashed line). In agreement with the feature-based detection of the separation position with the DIT approach and the tufts measurement, the resulting region with increased intensity is identified as separated. In addition, within the separated region in Figure 9B and also in Figure 8C1 patterns with a maximum and minimum intensity, respectively, are detectable. The patterns may indicate large scale flow structures, however, a more detailed characterisation cannot be realised in the present study. As a result, the application of the PCA enables to increase the contrast between the attached and the separated flow state region, and to obtain a localisation of the time-averaged separation line over the entire field of view with the maximal image resolution of 8 mm.
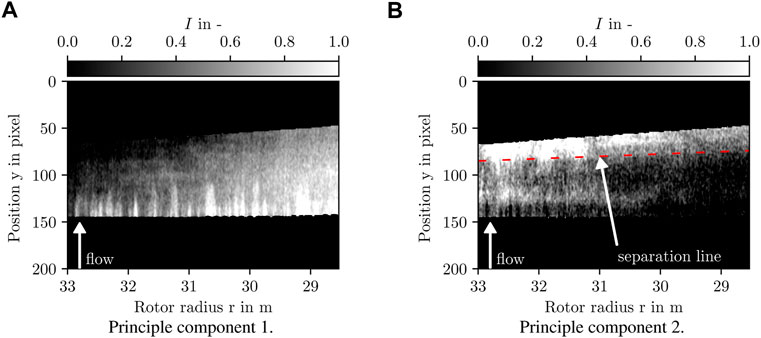
FIGURE 9. Evaluation of 20 consecutive thermographic images acquired during the occurrence of unsteady flow separation over a duration of 67 s by means of a PCA. The PCA enables an extraction of time-varying flow information. The marked separation line in the second principle component (dashed line) is detected over the entire radial width of the field of view with the maximum image resolution of 8 mm on the basis of the image contrast.
To obtain a localisation of the separation position on the 3 days geometry of the rotor blade surface, i.e. the respective chord position, a geometric assignment is required. Therefore the geometric assignment approach from Dollinger et al. (2019) is verified and quantified with regard to the remaining position uncertainty using position markers on the investigated rotor blade for the radial position r = 9 m, which is the rotor radius with the maximal chord length.
Figure 10 shows the comparison of the absolute chord position deviations between the marker positions determined in the image for evaluations with and without a geometric assignment in the units mm and percent of the chord length (%c). The assigned positions show lower deviations from the reference markers on the rotor blade surface compared to the positions without a geometric assignment. On average, the deviation after the assignment is only 39 mm, whereas the deviation without the assignment is 205 mm. Furthermore, the deviation at the chord position with the largest rotor blade thickness at x/c = 0.25 is maximal, and is reduced by the geometric assignment from 321 mm (10.7 %c) to 69 mm (2.3%c). As a result, both the suitability of the geometry assignment for reducing systematic deviations in the assignment of image points to the profile geometry on wind turbines is verified and the maximum deviation after geometric assignment is quantified to (2.3%c).
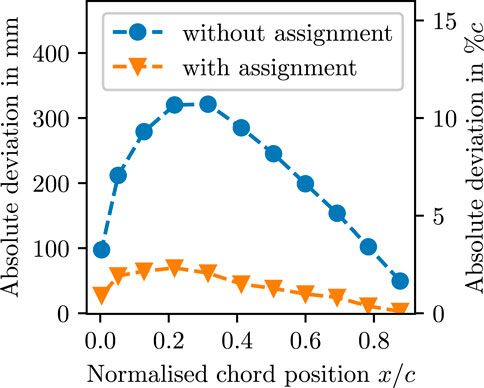
FIGURE 10. Verification of the geometric alignment. Comparison of the absolute deviations between the reference marker positions and the marker positions for the evaluation with and without a geometric assignment. The maximal deviation after geometric assignment is 2.3%c.
Finally, the image separation position of 71%c at the rotor radius of 28.7 m, determined by the PCA-based evaluation, is assigned to the geometry of the rotor blade surface. Figure 11 illustrates the rotor blade geometry as well as the comparison between the image separation position and the corrected separation position, i. e. after conducting the geometric assignment. As a result, the time-averaged separation position of (66 ± 2.3)%c is obtained after the geometric assignment at a rotor radius of 28.7 m during the occurrence of a gust.
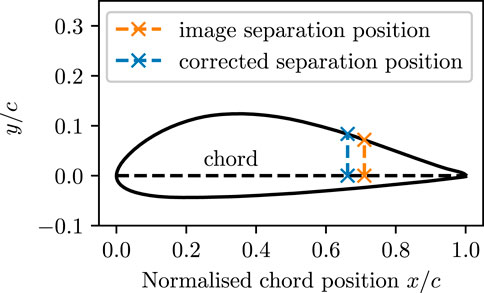
FIGURE 11. Comparison of the image separation position and the corrected separation position using the geometric alignment algorithm for the rotor blade geometry at the rotor radius of 28.7 m.
In order to prove the reproducibility of the thermographic detection of unsteady flow separation using the DIT approach and PCA, a repeat measurement is conducted at the same wind turbine and rotor blade section, respectively. In order to improve the SNR and the contrast between the different flow regions compared to the first measurement, the repeat measurement was carried out on a cloud-free summer day.
Figure 12 shows representative result images of the thermographic evaluation using the DIT approach or PCA during the occurrence of flow separation as a result of a strong gust. In the differential thermogram in Figure 12A, the separation line (dashed line) is visible from a maximum of the temporal temperature gradient. Furthermore, the temporal temperature gradient decreases towards the trailing edge. Both characteristics of the thermodynamic response to a gust are consistent with the results shown in Section 4.2 as well as the expected behaviour according to Section 2.2.
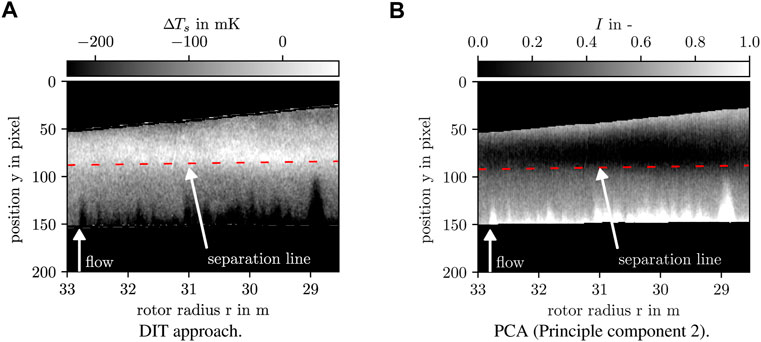
FIGURE 12. Application of the DIT approach and PCA on a repeat measurement during a cloud-free summer day. The selected exemplary differential thermogram enables a detection of the separation line by means of a maximum of the temporal temperature gradient. The PCA provides a high image contrast between the attached and the separated flow region. Finally, the reproducibility of the results of the first measurement is proven.
Considering the result of the PCA, the second principle component in Figure 12B shows an steep decrease in intensity over the entire rotor radius in the direction of flow (dashed line). In accordance with the result of the DIT approach in Figure 12A as well as the PCA in Section 4.3.1, the resulting region of decreased intensity is identified as separated. As a result, the reproducibility of the thermographic detection of unsteady flow separation on an operating wind turbine is proven. Furthermore, the repeat measurements show an increase in the contrast between the attached and separated flow region, caused by improved measurement conditions.
In field measurements on an operating wind turbine, a thermographic detection of unsteady flow separation at a tip-near rotor blade region was realised for the first time. In order to achieve the highest possible spatio-temporal resolution, a two-step signal processing approach was proposed on the basis of the analysis of the thermodynamic response behaviour of the rotor blade surface temperature to unsteady inflow conditions. Based on the findings, the following conclusions are made.
1) The evaluation of the spatial standard deviation of difference images (σDIT approach) enables the identification of times with strongly changing inflow conditions, since changing inflow conditions lead to a spatially different response behaviour of the surface temperature.
2) A combined image evaluation approach consisting of a transient analysis (DIT approach) and the application of a principal component analysis enables to achieve both the maximum time resolution of about 4 s (according to the image acquisition) and the maximum spatial resolution of 8 mm (according to the image resolution) in the detection and localisation of flow separation even for measurement conditions with low solar heating.
3) The presented results for the thermographic detection of unsteady flow separation are reproducible. The repeat measurement indicates, that under measurement conditions with a high solar heating, a stall localisation with the maximum spatial resolution is achievable by using the transient analysis.
4) The geometric assignment approach of Dollinger et al. (2019) is verified and quantified with the result that the detected separation position can be assigned with a maximal deviation of 2.3% of the chord length to the geometry of the rotor blade surface.
Therefore, the suitability of an IRT-based evaluation of the surface temperature response to unsteady inflow conditions for a detection of unsteady flow separation with a high spatio-temporal resolution on an operating wind turbine is proven in the present work. The main limitations of the presented work are the low image acquisition rate due to the spatially fixed field of view and the lack of detailed knowledge regarding the properties of the inflow and the boundary layer flow. To increase the image acquisition rate, future work will focus on the realisation of a co-rotating measurement system. In addition, measurement campaigns are to be carried out on research wind turbines with the capability of measuring the inflow conditions. Finally, in future research we will couple IRT experiments with CFD simulations to improve the understanding of the signal measurement chain and investigate the validity of existing dynamic stall models.
The raw data supporting the conclusion of this article will be made available by the authors, without undue reservation.
This work was led by FO and supervised by AF. Code development and measurements were conducted by FO. All authors contributed to data analysis, generation of results, and writing and editing stages of this work.
The authors gratefully acknowledge the financial support of the Deutsche Forschungsgemeinschaft (DFG project number 420278089).
The authors declare that the research was conducted in the absence of any commercial or financial relationships that could be construed as a potential conflict of interest.
All claims expressed in this article are solely those of the authors and do not necessarily represent those of their affiliated organizations, or those of the publisher, the editors and the reviewers. Any product that may be evaluated in this article, or claim that may be made by its manufacturer, is not guaranteed or endorsed by the publisher.
Adema, N., Kloosterman, M., and Schepers, G. (2019). Development of a second order dynamic stall model. Wind Energy Sci. 5, 577–590. doi:10.5194/wes-2019-87
Aleksyuk, A. I. (2021). The Eckert–Weise effect and energy separation under the flow interference behind side-by-side cylinders. J. Fluid Mech. 915, A95. doi:10.1017/jfm.2021.128
Bons, J. (2005). A critical assessment of Reynolds analogy for turbine flows. J. Heat. Transf. 127, 472–485. doi:10.1115/1.1861919
Corten, G. P., and Veldkamp, H. F. (2001). Insects can halve wind-turbine power. Nature 412, 41–42. doi:10.1038/35083698
Costantini, M., Fuchs, C., Henne, U., Klein, C., Ondrus, V., Bruse, M., et al. (2019). “Experimental analysis of a wind-turbine rotor blade airfoil by means of temperature-sensitive paint,” in AIAA scitech 2019 forum (San Diego, CA: AIAA 2019-0800). doi:10.2514/6.2019-0800
Dollinger, C., Balaresque, N., Gaudern, N., Gleichauf, D., Sorg, M., and Fischer, A. (2019). IR thermographic flow visualization for the quantification of boundary layer flow disturbances due to the leading edge condition. Renew. Energy 138, 709–721. doi:10.1016/j.renene.2019.01.116
Dollinger, C., Balaresque, N., Schaffarczyk, A. P., and Fischer, A. (2016). Thermographic detection of separated flow. J. Phys. Conf. Ser. 753, 072006. doi:10.1088/1742-6596/753/7/072006
Dollinger, C., Balaresque, N., Sorg, M., and Fischer, A. (2018a). IR thermographic visualization of flow separation in applications with low thermal contrast. Infrared Phys. Technol. 88, 254–264. doi:10.1016/j.infrared.2017.12.001
Dollinger, C., Sorg, M., Balaresque, N., and Fischer, A. (2018b). Measurement uncertainty of IR thermographic flow visualization measurements for transition detection on wind turbines in operation. Exp. Therm. Fluid Sci. 97, 279–289. doi:10.1016/j.expthermflusci.2018.04.025
Evangelidis, G. D., and Psarakis, E. Z. (2008). Parametric image alignment using enhanced correlation coefficient maximization. IEEE Trans. Pattern Anal. Mach. Intell. 30, 1858–1865. doi:10.1109/TPAMI.2008.113
Gardner, A. D., Wolf, C. C., and Raffel, M. (2016). A new method of dynamic and static stall detection using infrared thermography. Exp. Fluids 57, 149. doi:10.1007/s00348-016-2235-4
Gartenberg, E., and Roberts, A. S. (1991). Airfoil transition and separation studies using an infrared imaging system. J. Aircr. 28, 225–230. doi:10.2514/3.46016
Gartenberg, E., and Roberts, A. S. (1992). Twenty-five years of aerodynamic research with infrared imaging. J. Aircr. 29, 161–171. doi:10.2514/3.46140
Genç, M. S., Karasu, İ., and Hakan Açıkel, H. (2012). An experimental study on aerodynamics of NACA2415 aerofoil at low Re numbers. Exp. Therm. Fluid Sci. 39, 252–264. doi:10.1016/j.expthermflusci.2012.01.029
Gleichauf, D., Oehme, F., Sorg, M., and Fischer, A. (2021). Laminar-turbulent transition localization in thermographic flow visualization by means of principal component analysis. Appl. Sci. 11, 5471. doi:10.3390/app11125471
Hand, M. M., Simms, D. A., Fingersh, L. J., Jager, D. W., Cotrell, J. R., Schreck, S., et al. (2001). Unsteady aerodynamics experiment phase VI: Wind tunnel test configurations and available data campaigns. doi:10.2172/15000240
Hansen, M., Sørensen, J. N., Voutsinas, S., Sørensen, N., and Madsen, H. (2006). State of the art in wind turbine aerodynamics and aeroelasticity. Prog. Aerosp. Sci. 42, 285–330. doi:10.1016/j.paerosci.2006.10.002
Holierhoek, J. G., de Vaal, J. B., van Zuijlen, A. H., and Bijl, H. (2013). Comparing different dynamic stall models. Wind Energy (Chichester). 16, 139–158. doi:10.1002/we.548
Incropera, F. P., and DeWitt, D. P. (1996). Fundamentals of heat and mass transfer. 4th edition edn. New York City, New York: John Wiley & Sons.
Kuester, M. S., Borgoltz, A., and Devenport, W. J. (2016). “Pressure tap effects on the lift measurement of an airfoil section,” in 32nd AIAA aerodynamic measurement Technology and ground testing conference (Reston, Virginia: American Institute of Aeronautics and Astronautics). doi:10.2514/6.2016-3654
Ladisch, H., Schulz, A., and Bauer, H.-J. (2009). “Heat transfer measurements on a turbine airfoil with pressure side separation,” in Proceedings of the ASME Turbo Expo 2009: Presented at the 2009 ASME Turbo Expo, Orlando, Florida, USA, June 8 - 12, 2009 (New York, NY: ASME), 783–793. doi:10.1115/GT2009-59904
Leishman, J. G. (2002). Challenges in modelling the unsteady aerodynamics of wind turbines. Wind Energy (Chichester). 5, 85–132. doi:10.1002/we.62
Lewis, D. J., and Simpson, R. L. (1996). An experimental investigation of heat transfer in three-dimensional and separating turbulent boundary layers. Virginia Polytechnic Institute and State University.
Martinez Suarez, J., Flaszynski, P., and Doerffer, P. (2018). Application of rod vortex generators for flow separation reduction on wind turbine rotor. Wind Energy 21, 1202–1215. doi:10.1002/we.2224
Medina, P., Schreck, S., Johansen, J., and Fingersh, L. (2011). “Oil-flow visualization on a SWT-2.3-101 wind turbine,” in 29th AIAA applied aerodynamics conference (Reston, Virigina: American Institute of Aeronautics and Astronautics). doi:10.2514/6.2011-3818
Melius, M., Cal, R. B., and Mulleners, K. (2016). Dynamic stall of an experimental wind turbine blade. Phys. Fluids 28, 034103. doi:10.1063/1.4942001
Oehme, F., Gleichauf, D., Suhr, J., Balaresque, N., Sorg, M., and Fischer, A. (2022). Thermographic detection of turbulent flow separation on rotor blades of wind turbines in operation. J. Wind Eng. Industrial Aerodynamics 226, 105025. doi:10.1016/j.jweia.2022.105025
Oehme, F., Suhr, J., Balaresque, N., Gleichauf, D., Sorg, M., and Fischer, A. (2021). Thermographic stall detection by model-inspired evaluation of the dynamic temperature behaviour. Appl. Sci. 11, 8442. doi:10.3390/app11188442
Pereira, R., Schepers, G., and Pavel, M. D. (2013). Validation of the Beddoes-Leishman dynamic stall model for horizontal axis wind turbines using Mexico data. Wind Energy (Chichester). 16, 207–219. doi:10.1002/we.541
Rapin, M., and Ortun, B. (2007). “3D rotational corrections in ONERA aeroelastic predictions of NREL wind turbine,” in 45th AIAA aerospace sciences meeting and exhibit (Reston, Virigina: American Institute of Aeronautics and Astronautics). doi:10.2514/6.2007-213
Reichstein, T., Schaffarczyk, A. P., Dollinger, C., Balaresque, N., Schülein, E., Jauch, C., et al. (2019). Investigation of laminar–turbulent transition on a rotating wind-turbine blade of multimegawatt class with thermography and microphone array. Energies 12, 2102. doi:10.3390/en12112102
Rivir, R. B., Johnston, J. P., and Eaton, J. K. (1994). Heat transfer on a flat surface under a region of turbulent separation. J. Turbomach. 116, 57–62. doi:10.1115/1.2928278
Schaffarczyk, A. P., Schwab, D., and Breuer, M. (2017). Experimental detection of laminar-turbulent transition on a rotating wind turbine blade in the free atmosphere. Wind Energy (Chichester). 20, 211–220. doi:10.1002/we.2001
Snel, H., and Schepers, J. G. (1992). Engineering moles for dynamic inflow phenomena. J. Wind Eng. Industrial Aerodynamics 39, 267–281. doi:10.1016/0167-6105(92)90552-L
Snel, H., Schepers, J. G., and Montgomerie, B. (2007). The Mexico project (Model Experiments in Controlled Conditions): The database and first results of data processing and interpretation. J. Phys. Conf. Ser. 75, 012014. doi:10.1088/1742-6596/75/1/012014
Terekhov, V. (2021). Heat transfer in highly turbulent separated flows: A review. Energies 14, 1005. doi:10.3390/en14041005
Tobin, N., Zhu, H., and Chamorro, L. P. (2015). Spectral behaviour of the turbulence-driven power fluctuations of wind turbines. J. Turbul. 16, 832–846. doi:10.1080/14685248.2015.1031242
van Kuik, G. A. M., Peinke, J., Nijssen, R., Lekou, D., Mann, J., Sørensen, J. N., et al. (2016). Long-term research challenges in wind energy – A research agenda by the European academy of wind energy. Wind Energy Sci. 1, 1–39. doi:10.5194/wes-1-1-2016
Verein Deutscher Ingenieure (2010). VDI heat atlas. VDI-Buch. 2 edn. Berlin: Springer-Verlag Berlin Heidelberg. doi:10.1007/978-3-540-77877-6
Vey, S., Lang, H. M., Nayeri, C. N., Paschereit, C. O., and Pechlivanoglou, G. (2014). Extracting quantitative data from tuft flow visualizations on utility scale wind turbines. J. Phys. Conf. Ser. 524, 012011. doi:10.1088/1742-6596/524/1/012011
Keywords: IR thermographic flow visualisation, flow separation, dynamic stall, IRT on wind turbines, wind turbine flow separation
Citation: Oehme F, Gleichauf D, Balaresque N, Sorg M and Fischer A (2022) Thermographic detection and localisation of unsteady flow separation on rotor blades of wind turbines. Front. Energy Res. 10:1043065. doi: 10.3389/fenrg.2022.1043065
Received: 13 September 2022; Accepted: 11 November 2022;
Published: 29 November 2022.
Edited by:
Ahmad Fazlizan, National University of Malaysia, MalaysiaReviewed by:
Daniel Micallef, University of Malta, MaltaCopyright © 2022 Oehme, Gleichauf, Balaresque, Sorg and Fischer. This is an open-access article distributed under the terms of the Creative Commons Attribution License (CC BY). The use, distribution or reproduction in other forums is permitted, provided the original author(s) and the copyright owner(s) are credited and that the original publication in this journal is cited, in accordance with accepted academic practice. No use, distribution or reproduction is permitted which does not comply with these terms.
*Correspondence: Felix Oehme, Zi5vZWhtZUBiaW1hcS5kZQ==
Disclaimer: All claims expressed in this article are solely those of the authors and do not necessarily represent those of their affiliated organizations, or those of the publisher, the editors and the reviewers. Any product that may be evaluated in this article or claim that may be made by its manufacturer is not guaranteed or endorsed by the publisher.
Research integrity at Frontiers
Learn more about the work of our research integrity team to safeguard the quality of each article we publish.