 Jiarui Xie
 Fei Tang
 Junfeng Qi
95% of researchers rate our articles as excellent or good
Learn more about the work of our research integrity team to safeguard the quality of each article we publish.
Find out more
ORIGINAL RESEARCH article
Front. Energy Res. , 09 January 2023
Sec. Smart Grids
Volume 10 - 2022 | https://doi.org/10.3389/fenrg.2022.1038892
This article is part of the Research Topic Data-Driven Situational Awareness and Decision Making for Smart Grid Operation View all 17 articles
Considering the voltage rise problem caused by integrating large-scale distributed generation into the distribution networks, a distributed generation hosting capacity assessment method based on the improved holomorphic embedding method is proposed. First, the relationship between distributed generator penetration and voltage at the access point is explored and voltage violation is used as a constraint to solve the hosting capacity. Secondly, a self-defined directional holomorphic embedding method is proposed based on the classical model, further, the safety region under voltage constraints is derived. The intersection of the bus trajectory with the boundary of the voltage constraint region is used as the criterion for judging the maximum hosting capacity of distributed generation under a single access scenario. Then, a sufficient number of distributed generation access scenarios are generated using Monte Carlo, and the proposed criterion is used to solve the hosting capacity under each scenario. The cumulative distribution curve is obtained by statistically solving admission capacity data, which can represent the relationship between the level of voltage violation risk and the hosting capacity of distributed generation. The validity and correctness of the proposed method are verified on the IEEE 22-bus distribution network.
Under the severe form of global energy transformation and global fossil energy depletion, distributed generation (DG) is widely connected to the distribution network due to its high utilization efficiency and low negative environmental impact. With the increasing penetration rate of DG, the radial single-way distribution network will be transformed into a complex network with dense distribution and user interconnection. This change will inevitably have a negative impact on the line loss, power quality, and operational stability of the distribution network, voltage violation is particularly evident among them. (Dong et al., 2019). Therefore, analyzing and evaluating the DG hosting capacity of distribution networks considering voltage violation is of great practical significance.
At present, domestic and foreign scholars are rich in technical research on DG access to distribution networks (Keane et al., 2013; Mahmud et al., 2014), and also pay more attention to the voltage violation problem (Shayani et al., 2011; Yuan et al., 2020) caused by DG access to distribution networks, and start to try different new methods for research and solution. The holomorphic embedding method (HEM) (Trias 2012) is a power flow calculation method proposed by Antonio Trias, a Spanish scholar, in 2012, which is different from the conventional iterative idea. The characteristics of this method can be summarized as three points: 1) non-iterative, the solution process is a recursive process rather than iterative, avoiding the situation that the power flow does not converge due to the convergence of the algorithm; 2) unique initial values, unlike the conventional iterative method that requires setting appropriate initial values, a set of holomorphic embedding equations has definite and unique initial values; 3) deterministic, when the power flow solution exists, the correct solution can be obtained, and when the power flow has no solution, a clear signal of voltage collapse can be given.
Recently, the HEM has been gradually attached to scholars and applied to the field of power system voltage stability analysis (Singh and Tiwari, 2020; Gao et al., 2021; Lai et al., 2022). The calculation of voltage collapse points using HEM has a significant advantage over the continuous power flow since the method requires only one calculation to obtain the results (Yang, 2015; Du et al., 2021). The visualized Sigma index (Trias 2014) based on the HEM is proposed to determine the margin of buses from the instability boundary. Still, the imaginary part of the bus voltage is strongly correlated with the position of Sigma, so it cannot determine the margin by relying on the distance of the Sigma index to the boundary. Further, the concept of Sigma trajectory (Lai et al., 2021; Liu et al., 2022) is proposed, which determines the weak voltage buses in the order in which the Sigma trajectory touches the boundary, and the method achieves this purpose accurately. All the above studies adopt the scalable holomorphic embedding model, which is only applicable to the scenario where the system load and the active output of the generator are scaled in the same proportion, so it is not easy to be applied to the analysis of distributed generation hosting capacity.
The research methods for DG hosting capacity are mainly divided into analytical methods, intelligent optimization methods, and stochastic scenario simulation methods (Dong et al., 2019). The analytical method can generally be translated into solving optimal power flow problem, usually using methods such as second-order cone programming (Xing et al., 2016) to convert some of the nonlinear constraints into linear constraints to speed up the solution of DG hosting capacity. The intelligent optimization algorithm (Sun et al., 2015; Rabiee and Seyed, 2017; Zhou et al., 2017) is more convenient for obtaining the optimal global solution, so it is mostly used for solving more complex multi-objective optimization models. The rapid solution process is the advantage of the analytical method and the intelligent optimization algorithm. However, the results obtained characterize the optimal configuration of the model and are often more optimistic than the actual distribution network’s hosting capacity (Jin et al., 2022). The stochastic scenario simulation method (Zhao et al., 2015; Liu et al., 2022) refers to the calculation and statistics of the hosting capacity of the randomly generated DG access scenarios under certain constraints, which can be more accurate in terms of the actual hosting capacity. Yet, it is computationally laborious, as follows: 1) a sufficient number of scenarios need to be calculated to ensure the credibility of the results; 2) when calculating the hosting capacity of a specific scenario, multiple cycles of judgment are required, which is time-consuming.
In summary, this paper constructs an analysis process based on the HEM for the DG hosting capacity of the distribution network, which can balance the assessment accuracy and computational complexity. The specific steps are as follows: first, the relationship between DG penetration rate and voltage at the access point is analyzed, and it is clear that voltage violation is the critical factor limiting DG access to the distribution network. Then, to address the limitations of the existing HEM, the traditional model is improved into a self-defined directional holomorphic embedding model so that it can be used for DG hosting capacity analysis. A voltage constrained region based on the Sigma index is derived, and the bus Sigma trajectory intersecting with the region boundary is used as the criterion for the maximum DG hosting capacity, which can realize the solution process of a single access scenario view. At the same time, the embedded impedance mode margin index is proposed to quantify the static voltage stability of buses, and the weak buses of the system are removed according to this index to narrow the range of DG alternative sets, which can reduce the computational effort brought by the random scenario simulation method. Finally, Monte Carlo is used to simulating mutually independent DG access scenarios in the alternative set, and the proposed criterion is used to solve the DG hosting capacity under each scenario. The cumulative distribution function based on the voltage violation risk is statistically obtained, which reflects the relationship between the voltage violation risk and DG hosting capacity.
The rest of this paper is organized as follows: Section 2 analyzes the mechanism of voltage rise at the access point due to DG access. Section 3 describes the improved HEM and the criterion for determining the maximum DG hosting capacity based on the voltage constraint region. Section 4 describes the DG hosting capacity calculation process, considering the risk of voltage violation. Section 5 simulates the IEEE 22-bus distribution network system and analyzes the effects of the number of DG accesses and power factor on the hosting capacity. Finally, Section 6 summarizes the main conclusions.
The low-voltage distribution network typically has a radial structure, and when DG is connected to the distribution network, its operation will directly affect the voltage at the access point. Figure 1 is a simplified topology diagram of DG connection to the distribution network, where E is the generator voltage, U is the voltage at the DG connection point, I is the line current, Pload + jQload is the load, PDG + jQDG is the DG injected power, S1 is the generator output power, S2 is the total power at the DG connection point, and Zline is the line impedance. Write the voltage balance equation for this topology column, as shown in Equation 1:
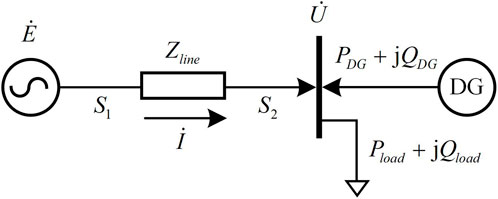
FIGURE 1. DG access distribution network diagram.
Since the losses of the distribution network mainly come from the distribution transformers, where the line losses account for a relatively small percentage (Ding et al., 2000), compared to the load power and the DG injection power can be neglected, this paper makes S1 = S2 and the load has the same reactive power/active power λ as DG.
From Equation 2, it can be seen that as the DG injected power gradually increases, the current amplitude of the line will gradually decrease to zero and then increase in reverse. As shown in Figure 2, with the increase of DG penetration, the line current decreases from I1 to I2 and then increases to I3 in the reverse direction, and the voltage amplitude of DG connection point corresponding to different currents is U1<U2<U3. Even the voltage at the access point is higher than the generator voltage under the action of reverse current.
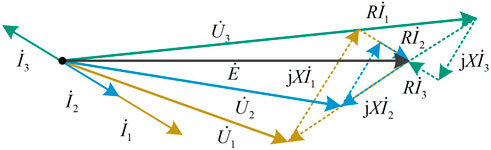
FIGURE 2. Access point voltage vector diagram.
As such, the above analysis determines that DGs access to the distribution networks lead to a voltage rise at the connection point, and the voltage amplitude positively correlates with the DG penetration rate. This phenomenon may lead to voltage violation at the connection point, so voltage violation will be a crucial factor limiting DG hosting capacity.
A function f(z) = u (x,y)+iv (x,y) is claimed to be holomorphic in region D if f(z) is differentiable at every point in the region D. Another equivalent condition for a function to satisfy holomorphic in region D is the existence of continuous partial derivatives of u = u (x,y) and v = v (x,y) at every point in the region D and the satisfaction of the Cauchy-Riemann condition, As shown in Equation 3:
An essential property of the holomorphic function is that f(z) can be expanded into a power series in some domain at any point in D, as shown in Equation 4:
For the conventional HEM, it is correct only for a particular operating state of the network and cannot scale the network generator output and load level. For the scalable HEM, all generator active power outputs and load levels can only be scaled in proportion to the embedding factor s. However, for non-global scaling scenarios (i.e., some buses are scaled and some buses are fixed) neither of the above two models is applicable. In this section, the holomorphic embedding model is improved so that the scaling direction of the improved model can be self-defined. This creates the conditions for using the HEM to analyze DG hosting capacity issues.
The set of holomorphic embedding equations in the self-defined direction is shown in Equation 5, where Yik is the element at (i,k) in the bus derivative matrix, Si=Pli + jQli is the load complex power at bus i, Visp is the voltage set at the slack and PV buses, Pgi is the active power emitted by the generator at bus i, Pli is the load active power at bus i, and Qli is the load reactive power at bus i. ΔSi is the scaling unit for load at PQ bus i. ΔPgi, ΔPli and ΔQli are the generator active power scaling unit, load active power scaling unit, and load reactive power scaling unit at PV bus, respectively. All the above power scaling units can be self-defined.
Vi(s), and Qgi(s) are holomorphic functions of voltage and reactive power concerning the embedding factor s, which can be uniquely expanded to the Maclaurin series, as shown in Equation 6:
Where V [n] and Q [n] are both coefficients of the series, the voltage in the Cartesian axes is represented by a complex number, so the voltage coefficient V [n] is complex number, and the generator’s reactive power output is real number, so the reactive power coefficient Q [n] is real number. The analytical expressions for the voltage and reactive power output concerning the embedding factor s are obtained by bringing the two functions into the power flow equations to solve the coefficients.
For simplicity of expression, define the inverse function of voltage Wi(s). The inverse function satisfies the requirements of Equation 7.
Expanding the voltage function and the voltage inverse function in Equation 7 into the series form:
Rectifying Equation 8 to obtain the recursive equation:
The recursive equation for the PQ bus is shown in Equation 10:
The recursive equation for the slack bus is represented by Equation 11:
For the PV bus, the recursive equation can be expressed as Equation 12:
where Pi = Pgi−Pli and ΔPi = ΔPgi−ΔPli.
where ℜ denotes taking the real part and ℑ denotes taking the imaginary part.
The real and imaginary parts of Equations 9–13 are separated and written in the form of matrices. The left-hand side coefficient matrix is known and the right-hand side matrix can be solved recursively. Furthermore, Vi[n], Wi[n], and Qgi[n] can be obtained by solving the set of linear equations.
The germ (Du et al., 2021) of self-defined directional HEM does not have the same meaning as the germ of the scalable HEM. The physical meaning of the germ of the scalable model represents the system state with no load and no generator, but the germ of the self-defined directional model represents the state with rated load and generator output. The germ Vi [0], Wi [0], and Qgi [0] of the improved model can be derived from the traditional power flow methods or the conventional HEM.
Write the current balance equation for the two-bus system in Figure 3, as shown in Equation 14:
Where Veq = YlgVg/(Ylg + Yll), YL = Ylg + Yll.
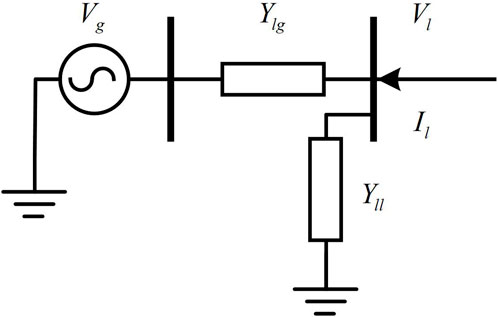
FIGURE 3. Simplified diagram of two bus system.
Furthermore, the bus voltage is normalized and expressed by Equation 16:
Where: U=Vl/Veq, defined as the normalized voltage, Sl = VlIl* is the load power. σ = Sl*/(YL|Veq|2), defined as the Sigma index, which is a complex index that can reflect the system’s static voltage stability margin.
Next, separating the imaginary and real parts of Equation 16 can be obtained as Equation 17:
After squaring the upper and lower equations of Equation 24 and adding them together, it equals:
From Equation 18, F (|U|2) is a parabola with an opening upward and the coordinate of the vertex d is (ℜ(σ)+0.5, ℑ(σ)2−ℜ(σ)−0.25). If the equation is solvable, it must satisfy that the vertex vertical coordinate is less than or equal to zero (i.e., yd = ℑ(σ)2−ℜ(σ)−0.25 ≤ 0). Therefore, the boundary that makes the equation solvable can be drawn on the Sigma plane, defined as the system’s instability boundary, as shown by the blue parabola in Figure 4. If the Sigma index of the bus is always inside the parabola means that the system is stable; if it is on the parabola, the system is in a state of critical instability; if it is outside the parabola means that the system is unstable.
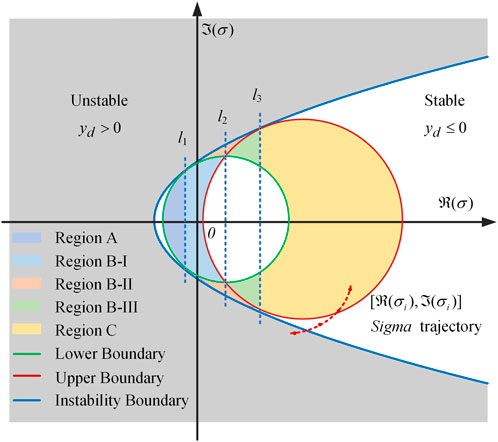
FIGURE 4. System instability boundary and voltage constraint region.
Further, if the solution of the equation is required to be a fixed value R, it means:
Simplify and organize equation (19) to obtain equation (20):
It can be observed that Equation 20 is a circle with a center of (R2,0) and a radius of R. The bus normalized voltages’ amplitudes corresponding to the circle trajectory points are all equal to R.
If the restriction on the solution of the equation is weakened to allow the amplitude of the normalized bus voltage to vary in some range, RL2≤|U|2 ≤ RH2. Then the voltage amplitude is satisfied when the bus Sigma index varies within the colored region (including region A, region B-I, region B-II, region B-III, and region C) in Figure 4, where the colored region is defined as the voltage constraint region.
We illustrate Figure 4 with some details. It is not difficult to prove that both the upper and lower boundary circle trajectories are tangent to the instability boundary, and the horizontal coordinates of Qureshi et al., 2020, Ballanti and Ochoa, 2015, Navarro and Navarro, 2017 Chen et al., 2017 Abad et al., 2018 Kulmala et al., 2017 Torquato et al., 2018 the intersection point with the boundary of the lower boundary are RL2-0.5, and the horizontal coordinates of the intersection point with the boundary of the upper boundary are RH2-0.5, which exactly correspond to the conditions of Scenario 1 and Scenario 3, and the regional divider l1: ℜ(σ) = RL2−0.5, l3: ℜ(σ) = RH2−0.5. In addition, the upper boundary circle and the lower boundary circle have two intersection points with the transverse coordinates of 0.5 (RL2+RH2-1), at which time the symmetry axis of F (|U|2) is located at the midpoint of RL2 and RH2, and the low voltage solution is exactly equal to RL2 and the high voltage solution is exactly equal to RH2. The detailed partitioning of the constraint region and the proof process are shown in Figure 5.
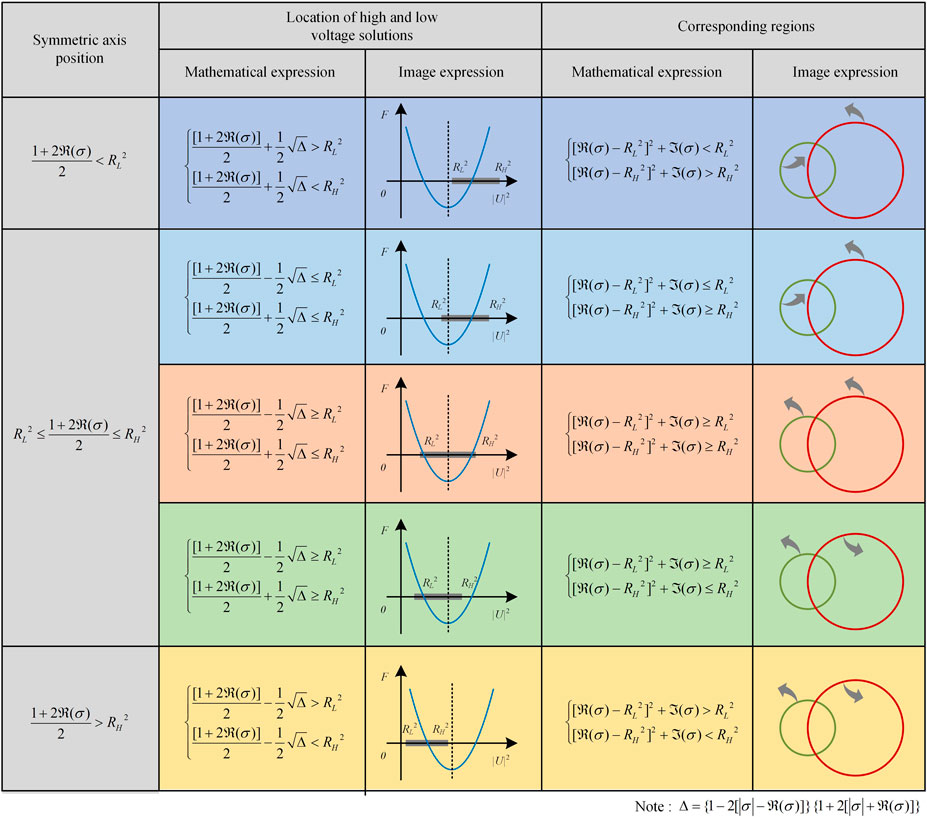
FIGURE 5. Voltage constraint region partitioning proof.
In the evaluation of the admittance capacity, we need to continuously input DG power into the network and observe when the system crosses the voltage limit. The Sigma index is a description of a certain state of the system, but we need to continuously obtain the Sigma indexes of different states of the system, and the curve they connect to form is called the Sigma trajectory σi(s). The way σi(s) is embedded and solved is shown below.
Solving the Sigma index with HEM requires performing the embedding factor s into the Sigma index and the normalized voltage of Equation 16:
From the properties of holomorphic functions, it follows that the Sigma function can be expressed in power series form as:
Based on the equality of the power series coefficients on both sides of the equation, it is deduced that:
All coefficients of the series σ[n] can be calculated according to Equation 23, which means that the condition for plotting the Sigma trajectory is available. In this paper, the intersection of the bus Sigma trajectory with the boundary of the voltage constraint region is used as the criterion for determining the maximum hosting capacity of DG. When the Sigma Shayani and Oliveira, 2011 Yang, 2015 Liu et al., 2020 Wang et al., 2016 Qureshi et al., 2021 Tang and Chang, 2018 Varma and Singh, 2020trajectory intersects the boundary of the set voltage constraint region for the first time means that the system has voltage violation, by recording the embedding factor s at this point, we can calculate the DG hosting capacity for the current access scenario.
When using the stochastic scenario simulation method for DG hosting capacity analysis, a specified number of access locations (n) in the DG alternative set (m) need to be selected for the hosting capacity operation, and a total of
From the circuit principle, it is clear that for a linear circuit containing a constant voltage source, internal resistance, and load resistance, the maximum transmitted power can be obtained when the load resistance is equal to the internal resistance of the power source. Research (Li et al., 2014) extends the above conclusions on maximum power transfer strictly to non-analytic complex variable systems. The necessary condition for obtaining the maximum value of active power at the load bus in a non-analytic complex power system is that the system dynamic equivalent impedance amplitude is equal to the load static equivalent impedance.
The integrated dynamic impedance is defined as the slope of the voltage concerning the current curve, but since the bus voltage is not a complex analytic function of the load current in a non-analytic complex system (Li et al., 2014), finding the dynamic equivalent impedance of the system requires the injected power as a covariate and then the derivative of the complex function, as shown in Equation 24:
From the maximum transmission power theorem, it can be obtained that if the system satisfies the maximum power transmission condition, the load bus is in a critical state of static voltage stability. From this, the embedded impedance mode margin index can be defined as follows:
where different values of s represent different system states, and s = 1 represents the rated state system.
μ(s) represents the system’s distance from the maximum transmission power condition. The value of μ(s) ranges from 0 to 1, and the larger the value, the more stable the current system state is. μ(s) = 0 means the system is at the static voltage stability boundary, and μ(s) < 0 means the system is destabilized. After bringing in different s-values according to the demand, the EIMM index of the bus with load can be acquired, and the ranking of the strength of the static voltage stability of the system buses in different operating states can be obtained.
To obtain the expression for ZiTHEV(s), the analytical expression for the bus voltage Vi(s) is first derived concerning the embedding factor s as follows:
The relationship between voltage and current is shown in Equation 27 below:
where
The analytic expression of the current concerning the embedding factor s is equal to:
The analytic expression of the current Ii(s) is derived concerning the embedding factor s:
The integrated dynamic equivalent impedance at bus i is equal to:
The static equivalent impedance of the load at bus i is expressed as follows:
The embedded impedance mode margin μi(s) of each bus is obtained by bringing Equation 30 and Equation 31 into Equation 25.
This paper applies the stochastic scenario simulation method to solve the DG hosting capacity under the risk of voltage violation. The flow chart is shown in Figure 6 and the specific steps are described as follows:
1) The bus strength is evaluated using the EIMM index, and the buses with poor static voltage stability and high voltage amplitude are eliminated, so that the remaining buses are considered as an alternative set for DG access;
2) Generating a certain number of DG access scenarios using Monte Carlo simulations, with variance coefficients set in advance as stopping conditions for the simulations;
3) Determine the number of connected distributed generation n and the power factor, denoted as DG1, DG2, … , DGn;
4) Set the initial access total active power of the DGs, distribute the DGs’ access power (ΔP1, ΔP2, … ,ΔPn) based on the load active power ratio at the DGs’ access site, and set the associated reactive power (ΔQ1, ΔQ2, … ,ΔQn) following the power factor. The scaling unit for DGs is the above ΔSi = ΔPi + jΔQi;
5) Solving the self-defined directional holomorphic embedding model and calculating the Sigma index σi(s) for each bus;
6) Set the upper and lower boundaries of the bus voltage amplitude, gradually increase the embedding factor s and plot the trajectory of each bus in the Sigma plane. If there is a bus trajectory intersecting with the upper and lower boundary circles (as shown in Figure 7), record the corresponding s value at this time and calculate the hosting capacity of the system under this DG access scenario;
7) Statistical acquisition of probability distribution curves as well as cumulative distribution curves of DG hosting capacity after the Monte Carlo simulation has been stopped;
8) Determine the acceptable level of voltage violation risk and obtain the DG hosting capacity of the distribution network considering the risk according to the cumulative distribution curve.
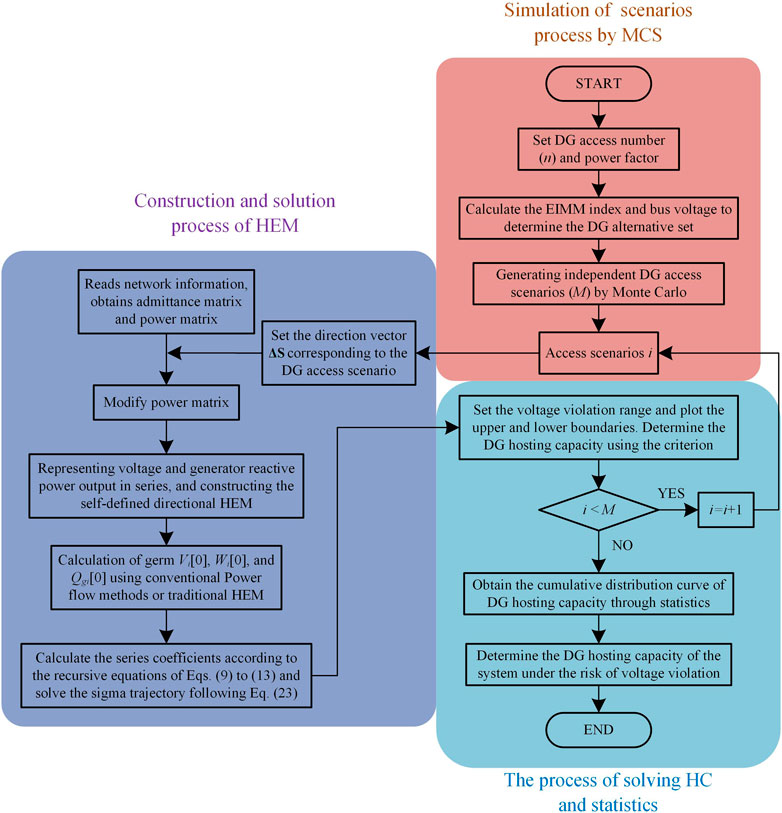
FIGURE 6. Flow chart of DG hosting capacity assessment of distribution network.
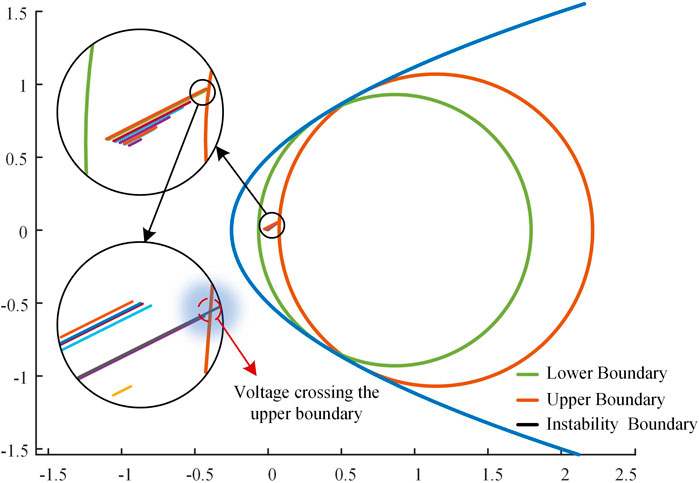
FIGURE 7. Bus sigma index crossing boundary diagram.
This paper uses the 22-bus distribution network system (Raju et al., 2012) for simulation. The parameters are set according to the simulation requirements in Section 4.2 as follows:
1) Calculate each bus’s EIMM index and initial state voltage, as shown in Table 1. Eliminate the buses with poor static voltage stability (the weakest four buses are eliminated in this paper); (2) eliminate the buses with higher voltage (the initial voltage offset of this system is relatively small, so the buses are not eliminated). The remaining 17 buses (excluding slack bus) are all used as DG access alternative sets;
2) Set the Monte Carlo simulation stopping condition to a variance coefficient of β < 0.005;
3) Set the number of different DG accesses n = [2, 4, 6, 8, 10, 12, 14], and set different power factors PF = [0.95 (leading), 1.0, 0.95 (lagging)]
4) Set the initial access total active power of DGs to 1 MW and calculate the power scaling unit ΔSi corresponding to each DG;
5) Since the allowable deviation of the three-phase supply voltage at 10 kV and below is ± 7% of the rated voltage, the bus voltage amplitude range is set to (0.93,1.07);
6) Set the acceptable voltage violation risk to 10%.
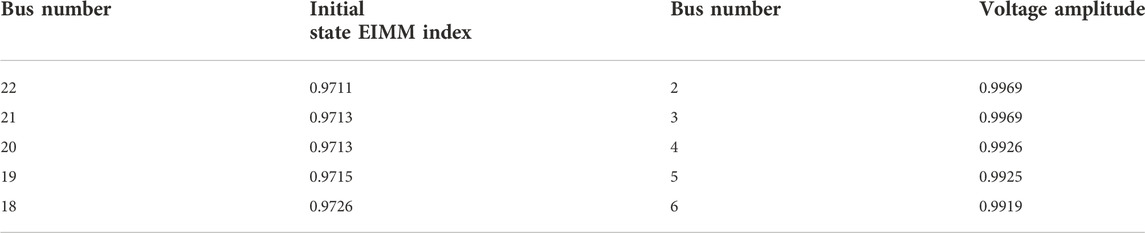
TABLE 1. Bus static voltage stability and voltage amplitude.
The probability distribution curves and cumulative distribution curves for different DG access numbers when the DG power factor is equal to 1 are given in Figure 8. It can be seen that as the number of DG accesses n increases, the probability distribution curve shifts to the right as a whole, implying that the DG hosting capacity also increases; in the cumulative distribution diagram, the horizontal coordinates of the intersection of each curve with the dashed line represent the DG hosting capacity of the distribution network at different access numbers. When n = 2, the access active power Pmin = 3.24MW, and when n = 14, the access active power Pmax = 4.1 MW. The reason for this “the more decentralized the access, the stronger the capacity” is that more access locations can better match the load of the access points locally, which can reduce the probability of backflow caused by excessive power injection at individual buses, thus reducing the risk of over-voltage at the buses.
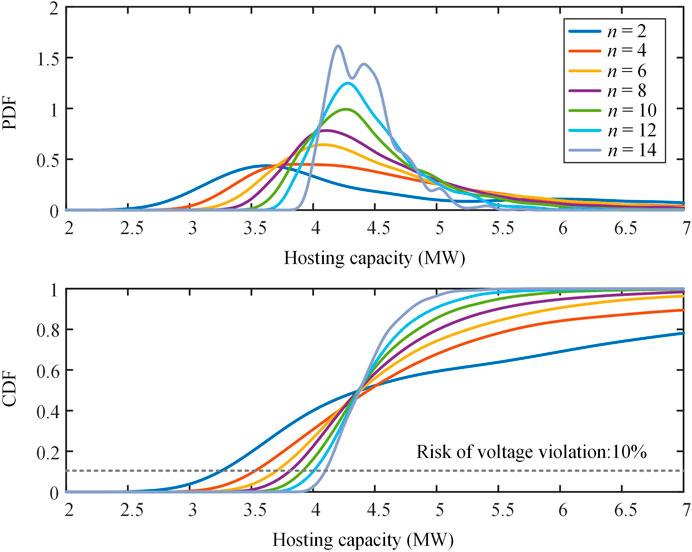
FIGURE 8. PDF and CDF of DG hosting capacity at PF = 1.
Figure 9 shows the system hosting capacity corresponding to the three DG power factors. As shown in the figure, when the DG operates at the leading power factor, the system hosting capacity increases with the increase in power factor. This is because when DG penetration is low, the reactive power emitted is used to balance the reactive load at the access point. As the penetration rate of DG continues to rise, the redundant reactive power generated by DG starts to be injected into the grid after the load reactive power is fully balanced, which will cause the system bus voltage to rise rapidly and cause the voltage to exceed the upper boundary. Therefore, the smaller the percentage of reactive power emitted by DG, the smaller the probability of voltage crossing the upper boundary at the access point, and the higher the hosting capacity of the system.
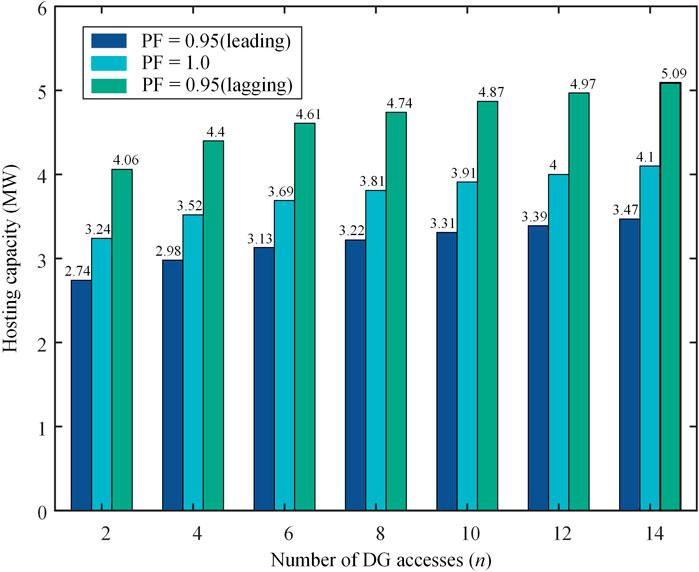
FIGURE 9. DG hosting capacity at different power factors and access numbers.
When the power factor of DG changes from leading to lagging, the system’s hosting capacity will continue to improve. The main reason is that the absorption of reactive power by DG reduces the voltage level at the access point, which to a certain extent slows down the rising trend of voltage caused by active power injection and delays the timing of voltage crossing the upper boundary at the access point, thus improving the hosting capacity of the system. When the lagging power factor equals 0.95 and n = 14, the maximum DG admitted active power Pmax = 5.09 MW for this distribution network. Therefore, DG appropriately absorbs reactive power for regulating the voltage at the access point, which is conducive to enhancing the hosting capacity of the system. However, excessive absorption of reactive power may cause the bus voltage to cross the lower boundary, reducing the system’s hosting capacity.
This paper combines an improved holomorphic embedding method with the stochastic scenario simulation method for evaluating the DG hosting capacity of distribution networks. It can accurately evaluate the hosting capacity while considering the computational efficiency. The main conclusions are as follows:
1) Improvement obtains the self-defined directional HEM, and the methodology for solving it is provided. The voltage constraint region based on Sigma index is derived from this, and the bus Sigma trajectory intersecting the voltage constraint region is used as the criterion for deciding of the maximum value of DG hosting capacity. Compared with the traditional methods, using the HEM does not require multiple iterations and only needs to solve the model once to obtain the results, which can effectively improve the efficiency of a single solution;
2) The embedded impedance mode margin index is proposed for quantifying the static voltage stability of buses to reduce the number of DG alternative buses, which effectively reduces the computational effort introduced by using the stochastic scenario simulation method;
3) The influencing factors of DG hosting capacity of distribution network are explored. The simulation found that the more DG access locations, the higher the ability of the distribution network to accept DG; the lagging power factor is more favorable to improving the ability of the distribution network to accept DG compared to the leading power factor.
For the IEEE 22-bus distribution system, the maximum DG hosting capacity of the system is 5.09 MW at the acceptable voltage violation risk level of 10%.
The original contributions presented in the study are included in the article/Supplementary Material, further inquiries can be directed to the corresponding author.
JX was responsible for article construction article ideas, manuscript writing, simulation experiments, and data analysis. FT was responsible for review and supervision. JQ and XL were responsible for organizing data and drawing figures. ZnL, ZoL, and YG were responsible for checking for errors and polishing the manuscript. All authors contributed to read, and approved the submitted version.
Project Supported by National Natural Science Foundation of China (NSFC) (NO.51977157).
The authors declare that the research was conducted in the absence of any commercial or financial relationships that could be construed as a potential conflict of interest.
All claims expressed in this article are solely those of the authors and do not necessarily represent those of their affiliated organizations, or those of the publisher, the editors and the reviewers. Any product that may be evaluated in this article, or claim that may be made by its manufacturer, is not guaranteed or endorsed by the publisher.
DG, distributed generation; HEM, holomorphic embedding method; EIMM, embedded impedance mode margin; PDF, probability density function; CDF, cumulative distribution function; PF, power factor; HC, hosting capacity.
Abad, M. S. S., Ma, J., Zhang, D., Ahmadyar, A. S., and Marzooghi, H. (2018). Probabilistic assessment of hosting capacity in radial distribution systems. IEEE Trans. Sustain. Energy 9, 1935–1947. doi:10.1109/TSTE.2018.2819201
Ballanti, A., and Ochoa, L. F., 2015. On the integrated PV hosting capacity of MV and LV distribution networks. Proceedings of the 2015 IEEE PES Innovative Smart Grid Technologies Latin America (ISGT LATAM), 05-07 October 2015, Montevideo, Uruguay. 366–370. doi:10.1109/ISGT-LA.2015.7381183
Chen, X., Wu, W., Zhang, B., and Lin, C. (2017). data-driven dg capacity assessment method for active distribution networks. IEEE Trans. Power Syst. 32, 3946–3957. doi:10.1109/TPWRS.2016.2633299
Ding, X. H., Lou, Y. F., Liu, W., and Shi, L. Z. (2000). A new practical method for calculating line loss of distribution network: improved iteration method. Power Syst. Technol. 01, 39–42. doi:10.13335/j.1000-3673.pst.2000.01.012
Dong, Y. C., Wang, S. X., and Yan, B. K. (2019). Review on evaluation methods and improvement techniques of DG hosting capacity in distribution Network. Power Syst. Technol. 43, 2258–2266. doi:10.13335/j.1000-3673.pst.2019.0428
Du, N. C., Tang, F., Liao, Q. F., Gao, X., Li, Y., and Wei, X. Q. (2021). Static voltage stability based on holomorphic embedding method. Smart Powe 49, 8–15.
Gao, H., Chen, J., Diao, R., and Zhang, J. (2021). A HEM-based sensitivity analysis method for fast voltage stability assessment in distribution power network. IEEE Access 9, 13344–13353. doi:10.1109/ACCESS.2021.3051843
Jin, F., Liu, J. L., Liu, X. L., Wen, G. Q., Dong, Y. C., Wang, S. X., et al. (2022). Uncertainty analysis of DG hosting capacity in distribution network based on voltage sensitivity. Electr. Power Autom. Equip. 42, 183–189. doi:10.16081/j.epae.202204076
Keane, A., Ochoa, L. F., Borges, C. L. T., Ault, G. W., Alarcon-Rodriguez, A. D., Currie, R. A. F., et al. (2013). state-of-the-art techniques and challenges ahead for distributed generation planning and optimization. IEEE Trans. Power Syst. 28, 1493–1502. doi:10.1109/TPWRS.2012.2214406
Kulmala, A., Repo, S., and Pylvänäinen, P. (2017). Generation curtailment as a means to increase the wind power hosting capacity of a real regional distribution network. 24th Int. Conf. Electr. Distribution 2017, 1782–1786. doi:10.1049/oap-cired.2017.0925
Lai, Q. P., Liu, C. X., and Sun, K. (2022). Formulation and visualization of bus voltage-var safety regions for a power system. IEEE Trans. Power Syst. 37, 3153–3156. doi:10.1109/TPWRS.2022.3156444
Lai, Q. P., Liu, C. X., and Sun, K. (2021). Vulnerability assessment for voltage stability based on solvability regions of decoupled power flow equations. Appl. Energy 304, 117738–122619. doi:10.1016/j.apenergy.2021.117738
Li, S. H., Cao, Y. J., and Liu, G. Y. (2014). Optimal allocation method of dynamic var compensator based on the impedance modulus margin index. Proc. CSEE 34, 3791–3798. doi:10.13334/j.0258-8013.pcsee.2014.22.026
Liu, C. X., Lai, Q. P., Yao, L. Z., Xu, J., and Sun, Y. Z. (2022). Power system decoupling model based on holomorphic embedding method:weak bus identification. Proc. CSEE 42, 1736–1748. doi:10.13334/j.0258-8013.pcsee.202241
Liu, D. C., Wang, C. X., Tang, F., and Zhou, Y. (2020). Probabilistic assessment of hybrid wind-PV hosting capacity in distribution systems. Sustainability 12, 2183–2202. doi:10.3390/su12062183
Mahmud, M. A., Hossain, M. J., and Pota, H. R. (2014). Voltage variation on distribution networks with distributed generation: worst case scenario. IEEE Syst. J. 8, 1096–1103. doi:10.1109/JSYST.2013.2265176
Navarro, B. B., and Navarro, M. M., 2017. A comprehensive solar PV hosting capacity in MV and LV radial distribution networks. Proceedings of the 2017 IEEE PES Innovative Smart Grid Technologies Conference Europe (ISGT-Europe), 26-29 September 2017, Turin, Italy. 1–6. doi:10.1109/ISGTEurope.2017.8260210
Qureshi, M. U., Kumar, A., GrijalvaDeboever, S., J., Deboever, J., Peppanen, M., and Rylander, M., 2021 Fast hosting capacity analysis for thermal loading constraint using sensitivity-based decomposition method. Proceedings of the 2020 52nd North American Power Symposium (NAPS), June 3 2021, China. 1–5. doi:10.1109/NAPS50074.2021.9449771
Qureshi, M. U., Kumar, A., Grijalva, S., Deboever, J., Peppanen, J., and Rylander, M., 2020. Fast hosting capacity analysis considering over-voltage criteria and impact of regulating devices. Proceedings of the 2020 IEEE/PES Transmission and Distribution Conference and Exposition (T&D), 12-15 October 2020, Chicago, IL, USA. 1–5. doi:10.1109/TD39804.2020.9300035
Rabiee, A., and Mohseni-Bonab, M. (2017). Maximizing hosting capacity of renewable energy sources in distribution networks: A multi-objective and scenario-based approach. Energy 120, 417–430. doi:10.1016/j.energy.2016.11.095
Ramalinga Raju, M. R., Ramachandra Murthy, K. V. S. R., and Ravindra, K. (2012). Direct search algorithm for capacitive compensation in radial distribution systems. Int. J. Electr. Power & Energy Syst. 42, 24–30. doi:10.1016/j.ijepes.2012.03.006
Shayani, R., and de Oliveira, M. (2011). Photovoltaic generation penetration limits in radial distribution systems. IEEE Trans. Power Syst. 26, 1625–1631. doi:10.1109/TPWRS.2010.2077656
Singh, P., and Tiwari, R. (2020). Extended holomorphic embedded load-flow method and voltage stability assessment of power systems. Electr. Power Syst. Res. 185, 106381–107796. doi:10.1016/j.epsr.2020.106381
Sun, Q., Wang, X., Luo, F. Z., Yin, Q., Ni, Y. T., and Li, J. (2015). Capacity of distribution network on acceptance of distributed photovoltaic system based on cuckoos search algorithm. Proc. CSU-EPSA. 27, 1–6.
Tang, N. C., and Chang, G. W., 2018. A stochastic approach for determining PV hosting capacity of a distribution feeder considering voltage quality constraints. Proceedings of the 2018 18th International Conference on Harmonics and Quality of Power (ICHQP), 13-16 May 2018, Ljubljana, Slovenia. 1–5. doi:10.1109/ICHQP.2018.8378864
Torquato, R., Salles, D., Oriente Pereira, C. O., Meira, P. C. M., and Freitas, W. (2018). A comprehensive assessment of pv hosting capacity on low-voltage distribution systems. IEEE Trans. Power Deliv. 33, 1002–1012. doi:10.1109/TPWRD.2018.2798707
Trias, A. (2014). Sigma algebraic approximants as a diagnostic tool in power networks. Savannah, DC: U.S. PatentSeverna Park.
Trias, A. (2012). The holomorphic embedding load flow method. IEEE Power Energy Soc. General Meet., 1–8. doi:10.1109/PESGM.2012.6344759
Varma, R. K., and Singh, V., 2020. Review of studies and operational experiences of pv hosting capacity improvement by smart inverters. Proceedings of the 2020 IEEE Electric Power and Energy Conference (EPEC), 09-10 November 2020, Edmonton, AB, Canada. 1–6. doi:10.1109/EPEC48502.2020.9320116
Wang, S., Chen, S., Ge, L., and Wu, L. (2016). Distributed generation hosting capacity evaluation for distribution systems considering the robust optimal operation of OLTC and SVC. IEEE Trans. Sustain. Energy 7, 1111–1123. doi:10.1109/TSTE.2016.2529627
Xing, H. J., Cheng, H. Z., Zeng, P. L., and Zhang, Y. (2016). IDG accommodation based on second-order cone programming. Electr. Power Autom. Equip. 36, 74–80. doi:10.16081/j.issn.1006-6047.2016.06.011
Yang, F. (2015). Solving for the low-voltage/large-angle power-flow solutions by using the holomorphic embedding method. [Tucson]: Arizona State University. [dissertation].
Yuan, Z. Y., Lei, J. Y., Zhou, C. C., Bai, H., Shi, Y. S., and Tao, S. Y. (2020). Research on maximum allowable capacity of dispersed wind farm in distribution network considering network structure. South. Power Syst. Technol. 14, 73–79. doi:10.13648/j.cnki.issn1674-0629.2020.09.010
Zhao, B., Wei, L. K., Xu, Z. C., Zhou, J. H., and Ge, X. H. (2015). Photovoltaic accommodation capacity determination of actual feeder based on stochastic scenarios analysis with storage system considered. Automation Electr. Power Syst. 39, 34–40.
Keywords: distributed generation, distribution network, holomorphic embedding method, hosting capacity, voltage constraint region, voltage violation risk
Citation: Xie J, Tang F, Qi J, Li X, Lin Z, Liu Z and Guo Y (2023) Hosting capacity of distributed generation based on holomorphic embedding method in distribution networks. Front. Energy Res. 10:1038892. doi: 10.3389/fenrg.2022.1038892
Received: 07 September 2022; Accepted: 20 September 2022;
Published: 09 January 2023.
Edited by:
Lipeng Zhu, Hunan University, ChinaReviewed by:
Yunyun Xie, Nanjing University of Science and Technology, ChinaCopyright © 2023 Xie, Tang, Qi, Li, Lin, Liu and Guo. This is an open-access article distributed under the terms of the Creative Commons Attribution License (CC BY). The use, distribution or reproduction in other forums is permitted, provided the original author(s) and the copyright owner(s) are credited and that the original publication in this journal is cited, in accordance with accepted academic practice. No use, distribution or reproduction is permitted which does not comply with these terms.
*Correspondence: Fei Tang, dGFuZ2ZlaUB3aHUuZWR1LmNu
Disclaimer: All claims expressed in this article are solely those of the authors and do not necessarily represent those of their affiliated organizations, or those of the publisher, the editors and the reviewers. Any product that may be evaluated in this article or claim that may be made by its manufacturer is not guaranteed or endorsed by the publisher.
Research integrity at Frontiers
Learn more about the work of our research integrity team to safeguard the quality of each article we publish.