 Yalu Sun1
 Yalong Li
- 1Economic and Technological Research Institute of State Grid Gansu Electric Power Company, Gansu, China
- 2School of Mechanical Electronic and Information Engineering, China University of Mining and Technology-Beijing, Beijing, China
In the coming renewable energy-dominated power systems, their uncertain nature calls for a controllable load to track the change of renewable energy. To achieve power balance during peak load, a compensation mechanism for the controllable load to reduce power consumption is constructed. First, a multi-round sequential auction method is used to determine the reduced and non-reduced loads. Second, based on the proportional distribution according to the reduction loss, a compensation method for the reduced load by the non-reduced load is proposed. Considering both the reduction of electricity consumption and the carbon emission rate indicator, a compensation method for the reduced load by new energy enterprises is proposed; then, the compensation method and process of the controllable load reduction are formed. Finally, simulations are performed on a practical test case, and the effectiveness of the proposed scheme is verified by the numerical results.
1 Introduction
With the rapid development of the economy, the demand for electricity has steadily increased, and the peak value of the daily load curve has been increasing. Meanwhile, with the large-scale new energy connected to the power grid, the peak shaving capacity of the system decreases. When the load is large and the output of new energy is small, the supply and demand balance of the power system is tense, resulting in an “absolute power vacancy.” At the same time, during the peak load period, if the intra-day predicted value of the new energy output is far less than the pre-day predicted value, the prediction error exceeds the heat reserve reserved by the system, which will further cause the “prediction error vacancy.” The combined effect of the two types of power shortage makes the power supply of a new energy power system more tense, and it is urgent to find regulation and economic measures to ensure the balance of the power supply and load demand (McPherson and stoll, 2020; Haley,et al., 2020). In the electricity market environment, some loads can be adjusted within a certain range of needs, which are called controllable loads (Dranka and Ferreira, 2019; Parrish et al., 2020). However, controllable load interruption or reduction of power consumption will cause economic losses. Therefore, it is very important to provide electricity price compensation to controllable loads and promote their enthusiasm and initiative to reduce power consumption (Dehghanpour and Afsharina, 2015).
In recent years, researchers have conducted a lot of research work in the field of controllable loads (Strbac, 2008). For adjustable loads such as electric vehicles and distributed energy storage with the bidirectional interaction ability, the proportion of access to a power grid is increasing (Bian et al., 2018). An energy interaction converter between electric vehicles is proposed to improve the service life (Wang et al., 2021). It is beneficial to improve the performance of electric vehicles with controllable loads. The load is included in the energy management system of the energy internet (Hua et al., 2019), and a bottom-up development of energy internet architecture is designed (Hua et al., 2022). Large-scale aggregation of demand-side adjustable load resources and timely and controllable participation in power system regulation and power market transactions have become important issues for the new generation of power systems. Based on price-based demand response items, such as real-time pricing (RTP) (Finck et al., 2020), time of use pricing (TOU) (Zhou et al., 2019), and critical peak pricing (CCP) (Li et al., 2018) demand response items, users’ electricity demand is corrected through time-varying market prices. Finck,et al. (2020) dynamically modified the day-ahead price, according to the random behavior of residents and the dynamic behavior of buildings and heating systems so that energy consumption can adapt to the error in the prediction of new energy power generation. The comparative analysis of the modeling results (Zhou,et al., 2019) shows that the optimal use time pricing can support the charging and discharging behavior of residents and reduce the cost of the entire power supply chain. Li et al. (2018) confirmed that residential customers show promising potential for load reduction corresponding to the increasing electricity price. The price-based demand response project guides demand-side resources to respond interactively to the fluctuation of electricity prices, which can alleviate the impact of higher electricity prices on load demand fluctuation (Sioshansi, 2010). RTP is more economical than providing users with a unified fixed price in the short term (Paul et al., 2019). The more sensitive the response of demand response resources to the electricity price, the more intense will be the competition in the electricity market and the more reliable will be the system (Joung and Kim, 2013; Thomas et al., 2015). Due to the randomness, volatility, intermittence, uncertainty, and anti-peak regulation characteristics of wind and solar output (Zhang, et al., 2017), its large-scale access has brought severe challenges to the stable and safe operation of the power system (Liu et al., 2018; Saint-Drenan et al., 2016; Tasnim, et al., 2017), and the contradiction of new energy consumption has become increasingly prominent due to the constraint of the peak regulation capacity of the power system (Zhao, et al., 2018). In order to meet the power supply demand and ensure the stable operation of the power grid and the reliability of the power supply system, it is necessary to accurately predict the power generation of new energy. Taking wind power as an example, the regional load characteristics are often opposite to the wind power characteristics, or they are called the anti-peak regulation characteristics of wind power, which increases the prediction difficulty of new energy power generation (Xie et al., 2014). A variety of intelligent prediction models and machine learning algorithms have been successfully applied to wind energy prediction, and good results have been achieved. Common intelligent prediction models include neural networks (Li et al., 2010), support vector machines (Hu et al., 2014; Liu, et al., 2013), and least squares support vector machines (Zhou et al., 2011). In the existing literature, research on the power market is more concentrated on the technical level, and research on the economic level of new energy in the power market is relatively rare.
In the aforementioned literature, the demand-side response subject is regarded as the price recipient, lacking the research and analysis of an active bidding strategy in the power market.
Motivated by the relevant research results of controllable loads, this study proposes a power-balancing compensation mechanism and method for controllable load reduction. The innovations of this study are as follows:
(1) Considering the absolute power vacancy and prediction error vacancy, the non-reduced load and new energy enterprises provide reasonable price compensation to the reduced load at the same time;
(2) According to the sequential auction method, the reduced and non-reduced loads are determined, and the corresponding compensation method is proposed based on the principle of proportional distribution of the reduction loss;
(3) According to the weighted index of the reduced electricity and carbon emission rate, the compensation method provided by new energy enterprises for the reduced load is proposed.
2 Compensation mechanism of controllable loads in the power supply shortage period
2.1 Power supply and demand balance analysis
As shown in Figure 1, absolute power vacancy
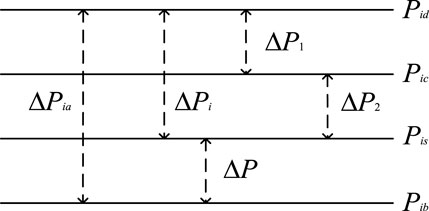
FIGURE 1. Power supply and demand.
When the intra-day predicted value of the total power generation
Total power vacancy
2.2 Market subsidy mechanism design
According to the analysis of the supply and demand balance during the peak load period, the main market players involved in ancillary services are power grid companies, controllable load enterprises, and new energy enterprises. According to the market behavior, the controllable load can be divided into two categories: the controllable load that competes with the power right is called the non-reduced load; the controllable load that is not competitive with the power consumption right needs to limit the power consumption, which is called the reduced load.
It is necessary to subsidize the contribution of the reduced load to power balance. Based on the principle of who benefits and who compensates, two subsidies are designed as follows.
First, the reduced load is compensated by the non-reduced load through the power grid company. The non-reduced load obtains the power right in a way higher than the market clearing price in the competition, and the power grid company receives the profit higher than the market clearing price. As an intermediate link, the power grid subsidizes the reduced load with surplus earnings. Second, the new energy enterprise compensates for the reduced load, according to the prediction error vacancy
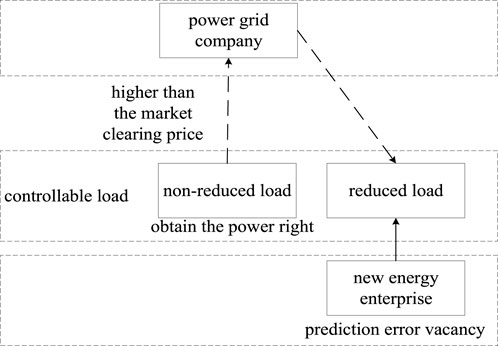
FIGURE 2. Schematic diagram of the consumption mechanism.
3 The compensation method for the reduced load by the non-reduced load
In this section, the controlled loads are first auctioned by a sequential auction to determine the reduced and non-reduced loads, as well as the excess electricity fee paid by the non-reduced loads to the power grid company. Second, the power grid company will compensate for the reduced loads, according to the principle of reduction loss distribution.
3.1 Sequential auction method
Step 1. The basic information of the auction suppliers and demanders is determined. During the peak power consumption statistical period T, the power grid company will auction the bidding electricity (
Step 2. The kth round of declaration. According to its own needs, each controllable load will declare the adjustable power in three stages:
Step 3. The kth round of auction. As shown in Figure 3, the transaction priority is obtained by arranging the final prices in descending order. Transactions are completed in order until the declared electricity of the power grid or the electricity of the controllable load is exhausted, and the lowest transaction price
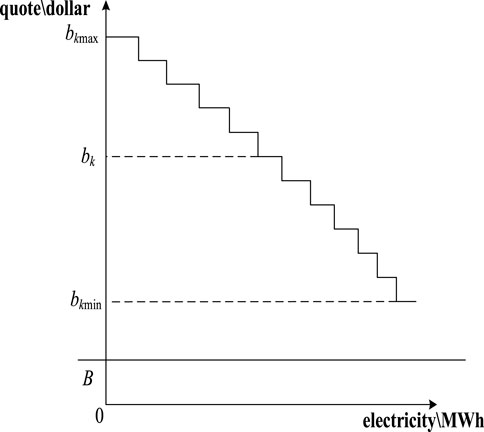
FIGURE 3. Schematic diagram of the bidding process.
Step 4. Multi-round auction. If k<3, let k = k+1, and return to step 2 for the next round of auction. The maximum demand of the controllable load entering the next round of auction is
where
Step 5. At the end of the auction, the controllable loads and their transaction price and electricity quantity that have been successfully auctioned in three rounds will be announced. The controllable loads that have not been successfully auctioned shall be reduced for the power consumption.
Step 6. The excess electricity fees (R) paid to the grid company by the non-reduced load are calculated as
where
(1) The re-quotation submitted for the same controllable load in each round must be greater than or equal to the first quotation.
(2) The quotation of the same controllable load in the next round must be greater than or equal to the quotation of the previous round.
(3) The controllable load of the previous round is forbidden to participate in the next round.
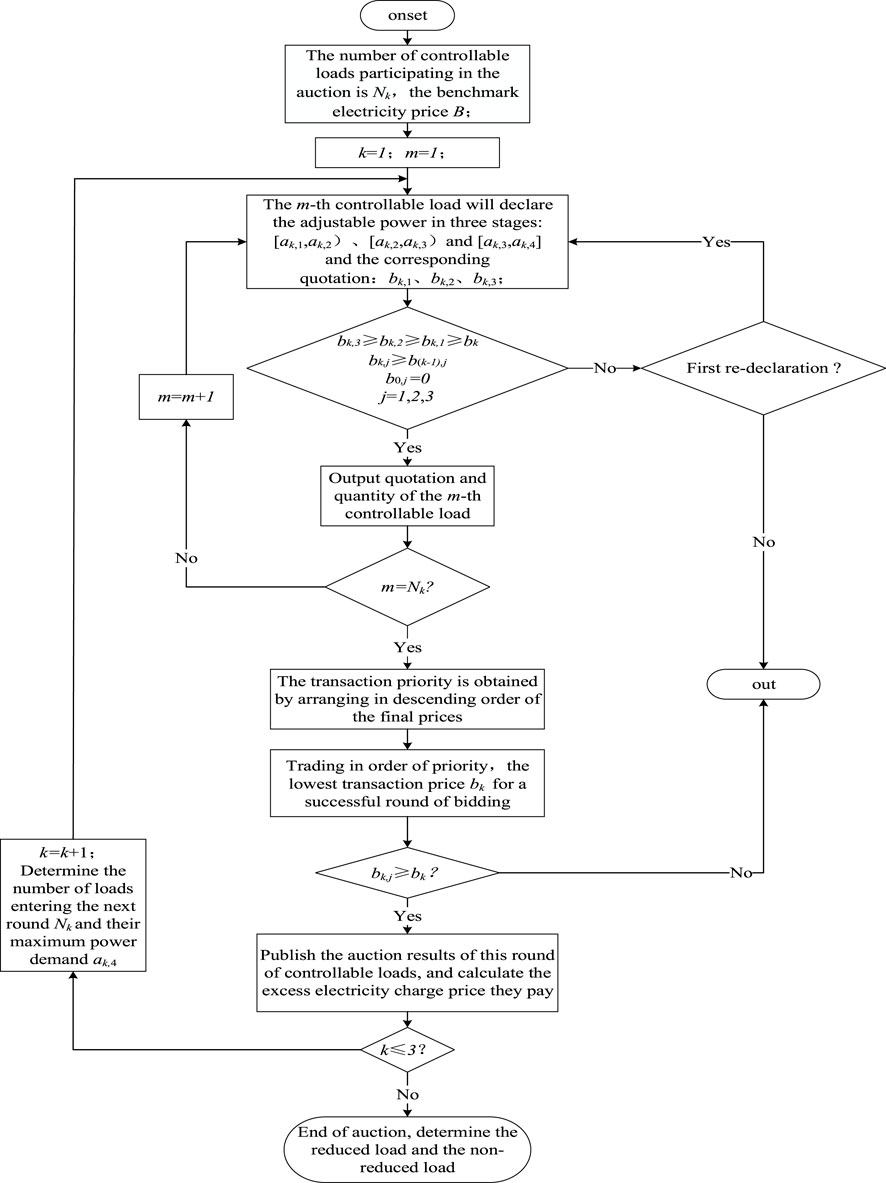
FIGURE 4. Flow chart of the sequential auction.
3.2 Compensation method according to the reduction loss
When the controllable loads are reduced, the following loss will generally be caused:
where
According to the proportional distribution of the reduction loss, the compensation
4 Compensation method for new energy enterprises for the reduced load
4.1 Total compensation provided by new energy enterprises for the reduced load
When the intra-day predicted value of the new energy output is less than the pre-day predicted value, there will be a risk of power supply imbalance during the peak period of power consumption. This section adopts the punishment of the loss of load caused by prediction errors as a high penalty for new energy enterprises. When the controllable load is reduced, the loss of load will decrease, and the corresponding punishment
where
The new energy enterprise compensates for the reduced load. The overall compensation cost
with the compensation coefficient
4.2 Individual compensation method for the reduced load
Suppose the carbon emission rate of the i-th reduced load is
with weight
According to the proportional distribution of the comprehensive index, the compensation
5 Power-balancing compensation method of controllable load reduction
Combining the aforementioned two types of compensation, a power-balancing compensation method for controllable load reduction is formed. The whole process is as follows:
(1) Data prediction. The prediction value of the total load power
(2) Vacancy prediction. The absolute power vacancy
(3) Sequential auction. According to the method described in Section 3.1, the reduced and non-reduced loads are determined, and the excess fee paid for the non-reduced load is obtained.
(4) Based on the method in Section 3.2, the non-reduced load is compensated by the reduced load through the power grid company.
(5) If
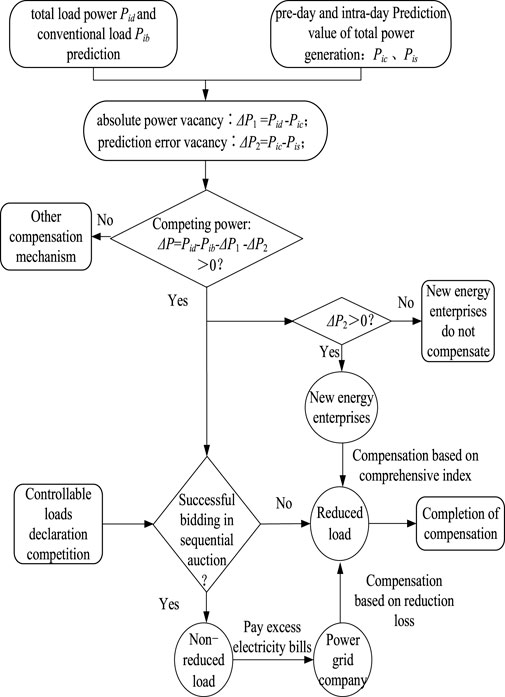
FIGURE 5. Flow chart of the power-balancing compensation method.
6 Example analysis
6.1 Example setting
In a regional power grid, the total installed capacity of the wind turbine is 3,500 MW, the maximum capacity of the conventional load is 10,000 MW, the total capacity of the power supply is 13,000 MW, and the controllable load is 560 MW. Taking 4 h as the intra-day prediction and control step of the controllable load, the maximum load demand at the peak of power consumption from 20:00 to 22:00 predicted at 16:00 in the day is 10,400 MW, and the total output of the power supply is 10,120 MW. Moreover, the predicted intra-day wind power is 2,400 MW, which is less than the pre-day prediction 2,500 MW.
The industrial electricity benchmark price during the peak period of electricity consumption is 127 dollars/MWh. The punishment factor for the loss of load
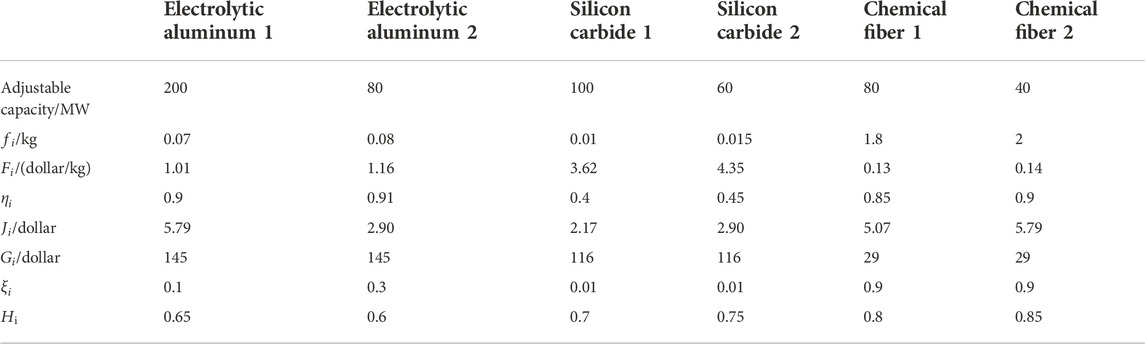
TABLE 1. Regulation information of controllable loads.
6.2 Process calculation
Step1. Calculation of the deficiency. The absolute power shortage vacancy

TABLE 2. First round declaration results of controllable load enterprises.
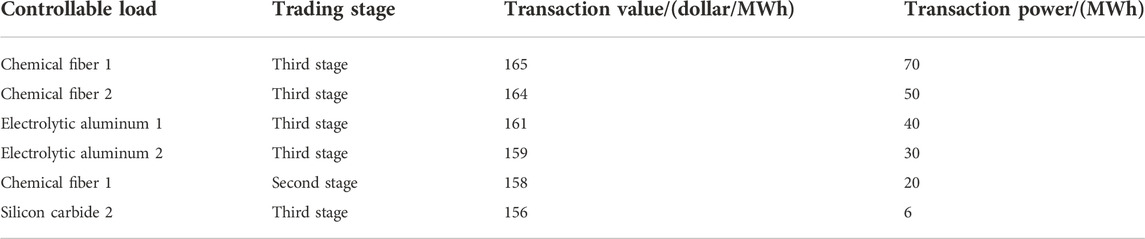
TABLE 3. First round bidding results of controllable load enterprises.
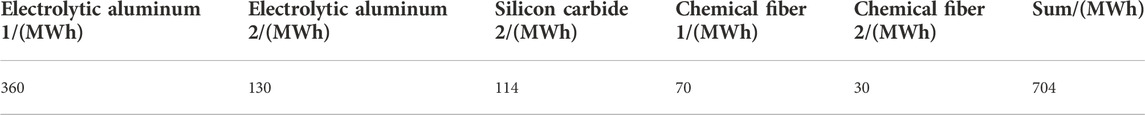
TABLE 4. Second round sequential auction adjustable electricity of controllable load enterprises.
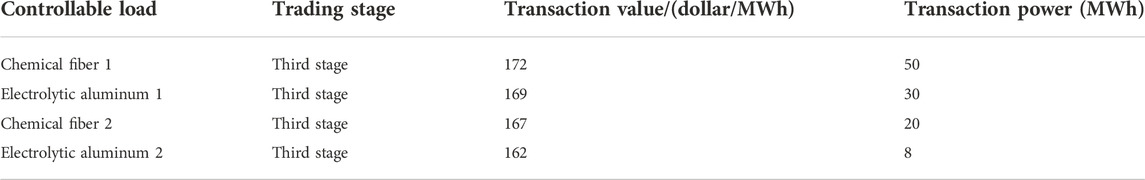
TABLE 5. Second round bidding results of controllable load enterprises.
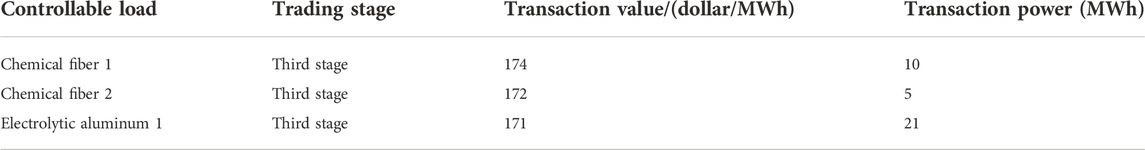
TABLE 6. Third round bidding results of controllable load enterprises.
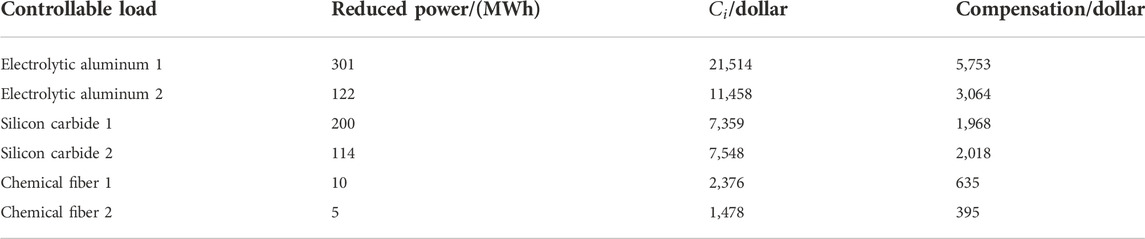
TABLE 7. Loss and compensation of the reduced loads.
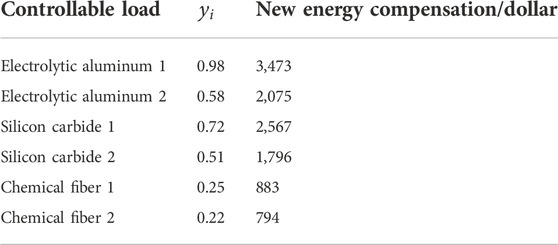
TABLE 8. Comprehensive index of the reduced loads and their new energy compensation.
6.3 Result analysis
According to the known conditions of the calculation example, the vacancy of 2 h is 380*2 = 760 (MWh). From Tables 3, 5, 6, the powers traded in the three stages are 216 MWh, 108 MWh, and 36 MWh, respectively. The reduction power is 560*2–216–108–36 = 760 (MWh), which is equal to the vacancy. It means that the power supply balance is realized through controllable load reduction.
The lowest transaction price in the first round is 156 dollars/MWh, while the quotation of silicon carbide 1 in the third round is only 152 dollars/MWh. Therefore, it is out in the first round and cannot participate in the subsequent declaration. Through this principle, competition can be formed to avoid monopolizing the power use right.
Moreover, it can be seen from Tables 7, 8 that during the peak period of power consumption, the total compensation paid for by the non-reduced load and the new energy enterprises to the reduced load is 13,833 and 11,588 dollars, respectively, and the two types of compensation are similar. The parameter
7 Conclusion
With respect to the shortage of power supply in the peak period of a new energy power system, this study has proposed a mechanism and method of controllable load reduction to ensure power supply balance. Specifically,
(1) On one hand, the sequential auction method has been used to determine reduced and non-reduced loads. On the other hand, double compensation has been carried out according to the reduction loss, the reduced electricity quantity, and the weighted index of the carbon emission rate.
(2) The example analysis shows that the sequential auction can effectively guarantee the power supply balance. In the traditional power system, the prediction error is small, and the compensation for the reduced load is mainly paid for by the non-reduced load through the power grid company. However, in the new energy power system, the compensation paid for by the new energy enterprises is an important factor to improve the enthusiasm of the reduced load. When the total power vacancy is greater than the adjustable capacity of the controllable loads, other compensation mechanisms need to be further developed to achieve more interruptible loads to ensure power supply balance.
Data availability statement
The original contributions presented in the study are included in the article/Supplementary Material; further inquiries can be directed to the corresponding author.
Author contributions
Conceptualization, YS and YL; methodology, KD and WD; validation, YS and YL; resources, CY; data curation, CY and WD; writing—original draft preparation, WD and YL; and writing—review and editing, YS, YL, and KD. All authors have read and agreed to the published version of the manuscript.
Conflict of interest
Authors YS, KD, and CY were employed by the company the Economic and Technological Research Institute of the State Grid Gansu Electric Power Company.
The remaining authors declare that the research was conducted in the absence of any commercial or financial relationships that could be construed as a potential conflict of interest.
Publisher’s note
All claims expressed in this article are solely those of the authors and do not necessarily represent those of their affiliated organizations, or those of the publisher, the editors, and the reviewers. Any product that may be evaluated in this article, or claim that may be made by its manufacturer, is not guaranteed or endorsed by the publisher.
References
Bian, Y. K., Heather, W. P., Li, F. R., Rohit, B., Sukumar, M., and Prasad, P. A. (2018). Demand side contributions for system inertia in the GB power system. IEEE Trans. Power Syst. 33, 3521–3530. doi:10.1109/tpwrs.2017.2773531
Dehghanpour, K., and Afsharnia, S. (2015). Electrical demand side contribution to frequency control in power systems: A review on technical aspects. Renew. Sustain. Energy Rev. 41, 1267–1276. doi:10.1016/j.rser.2014.09.015
Dranka, G. G., and Ferreira, P. (2019). Review and assessment of the different categories of demand response potentials. Energy 179, 280–294. doi:10.1016/j.energy.2019.05.009
Finck, C., Li, R. L., and Zeiler, W. (2020). Optimal control of demand flexibility under real-time pricing for heating systems in buildings: A real-life demonstration. Appl. Energy 263, 114671. doi:10.1016/j.apenergy.2020.114671
Haley, B., Gaede, J., Winfield, M., and Love, P. (2020). From utility demand side management to low-carbon transitions: Opportunities and challenges for energy efficiency governance in a new era. Energy Res. Soc. Sci. 59, 101312. doi:10.1016/j.erss.2019.101312
Hu, J. M., Wang, J. Z., and Ma, K. L. (2014). A hybrid technique for short-term wind speed prediction. Energy 81, 563–574. doi:10.1016/j.energy.2014.12.074
Hua, H. C., Qin, Y. C., Hao, C. T., and Cao, J. W. (2019). Stochastic optimal control for energy internet: A bottom-up energy management approach. IEEE Trans. Ind. Inf. 15, 1788–1797. doi:10.1109/TII.2018.2867373
Hua, H. C., Qin, Z. M., Qin, Y. C., Dong, N. Q., Ye, M. J., Wang, Z. D., et al. (2022). Data-driven dynamical control for bottom-up energy Internet system. IEEE Trans. Sustain. Energy 13, 315–327. doi:10.1109/TSTE.2021.3110294
Joung, M., and Kim, J. (2013). Assessing demand response and smart metering impacts on long-term electricity market prices and system reliability. Appl. Energy 101, 441–448. doi:10.1016/j.apenergy.2012.05.009
Li, G., Shi, J., and Zhou, J. Y. (2010). Bayesian adaptive combination of short-term wind speed forecasts from neural network models. Renew. Energy 36, 352–359. doi:10.1016/j.renene.2010.06.049
Li, Y. X., Gao, W., Ruan, Y., and Ushifusa, Y. (2018). Demand response of customers in Kitakyushu smart community project to critical peak pricing of electricity. Energy Build. 168, 251–260. doi:10.1016/j.enbuild.2018.03.029
Liu, D., Niu, D. X., Wang, H., and Fan, L. L. (2013). Short-term wind speed forecasting using wavelet transform and support vector machines optimized by genetic algorithm. Renew. Energy 62, 592–597. doi:10.1016/j.renene.2013.08.011
Liu, L. Y., Zhao, Y., Chang, D. L., Xie, J. Y., Ma, Z. Y., Sun, Q., et al. (2018). Prediction of short-term PV power output and uncertainty analysis. Appl. Energy 228, 700–711. doi:10.1016/j.apenergy.2018.06.112
McPherson, M., and Stoll, B. (2020). Demand response for variable renewable energy integration: A proposed approach and its impacts. Energy 197, 117205. doi:10.1016/j.energy.2020.117205
Parrish, B., Heptonstall, P., Gross, R., and Sovacool, B. K. (2020). A systematic review of motivations, enablers and barriers for consumer engagement with residential demand response. Energy Policy 138, 111221. doi:10.1016/j.enpol.2019.111221
Paul, D., Ruth, F. G., Ramsés, H. M., and Jay, Z. (2019). Impacts of day-ahead versus real-time market prices on wholesale electricity demand in Texas. Energy Econ. 81, 259–272. doi:10.1016/j.eneco.2019.04.008
Saint-Drenan, Y. M., Good, G. H., Braun, M., and Freisinger, T. (2016). Analysis of the uncertainty in the estimates of regional PV power generation evaluated with the upscaling method. Sol. Energy 135, 536–550. doi:10.1016/j.solener.2016.05.052
Sioshansi, R. (2010). Evaluating the impacts of real-time pricing on the cost and value of wind generation. IEEE Trans. Power Syst. 25, 741–748. doi:10.1109/TPWRS.2009.2032552
Strbac, G. (2008). Demand side management: Benefits and challenges. Energy Policy 36, 4419–4426. doi:10.1016/j.enpol.2008.09.030
Tasnim, S., Rahman, A., Oo, A. M. T., and Haque, M. E. (2017). Wind power prediction in new stations based on knowledge of existing stations: A cluster based multi source domain adaptation approach. Knowledge-Based Syst. 145, 15–24. doi:10.1016/j.knosys.2017.12.036
Thomas, S., Filip, A., Johannes, K., Carlo, C., Concettina, B., Pierluigi, S., et al. (2015). A review of architectures and concepts for intelligence in future electric energy systems. IEEE Trans. Ind. Electron. 62, 2424–2438. doi:10.1109/TIE.2014.2361486
Wang, R., Sun, Q., Sun, C. H., Zhang, Y. G., Gui, Y. H., and Wang, P. (2021). Vehicle-vehicle energy interaction converter of electric vehicles: A disturbance observer based sliding mode control algorithm. IEEE Trans. Veh. Technol. 70, 9910–9921. doi:10.1109/TVT.2021.3105433
Xie, L., Gu, Y. Z., Zhu, X. X., and Genton, M. (2014). Short-term spatio-temporal wind power forecast in robust look-ahead power system dispatch. IEEE Trans. Smart Grid 5, 511–520. doi:10.1109/TSG.2013.2282300
Zhang, C., Zhou, J. Z., Li, C. S., Fu, W. L., and Peng, T. (2017). A compound structure of ELM based on feature selection and parameter optimization using hybrid backtracking search algorithm for wind speed forecasting. Energy Convers. Manag. 143, 360–376. doi:10.1016/j.enconman.2017.04.007
Zhao, Y. N., Ye, L., Wang, W. S., Sun, H. D., Ju, Y. T., and Tang, Y. (2018). Data-Driven correction approach to refine power curve of wind farm under wind curtailment. IEEE Trans. Sustain. Energy 9, 95–105. doi:10.1109/tste.2017.2717021
Zhou, J. Y., Shi, J., and Li, G. (2011). Fine tuning support vector machines for short-term wind speed forecasting. Energy Convers. Manag. 52, 1990–1998. doi:10.1016/j.enconman.2010.11.007
Keywords: power vacancy, controllable load, power supply balance, sequential auction, compensation method
Citation: Sun Y, Ding K, Du W, Yang C and Li Y (2023) Power-balancing compensation mechanism and method for controllable load reduction. Front. Energy Res. 10:1037624. doi: 10.3389/fenrg.2022.1037624
Received: 06 September 2022; Accepted: 28 September 2022;
Published: 11 January 2023.
Edited by:
Haochen Hua, Hohai University, ChinaReviewed by:
Lei Gan, Hohai University, ChinaJiaming Wang, China Electric Power Planning and Engineering Institute, China
Yunhao Zhao, North China Electric Power University, China
Copyright © 2023 Sun, Ding, Du, Yang and Li. This is an open-access article distributed under the terms of the Creative Commons Attribution License (CC BY). The use, distribution or reproduction in other forums is permitted, provided the original author(s) and the copyright owner(s) are credited and that the original publication in this journal is cited, in accordance with accepted academic practice. No use, distribution or reproduction is permitted which does not comply with these terms.
*Correspondence: Yalong Li, bHlsd3l5eEAxNjMuY29t