 Yuxi Liu
 Jie Zhu1
 Yingying Zheng
95% of researchers rate our articles as excellent or good
Learn more about the work of our research integrity team to safeguard the quality of each article we publish.
Find out more
ORIGINAL RESEARCH article
Front. Energy Res. , 20 January 2023
Sec. Smart Grids
Volume 10 - 2022 | https://doi.org/10.3389/fenrg.2022.1037253
This article is part of the Research Topic Optimal Energy Management for Electric Vehicles (EVs) by the interface of Vehicle to Grid (V2G), Grid to Vehicle (G2V) and Smart Grid Scheduling View all 7 articles
High penetration of electric vehicles (EVs) in an uncontrolled manner could have disruptive impacts on the power grid, however, such impacts could be mitigated through an EV demand response program. The successful implementation of an efficient, effective, and aggregated demand response from EV charging depends on the incentive pricing mechanism and the load shifting protocols. In this study, a genetic algorithm-based multi-objective optimization model is developed to generate hourly dynamic Time-of-Use electricity tariffs and facilitate the decision making in load scheduling. As an illustrative example, a case study was carried out to examine the effect of applying demand response for EVs in Beijing, China. With the assumptions made, the maximum peak load can be reduced by 9.8% and the maximum customer savings for the EVs owners can reach 11.85%, compared to the business-as-usual case.
Market demand and sales of electric vehicles (EVs) are soaring. There were 11 million registered EVs on the road worldwide by the end of 2021 (Abdelbaky et al., 2021). According to the projection, the share of EVs in the European and North American markets will be around 50% and 30% by 2030, respectively (Rezaeimozafar et al., 2021). Large-scale electric vehicle charging loads can dramatically change load demand in a short period of time, which can lead to grid instability and peak demand rise. Reinforcing the network and expanding capacity could be a possible solution to this problem, but would require huge capital investments. So using intelligent charging scheduling strategies is a more economical and feasible approach. A natural way to reduce peak loads is by controlling the charging power, but this would result in the EVs taking longer to charge (Chen et al., 2014; Zhang et al., 2018). Authors in (Gjelaj et al., 2017; McKinsey, 2018) employed a stationary battery for shifting the load from peak periods to off-peak periods, which would result in more costs when building charging stations. Incentivizing customers to participate in demand response to avoid charging during peak hours by setting dynamic electricity prices is a more promising approach for application.
The time-varying-based demand response (DR) programs refer to prices that vary over the day to indirectly induce consumers to adjust their energy use patterns following dynamic electricity prices. For a given protocol, the charging stations perform DR actions to reduce energy usage during periods of peak demand, high electricity rates, system constraints, and/or emergencies. The EV owners can assess the trade-off between savings in the charging costs by advancing or postponing the charging action, against the inconvenience of adjusting their desired time slot (Zheng et al., 2019). The successful implementation DR approach on EV owners relies on two initiatives: the incentive dynamic pricing (DP) mechanism and the load shifting scheme (Zheng et al., 2021; Genis et al., 2022) as shown in Figure 1.
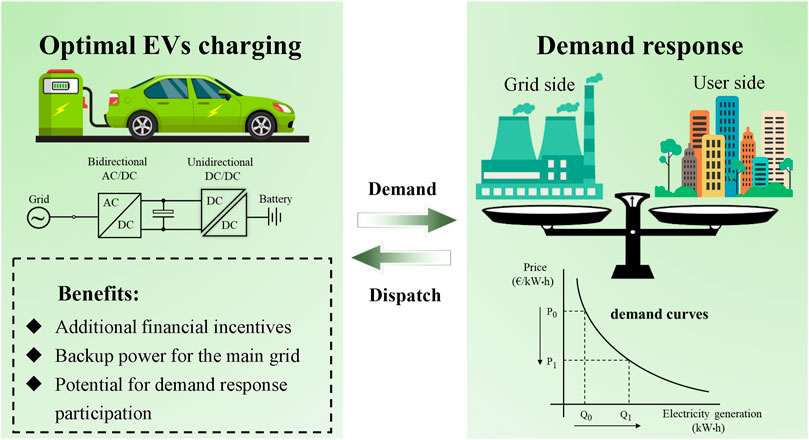
FIGURE 1. Optimal EV charging with demand response and dynamic pricing schemes.
The DP concept in the retail electricity market refers to price the electricity dynamically based on the current and forecasted mismatch between generation and demand. The authors in (Moghaddam et al., 2019) present a dynamic pricing model to reduce the overlaps loads between residential and public charging stations by shifting loads away from the evening peak load hours. Authors in (Yu et al., 2022) formulate a dynamically updated price, which includes a discharge incentive reward and charging expense, based on the peak-to-valley time of use (TOU) tariff. The DP mechanism has shown great performance in reducing the peak-valley difference of load and improving the benefits for the energy consumers (Wang et al., 2019). Reference (Kong et al., 2022) proposed an optimization model to manage the load in the distribution system by setting a DP to incentivize electric vehicles to charge at different locations and times. Reference (Sharma and Jain, 2019) considered DP has a low acceptance rate by EVs for being too dynamic to respond and proposed a demand response model that integrates TOU and DP by clustering dynamic tariffs. From the perspective of cost saving for car owners, reference (Zhou et al., 2020) proposed a strategy model of electric vehicle charging and discharging under DP, which considers the parking cost and the inconvenience caused by the change of charging end time of car owners.
With a proper pricing scheme, the load shifting scheme is usually formulated as a single or multi-objective optimization problem (MOOP) to optimize the charging schedules or battery State-of-Charge (SoC), where cost reduction, carbon emissions reduction, battery lifetime, peak shaving, or renewable energy consumption are included in the objective functions (Gou et al., 2021; Yang et al., 2021). To solve a MOOP, broadly used approaches include genetic algorithm (GA), particle swarm optimization, and neural network technique (Wang and Singh 2007; Kataoka et al., 2019; Limmer and Rodedmann 2019; Wenqiang et al., 2021).
Although dynamic pricing has been successfully implemented in various industries like the gasoline market, airline companies, and online retail, real-time pricing has not been widely employed in the retail electricity sector. Most of the price schemes are Time-of-Use (TOU) tariff-based, which means the utility company charges more during a certain time of day. The authors in (Abbasi et al., 2020) consider the aggregator as a price-maker in the day-ahead market by offering energy price bids. A bidding strategy model for the EV aggregator who acts as a price-maker both in the day-ahead and real-time electricity market is established in (Gong et al., 2021). Reference (Zhang et al., 2021) uses the Stackelberg game theory to model the negotiation process of charging price and determine the congestion cost that the EV side should be allocated. In most of the previous works, the energy prices are still set in advance, and they do not fluctuate on the timescale of hours or minutes according to demand.
Given the area of dynamic TOU price-based charge scheduling of EVs is nascent, we make the following contributions: 1) generate a dynamic pricing profile that can reflect the demand changes simultaneously and trigger the EV owners to modify the original charging activity; 2) develop a GA-based optimization model to find alternative charging windows that yields the lowest electricity costs and peak-to-valley ratio in power grid; and 3) evaluate the efficiency and effectiveness of the proposed DR program.
The rest of this paper is organized as follows. Section 2.1 describes the EV driving and charging behavior model. Section 2.2 introduces the dynamic incentive pricing scheme. The GA-based optimization formulation is presented in Sections 2.3 and 2.4. Section 3 defines the case study. In Section 4, the simulation results are presented, and Section 5 concludes.
To better model the EV driving and charging behaviors and patterns, the EVs are classified into four groups: electric bus, electric taxi (taxi/uber/lift), business vehicle, and private EV. Each EV is characterized by six parameters including the vehicle type, daily driving mileage, battery capacity, charging rate, initial charging time (the time arrive at the charging station), and the charging probability.
To generate hourly dynamic Time-of-Use electricity tariffs and load scheduling commends, a genetic algorithm-based multi-objective optimization model is described in this section.
The daily driving distance of each EV is generated randomly from the predefined probability density function (PDF), as shown in Eq. 1. The PDF is generated by data fitting a set of survey data of the National Household Travel Survey in 2018, which is sponsored by the US Department of Transportation (Stats, 2017). Given the daily mileage, the initial SOC0 and the charging duration TC can be calculated, as shown in Eqs 2,3:
Where S is the daily mileages (km);
Based on the survey data, the EV charging behaviors are categorized by the type of EV, charging window, start time, battery capacity, charging rate, and charging probability. The electric buses operate on fixed routes on a typical workday. We assume the electric buses would have two charging windows: fast charging during the daytime and slow charging at night. There are four possible charging windows for the electric taxi, representing the daily shifts (morning, afternoon, evening, and late night). The charging activities of the business or commercial vehicles would happen during working hours and are highly random. For the private EV owners, they are more likely to charge their cars late at night and early in the morning.
The key parameters and charging characteristics of the EVs in this case study are provided in Table 1. The originally intended arrival time or the earliest time (i.e., before DR) potentially available for charging each day is generated randomly from either a normal distribution (N) with an associated mean and standard deviation or a uniform distribution (U) with a given range, using the data from Table 1. The charging probability indicts the probability that that EV presents at the charging station within that time window and has the charger plugged in (Liu and Qi, 2014). For example, for this case study (described in Section 3), the electric bus would have a 100% chance to charge between 9:00 a.m. and 4:00 p.m. at a rate of 90 kW.

TABLE 1. The statistical data of EV charging events (Liu and Qi, 2014).
In this study, a three-tier dynamic pricing system for EV charging is created based on the amount of electricity used; the more electricity used, the higher the charge. The first (off-peak) and second (mid-peak) tiers cover nearly 70% of EV consumption, and the third tier (on-peak) is charged for about 30% of electricity use.
To set the real-time pricing, price elasticity of demand, which is a measurement of the change in energy demand in relation to the change in utility charges for the electricity, as shown in Figure 2. It states that with a fixed amount of generation, when the price falls, the demand rises, and vice versa. The formula for calculating the elasticity of demand is expressed by the elasticity coefficient (Gou et al., 2021):
Where
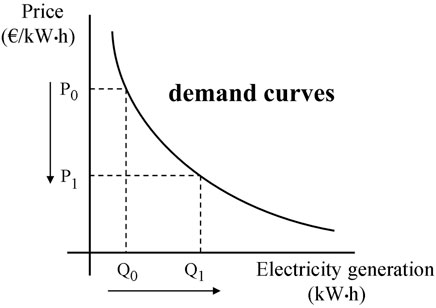
FIGURE 2. price elasticity of demand.
The EV owner’s decisions or choices on the time of charging are not only affected by the price of electricity at that moment but are also correlated with the prices at adjacent moments. Therefore, the correlation relationship between electricity demand and electricity price at different periods can be expressed as:
Where
The amount of load change for each time period is the amount of change in the current time period in response to the time share tariff plus the amount of movement from other time periods to this time period. Therefore, the amount of load change at the moment before and after the time-of-use tariff with n-dimensional data:
Where, when i = j,
A Multi-objective optimization problem is formulated to minimize the costs for EV owners and to minimize the peak-to-valley difference. Decision variables express the hourly price rate and the new start times for the schedulable EVs. To perform the load shifting, a constrained, non-linear, MOOP has been formulated as
Where
Where N is the number of EVs and n is the index of it;
The net increase of the load in a single period should be less or equal to the maximum charging capacity in the region.
To achieve the purpose of peak cutting and valley filling, the three-tiered dynamic pricing system makes sure the mid-peak rate (
To avoid the rebound effect, which means a new peak that is even higher than the original one may occur after the implementation of the DR program, the new peak must satisfy:
A concise description of the GA employed in this study is described here. The chromosome composition of the genetic algorithm comprises two segments: the first 96 genes representing the real-time price vector–one element for each 15-min interval in the 24-h period; the second segment contains genes representing the new charging start times for the schedulable EVs.
The initial population of 200 chromosomes is generated randomly, and each chromosome is evaluated and sorted based on the fitness function (objective value). The linear bias parameter is determined based on the size of the population. Crossover selects genes from parent chromosomes and generates a new offspring. Within the offspring chromosome, each gene has a mutation probability of 0.33. The new offspring in the new population are evaluated and ranked in terms of the objective function value again, and the worst two chromosomes are eliminated. The newly generated population is used for the successive iterations of the algorithm until the stopping criteria of 500 total iterations. Flowchart of the demand response strategy is shown in Figure 3. The newly generated population is used for the successive iterations of the algorithm until the stopping criteria of 500 total iterations.
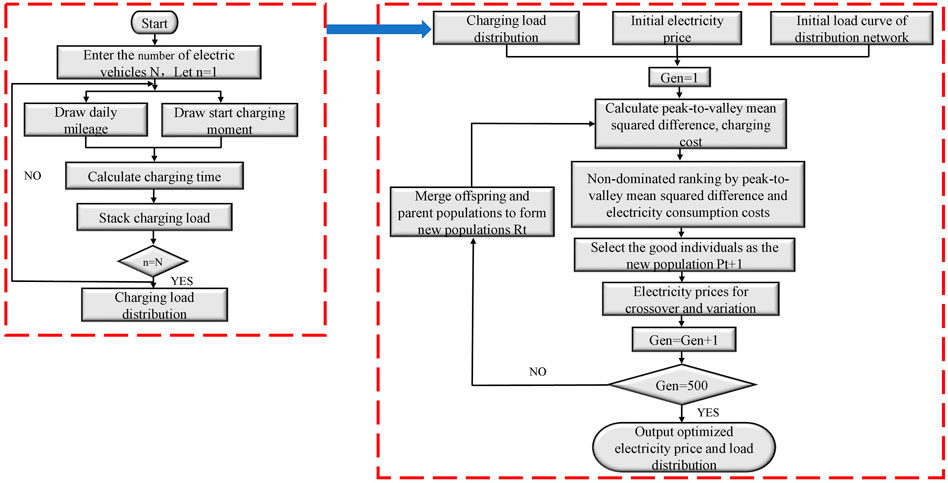
FIGURE 3. Flowchart of the demand response strategy.
The case study is based on the metropolitan area of Beijing, a region that has the fastest-growing EV markets in the world. The area of study covers about 16,000 km2 and included 10 million inhabitants and 400,000 EVs in 2021. The data used are obtained from the 2021 Beijing Transportation Development Annual Report (Gou et al., 2021). The original electricity rates in Beijing are assumed to be flat and cost 1 yuan/kWh. The demand profile for electricity is from a typical workday in 2020 and was obtained from the local utility company. For the purpose of computational efficiency, we examine a case with only 40,000 EVs, which constitute 10% of the current EV fleet.
To generation and EV driving and charging profiles and solve the optimization formulations above, a total of 40,000 Monte Carlo simulations were conducted to generate a finite number of possible cases based on the probability distributions of all stochastic parameters.
The simulation results of the EV driving and charging patterns are shown in Figure 4. There is a 50% chance that the Beijing EV owners drive less than 50 km per day. The daily average driving distance is also similar to the value provided by the AAA Foundation for Traffic Safety Survey, which states that on average, Americans drive 47 km per day. The duck curve in Figure 4B shows that the initial charging time of EVs peaks around 8 a.m. and 6 p.m., which indicates that the drivers are more likely to start the charging events once they arrive at work or get back home from work. Moreover, 98% of the charging events are performed before 10:00 p.m. on workdays.
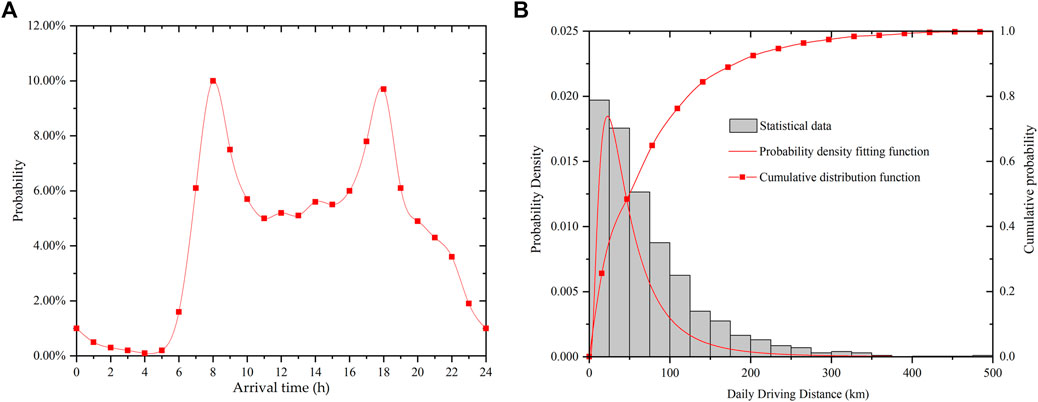
FIGURE 4. (A) The probability density of the daily driving distance of EVs in Beijing and the best Log-logistic distribution fit to this probability density; (B) The probabilities for the time of initial charging during a day.
With the assumptions made in this study, the charging power drawn from the grid is presented in Figure 5. Electric buses use fast chargers during the day and the load peak happens around 2:30 p.m. Most of the electric buses stop operating at late night, therefore, the charging demand starts to increase again after 9:00 p.m. The daily load peak of electric taxis is around 4 a.m. The load curve demonstrates four peaks, which are strongly correlated with the four working shifts of taxi drivers. During the daytime working hours, most of the business EVs are either in standby mode or on the road. Therefore, the charging frequency is low. They tend to charge initially at 5 p.m., which has a distinct single-peak load shape. The private EV drivers plugged in more frequently than the other drivers. The charging load keeps increasing during the daytime till late at night. This means that even though most private EVs get plugged in after 5 p.m., the owners do not leave the charger plugged in overnight.
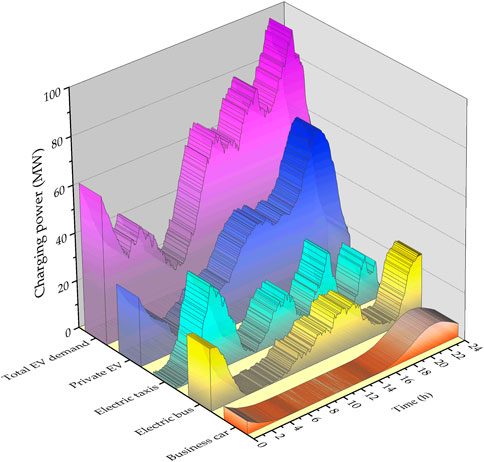
FIGURE 5. The total power consumption over a day by four types of EV on a typical weekday in Beijing.
Figure 5 also demonstrates that the power withdrawn by the private EVs attribute the most to energy consumption. From 6 to 9 p.m., a time when energy use typically ramps up fast as most people go off duty and have their EV plugged in. The charging demand is highest at 8 p.m. and the total load profile has separate morning and evening peaks.
Given the charging load and the original price rate, the price elasticity matrix can be calculated and is shown in Eq 15 (Ruoyu, 2018). The key to successfully implementing TOU tariffs is aligning rates with customer demand signals. As shown in Figure 6, the optimized TOU tariff, which is solved by the NSGA-II algorithm, follows the demand trend closely. This study assigns a weight factor of 50% to each of objectives for the selection of solutions. The first tier is set at 0.29 yuan ($0.04) per kWh, the second at 0.81 yuan ($0.12), and the third at 1.25 yuan ($0.19). The ratio of peak-to-valley rates is 4.31, which meets the constraint set in Section 2.3.
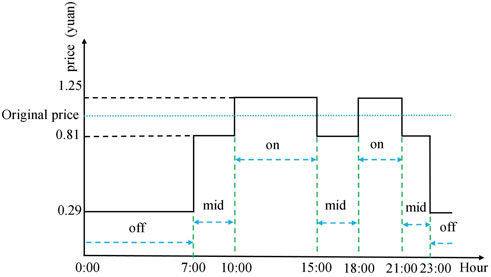
FIGURE 6. The optimized TOU tariff.
Figure 7 presents the change in the hourly EV charging loads before and after the DR approach. The real-time pricing-driven load shifting reduces the peak load from 654.3 to 590.3 MW, corresponding to a 9.8% peak reduction from the EV charging load alone. The real-time price profile has the lowest rate between 11:00 p.m. and 7:00 a.m., therefore, most EV owners would program their charging events by then.
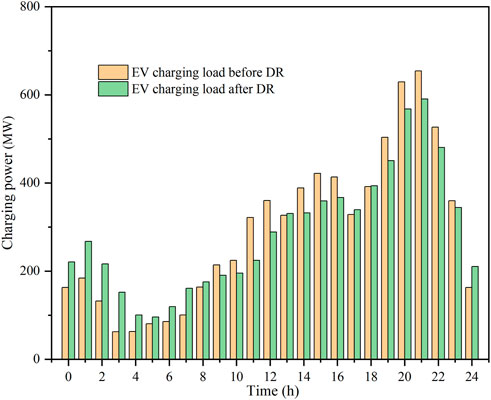
FIGURE 7. The EV demand profiles before and after the DR.
By combining the commercial and residential hourly load profiles and the EV charging load profile, Figure 8 demonstrates the change in the total electricity loads of Beijing before and after the DR problem. The DR program can potentially reduce the peak load from 18,770 to 18,500 MW, corresponding to a 1.4% peak reduction. This DR outcome occurs because the DR approach depends on real-time pricing, and the price profile has a valley around 6:00 a.m.
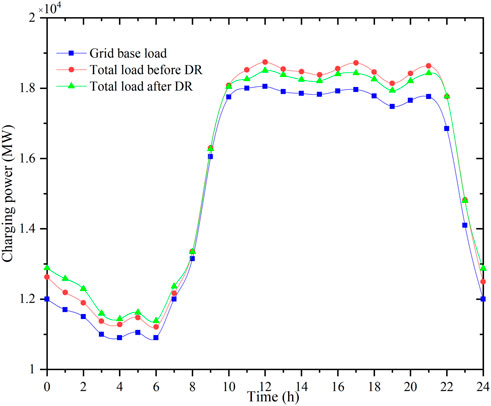
FIGURE 8. The base load profile and the total load profile before and after the DR problem.
The efficiency and effectiveness of the proposed method are evaluated by comparing with the case without DR on peak-to-valley ratio and average daily charging costs (Table 2). Simulation results show that the proposed algorithm has managed to reduce the daily cost for the EV owners to 482,146 yuan, from a high of 646,955 yuan for the case without the DR program, corresponding to a 25.49% cost reduction. The positive or negative change ratios correspond to an increase or decrease in the values between the case without or with the DR problem. As shown in Table 2, the strategy reduces the on-peak and mid-peak loads by 1.44% and 0.51%, respectively.
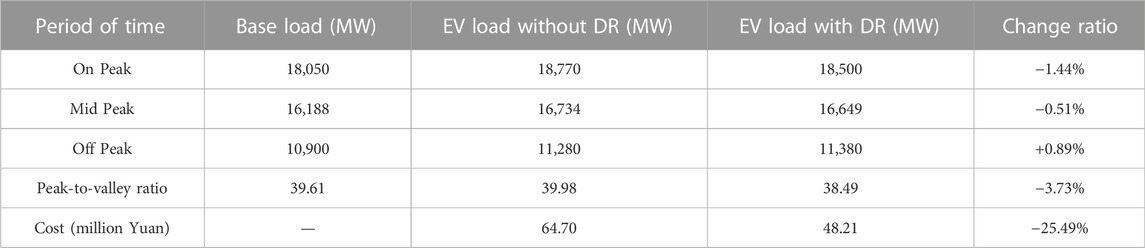
TABLE 2. simulation results.
Figure 9 shows the load profiles obtained by changing the EV owner’s participation rate value from 20% to 80%. The participation rate is defined as the proportion of the EV owners that are willing to adjust the charging schedules. The results show that the peak-to-valley difference decreases as the participation rate increases, which is expected.
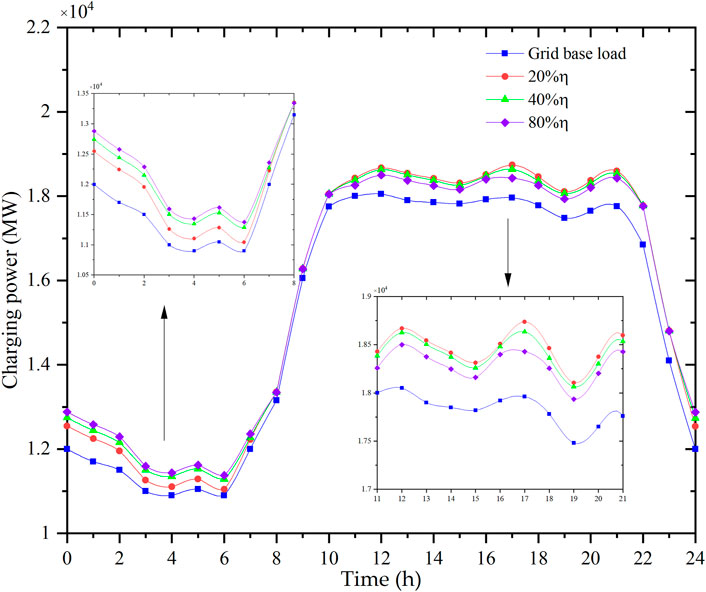
FIGURE 9. Sensitivity analysis of the participation rate.
The scheduling optimization model was implemented using MATLAB in the WINDOWS environment on a HUAWEI MateBook D laptop computer with an Intel i5-7200U CPU and 2.5 GM RAM. The converge time is 0.72 min.
The peak-to-valley ratio in the grid and the customer savings by participating in the proposed DR program confirm that with the given protocol, proper DR actions can reduce energy usage during certain periods. The genetic algorithm-based multi-objective optimization for EV charging rescheduling is feasible and efficient enough for the case study.
The results presented above are specific to the data, algorithms, and system used and may not yield comparable benefits in all scenarios. Nevertheless, the framework is general and applicable to a wide range of DR environments. Future research should focus on building a precise predictive model for the EV charging loads.
This study develops an optimization model to find the optimal TOU tariff rates and hourly schedule for EVs and analyses the influence of DR programs on the load profiles and customer cost. The presented model ensures that the TOU tariff can track the demand trends and that the optimization results meet the defined constraints. The model was tested for the city of Beijing with four types of EVs.
The simulation results indicate that the proposed DR helps transform the electricity system from a one-way, centralized power network where customers passively receive electricity to a two-way flow of information where EV owners regularly contribute to system operations. An optimal EV charging strategy could potentially attribute to reducing the slope of system ramps, firming the intermittency of renewable energy resources, and relieving congestion on the electric grid. It’s essential to note that the diversity of DR products adds another level of complexity to the current electricity market. Advances in smart metering and controlling technology are required for DR to play a greater, faster, and more diverse role in addressing the emerging grid needs.
The original contributions presented in the study are included in the article/Supplementary Material, further inquiries can be directed to the corresponding author.
YL Software, Writing—original draft JZ Validation, Writing—original draft YS Writing—review and editing MS-A Writing—review and editing TJ Resources YZ Resources YZ Funding acquisition, Project administration, Writing–original draft.
This work was supported by the Chinese Universities Scientific Fund under grant number 15052002. The funding was received for open access publication fees.
The authors declare that the research was conducted in the absence of any commercial or financial relationships that could be construed as a potential conflict of interest.
All claims expressed in this article are solely those of the authors and do not necessarily represent those of their affiliated organizations, or those of the publisher, the editors and the reviewers. Any product that may be evaluated in this article, or claim that may be made by its manufacturer, is not guaranteed or endorsed by the publisher.
Abbasi, M. H., Taki, M., and Zhang, J. (2020). Bi-level optimal bidding strategy of an aggregator in competition with rival aggregators. IET Smart Grid 3 (6), 898–905. doi:10.1049/iet-stg.2019.0360
Abdelbaky, M., Peeters, J. R., and Dewulf, W. (2021). On the influence of second use, future battery technologies, and battery lifetime on the maximum recycled content of future electric vehicle batteries in Europe. Waste Manag. 125, 1–9. doi:10.1016/j.wasman.2021.02.032
Chen, N., Tan, C. W., and Quek, T. Q. S. (2014). Electric vehicle charging in smart grid: Optimality and valley-filling algorithms. IEEE J. Sel. Top. Signal Process. 8 (6), 1073–1083. doi:10.1109/JSTSP.2014.2334275
Genis Mendoza, F., Konstantopoulos, G., and Bauso, D. (2022). Online pricing for demand-side management in a low-voltage resistive micro-grid via a Stackelberg game with incentive strategies. IET Smart Grid 5 (2), 76–89. doi:10.1049/stg2.12053
Gjelaj, M., Trholt, C., Hashemi, S., and Andersen, P. B. (August 2017). “Cost-benefit analysis of a novel DC fast-charging station with a local battery storage for EVs,” Proceedings of the 2017 52nd Internationaluniversities power engineering conference (UPEC). Crete, Greece pp. 1–6. doi:10.1109/UPEC.2017.8231973
Gong, X., Wang, F., Su, Y., and Xu, Q. (2021). Light robustness model for the bidding strategy of an electric vehicle aggregator. IET Smart Grid 4 (3), 255–269. doi:10.1049/stg2.12026
Gou, J., Lin, C., Li, J., Geng, B., Li, Z., Cao, Y., et al. (2021). Charging strategy for electric vehicles considering consumer psychology and trip chain. Front. Energy Res. 9. doi:10.3389/fenrg.2021.723370
Kataoka, R., Shichi, A., Yamada, H., Iwafune, Y., and Ogimoto, K. (2019). Comparison of the economic and environmental performance of V2H and residential stationary battery: Development of a multi-objective optimization method for homes of EV owners. World Electr. Veh. J. 10 (4), 78. doi:10.3390/wevj10040078
Kong, W., Ye, H., Wei, N., Xing, D., and Chen, W. (2022). Dynamic pricing based EV load management in distribution network. Energy Rep. 8, 798–805. doi:10.1016/j.egyr.2022.02.187
Limmer, S., and Rodemann, T. (2019). Peak load reduction through dynamic pricing for electric vehicle charging. Int. J. Electr. Power & Energy Syst. 113, 117–128. doi:10.1016/j.ijepes.2019.05.031
Liu, Q., and Qi, Z. (2014). Electric vehicles load forecasting model based on Monte Carlo simulation. Electr. Power Sci. Eng. 30 (10), 14–19.
McKinsey, (2018). How battery storage can help charge the electric-vehicle market.https://www.mckinsey.com/business-functions/sustainability-and-resource-productivity/our-insights/how-battery-storage-can-help-charge-the-electric-vehicle.
Moghaddam, Z., Ahmad, I., Habibi, D., and Masoum, M. A. (2019). A coordinated dynamic pricing model for electric vehicle charging stations. IEEE Trans. Transp. Electrific. 5 (1), 226–238. doi:10.1109/tte.2019.2897087
Rezaeimozafar, M., Eskandari, M., and Savkin, A. V. (2021). A self-optimizing scheduling model for large-scale EV fleets in microgrids. IEEE Trans. Ind. Inf. 17 (12), 8177–8188. doi:10.1109/tii.2021.3064368
Ruoyu, J. (2018). Research on electric vehicle charging optimization strategy based on demand response”. University of Electronic Science and Technology. Chengdu, China.
Sharma, S., and Jain, P. (2019). Integrated TOU price-based demand response and dynamic grid to vehicle charge scheduling of electric vehicle aggregator to support grid stability. Int. Trans. Electr. Energy Syst. 30 (1). doi:10.1002/2050-7038.12160
Wang, L., and Singh, C. (2007). Environmental/economic power dispatch using a fuzzified multi-objective particle swarm optimization algorithm. Electr. Power Syst. Res. 77 (12), 1654–1664. doi:10.1016/j.epsr.2006.11.012
Wang, S., Bi, S., and Zhang, Y. A. (2019). Reinforcement learning for real-time pricing and scheduling control in EV charging stations. IEEE Trans. Ind. Inf. 17 (2), 849–859. doi:10.1109/tii.2019.2950809
Wenqiang, Y., Zhanlei, P., Wei, F., and Ilyas, M. M. (2021). A novel real-coded genetic algorithm for dynamic economic dispatch integrating plug-in electric vehicles. Front. Energy Res. 9. doi:10.3389/fenrg.2021.706782
Yang, W., Peng, Z., Feng, W., and Menhas, M. I. (2021). A novel real-coded genetic algorithm for dynamic economic dispatch integrating plug-in electric vehicles. Front. Energy Res. 9.
Yu, S., Du, Z., and Chen, L. (2022). Optimal regulation strategy of electric vehicle charging and discharging based on dynamic regional dispatching price. Front. Energy Res. 10. doi:10.3389/fenrg.2022.873262
Zhang, G., Tan, S. T., and Wang, G. G. (2018). Real-time smart charging of electric vehicles for demand charge reduction at non-residential sites. IEEE Trans. Smart Grid 9 (5), 4027–4037. doi:10.1109/TSG.2016.2647620
Zhang, Q., Sun, T., Ding, Z., and Li, C. (2021). Nodal dynamic charging price formulation for electric vehicle through the Stackelberg game considering grid congestion. IET Smart Grid 4 (5), 461–473. doi:10.1049/stg2.12025
Zheng, Y., Celik, B., Suryanarayanan, S., Maciejewski, A. A., Siegel, H. J., and Hansen, T. M. (2021). An aggregator-based resource allocation in the smart grid using an artificial neural network and sliding time window optimization. IET Smart Grid 4 (6), 612–622. doi:10.1049/stg2.12042
Zhou, K., Cheng, L., Lu, X., and Wen, L. (2020). Scheduling model of electric vehicles charging considering inconvenience and dynamic electricity prices. Appl. Energy 276.
EV electric vehicles
DR demand response
DP dynamic pricing
MOOP multi-objective optimization
SoC state-of-charge
GA genetic algorithm
TOU time-of-Use
PDF probability density function
N normal distribution
U uniform distribution
T, t set of time periods, time index
N, i set of EVs, EV index
Tc charging duration (h)
S the daily mileages (km)
Smax the maximum driving range (km)
SOC0 the initial State of Charge (%)
Ecap battery capacity (kW·h)
Prate charging rate (kW)
η charging efficiency (%)
q0 the initial electric energy demand (kW)
p0 the initial price of electricity (yuan)
qi0 the load at the time i before the tariff change (kW)
pj0 the tariff at the time j before the tariff change (yuan)
pi current price (yuan)
qi current demand (kW)
Ec electricity price elasticity matrix
εij electricity price elasticity factor
EEV the amount of energy purchased from the utility
πt real-time electricity price at time t (yuan)
πon_peak on-peak rate (yuan)
πmid_peak mid-peak rate (yuan)
πoff_peak off-peak rate (yuan)
Keywords: electric vehicles, smart grid, demand response, optimal charging, dynamic pricing, charging schedule
Citation: Liu Y, Zhu J, Sang Y, Sahraei-Ardakani M, Jing T, Zhao Y and Zheng Y (2023) An aggregator-based dynamic pricing mechanism and optimal scheduling scheme for the electric vehicle charging. Front. Energy Res. 10:1037253. doi: 10.3389/fenrg.2022.1037253
Received: 05 September 2022; Accepted: 29 November 2022;
Published: 20 January 2023.
Edited by:
Qiteng Hong, University of Strathclyde, United KingdomReviewed by:
Yue Zhou, Cardiff University, United KingdomCopyright © 2023 Liu, Zhu, Sang, Sahraei-Ardakani, Jing, Zhao and Zheng. This is an open-access article distributed under the terms of the Creative Commons Attribution License (CC BY). The use, distribution or reproduction in other forums is permitted, provided the original author(s) and the copyright owner(s) are credited and that the original publication in this journal is cited, in accordance with accepted academic practice. No use, distribution or reproduction is permitted which does not comply with these terms.
*Correspondence: Yingying Zheng, eXl6aGVuZ0BjYXUuZWR1LmNu
Disclaimer: All claims expressed in this article are solely those of the authors and do not necessarily represent those of their affiliated organizations, or those of the publisher, the editors and the reviewers. Any product that may be evaluated in this article or claim that may be made by its manufacturer is not guaranteed or endorsed by the publisher.
Research integrity at Frontiers
Learn more about the work of our research integrity team to safeguard the quality of each article we publish.