 Changhui Yang
 Yangyu Cui
 Lijun He
 Qi Jiang
- School of Management, Hefei University of Technology, Hefei, China
CCS technology is significant to achieve carbon emission reduction in the current coal-based energy mix in China, just as PV received more policy subsidies from the Chinese government to promote its industry development in the early stage, and all parties in the society, including the government and enterprises, have paid attention to and supported the development of CCS technology to promote the implementation of carbon emission reduction. This paper evaluates the regional investment benefits and investment timing of CCS retrofitting and RTDPV in different scenarios for each province in China based on the real option approach. The results show that the initial cost subsidy and participation in the carbon market are not as effective as the feed-in tariff subsidy, and the investment return of CCS retrofit is better than RTDPV in the scenario with feed-in tariff subsidy, and most provinces can achieve immediate investment. RTDPV without subsidies cannot achieve full parity nationwide yet, and some provinces are not suitable for investment without participating in the carbon market. The net present value approach would underestimate the investment value of CCS and RTDPV and prematurely reject investment in many scenarios, while provinces under the real option approach tend to delay investment to obtain optimal investment returns. This paper provides a reference for investors to make investment decisions in low-carbon technologies and for governments to develop CCS incentives.
1 Introduction
In the context of global efforts to address climate change, the Chinese government committed to the international community at the 75th session of the United Nations General Assembly that China’s carbon dioxide emissions will peak by 2030 and that the country would become carbon neutral by 2060 (Central People’s Government of the People’s Republic of China, 2020). After China became the world’s largest CO2 emitter in 2019, it faced substantial pressure to take steps toward carbon emission reduction (Zheng et al., 2021). The coal power industry is the largest contributor to China’s carbon emissions, accounting for more than 40% of the country’s total CO2 emissions, according to Carbon Emission Acconts & Datasets (Shan et al., 2018, 2020; Carbon Emission Acconts & Datasets, 2021; Guan et al., 2021). The power industry therefore must address the challenge of climate change and make great efforts for a low-carbon transition.
The Paris Agreement’s goal of net-zero greenhouse gas emissions has stimulated the use of low-carbon energy technologies, including carbon capture and storage (CCS) technologies and renewable energy technologies (Intergovernmental Panel on Climate Change, 2018). These can also be important tools to reduce carbon emissions in the power sector. Solar energy is cheap, clean and sustainable (Safarianzengir et al., 2022). China is a vast country with abundant solar energy resources, and it began promoting the development of the photovoltaic (PV) industry in the 1970s (Han et al., 2020). Its installed PV capacity has grown rapidly in a short period of time with strong policy support from China (Li et al., 2020), and quickly became a global leader in installed renewable energy (Rausser et al., 2022). By the end of 2021, its installed PV power ranked first in the world for nine consecutive years. Installed PV grid-connected generation capacity reached 306 million kilowatts, about a third of which is distributed PV (National Energy Administration, 2022). After the “Notice of the National Energy Administration Comprehensive Department on the submission of the whole county (city, district) roof distributed photovoltaic development pilot program”, 25 provinces nationwide reported nearly 500 pilot counties and a total development of close to 200 GW. The State Power Investment Corporation reacted quickly to this nationwide movement. It signed or started cooperation with projects involving 20 provinces and cities and is further targeting over 100 counties. National Energy Group has signed 33 whole-county distributed development projects, and China Huaneng Group has signed 2 GW of whole-county distributed projects. “Whole-county promotion + central enterprises” has led to the creation of the rooftop distributed photovoltaic (RTDPV) market. PV projects are becoming more and more integrated in construction, transportation, and other areas of development, and RTDPV can accelerate this development.
Because of the many advantages of rooftop PV, many scholars have studied the development of the rooftop PV industry from several aspects, mainly related to regional development potential, feed-in tariff (FIT), costs, and economic benefits (Xin-gang and Yi-min, 2019). Using Beijing as an example, Wang et al. explored the carbon reduction potential and financial feasibility of urban rooftop PV power applications, calculating and comparing the life-cycle CO2 emission factors of thermal power and rooftop PV power (Wang et al., 2018). Duma et al. used a discounted payback period and internal rate of return for an economic analysis of grid-connected rooftop PV schemes in Turkey to analyze the impact of the FIT and initial PV cost on system feasibility (Duman and Güler, 2020). Zhao et al. studied the economic performance of China’s distributed PV industry in terms of both technology and cost using two indicators: levelized cost of energy (LCOE) and internal rate of return (IRR) (Xin-gang and Zhen, 2019).
In a short time, China’s energy structure dominated by coal-fired power plants will not change immediately, and the current PV power generation is not enough to cover China’s energy demand. Furthermore, the PV power supply is intermittent and unstable unless paired with an energy storage system (Yang and Zhao, 2018). The low-carbon development of China’s power supply must consider its security, economy, and sustainability. According to the latest International Energy Agency report, coal-fired and natural gas-fired power generation still dominates the global power sector, with China’s coal-fired power generation accounting for more than 60% of the total domestic power generation capacity (International Energy Agency, 2020). As a way of addressing the carbon emissions generated from coal, CCS is an important means that can help mitigating global climate change (Akerboom et al., 2021). Existing power plants and factories can be retrofitted and upgraded with CCS technology to provide low-carbon electricity, providing solutions for industries facing greater pressure to reduce emissions (Fan et al., 2018). The large number of coal-fired power plants in China provides the basis for CCS applications, with the total installed coal power capacity in China reaching 1.08 billion kW in 2020, more than all other countries combined (Central People’s Government of the People’s Republic of China, 2021). CCS technologies can generally reduce carbon emissions from coal-fired power plants by 90% (Global CCS Institute, 2017), controlling emissions at the source. Study results have indicated that China’s demand for CCS emission reduction under its carbon neutrality target is 0.02–0.408 billion tons by 2030 and 1–1.82 billion tons by 2060 (Chinese Academy of Environmental Planning, 2021). The scale of CCS pilot demonstration projects in China has been growing recently. In 2021, there were about 40 Carbon Capture, Utilization and Storage demonstration projects in operation or under construction in China, spread across 19 provinces, with a capture capacity of 3 million tons/year. Among them, the National Energy Group Erdos project has successfully carried out a full CCS process demonstration at the scale of 100,000 tons/year. The China National Petroleum Corporation Jilin Oilfield CO2 Enhanced Oil Recovery (CO2-EOR), the largest EOR project in Asia and the only Chinese project among 21 large Carbon Capture, Utilization and Storage demonstration projects in operation worldwide, has injected more than 2 million tons of CO2 in total (Chinese Academy of Environmental Planning, 2021).
In assessing CCS investments, some scholars focus on the carbon price that influences investment decisions, the cost of CCS retrofitting, and subsidy incentives. To effectively mitigate carbon emissions, China has established carbon emission trading markets in several pilot regions since 2011 (Xian et al., 2020), and the opening of the national carbon market in 2021 has further boosted the retrofit of CCS in coal-fired power plants. According to the Intercontinental Exchange, the European Union carbon market price has been close to €100/ton since 2022 (Intercontinental Exchange, 2022), while China’s carbon price is at a low level, with the highest price since the opening of the national carbon market only reaching $7–8/tCO2. The CO2 abatement cost is estimated to be $35–70/tCO2(Lilliestam et al., 2012), with a large gap between the high carbon abatement cost and the low carbon price. CCS retrofitting therefore remains a heavy financial burden for coal-fired power plants. This is important because the cost of large-scale CCS applications is the main obstacle to its wider deployment (Budinis et al., 2018). Costs mainly include transportation and storage costs, CO2 capture costs, of which capture costs occupy the largest proportion (Roussanaly et al., 2020). Drawing on the history of the adoption of other low-carbon technologies, CCS development and deployment requires significant government support, especially in the early stages (Fan and Dong, 2018). Some studies suggest that government subsidies may be profitable if they cover the entire CCS investment cost, although a higher carbon price is required (Wang and Du, 2016). Fan et al. studied the incentive effect of different subsidy models on CCS and showed that the 45Q subsidy model and the total initial investment and operation and maintenance (O&M) costs subsidy model are suitable for a 40-year emission reduction program for coal-fired power plants (Fan et al., 2019b).
Some scholars focus on comparing CCS and renewable energy in terms of cost, potential, and benefit (Lilliestam et al., 2012; Fan et al., 2019a), but the subjects of their renewable energy comparison are large power plants. Rooftop PV has the advantages of close proximity to the customer, flexible assembly, low construction costs, low-voltage grid connection, fast power consumption, and higher returns compared to large power plants, making it an attractive option for investors (Xin-gang and Yi-min, 2019). In the future, the development of PV power generation is expected to shift from large ground-based power plants to distributed photovoltaics closer to the needs of users. The new demand for the market of RTDPV brought by the Whole-county promotion will significantly promote China’s low-carbon transformation. Alternatively, CCS retrofitting of coal-fired power plants can provide stable low-carbon electricity. CCS retrofitting and RTDPV construction have obvious regional distribution characteristics, and China must evaluate the investment value, timing, and application costs of both technologies while leveraging regional advantages in order to meet its “30⋅60” climate commitment.
Given that investments in low carbon technologies such as CCS and RTDPV involve several uncertainties, traditional valuation methods ignore the value of investment uncertainties and therefore do not fully reflect the potential value of investment projects (Kim et al., 2017; Fan et al., 2020). Some scholars have applied the real option method to evaluate CCS projects (Chen et al., 2016; Yang et al., 2019; Fan et al., 2020) and rooftop PV projects (Moon and Baran, 2018; Nguyen et al., 2018; Penizzotto et al., 2019). Commonly used valuation methods for real option are binomial tree, dynamic programming (DP), partial differential equation (PDE), and simulation (Agaton, 2021). Among them, PDE and DP are not suitable for dealing with option pricing problems involving multiple underlying assets, while least-squares Monte Carlo (LSMC) methods can evaluate complex and compound options with many potential random variables. Therefore, LSMC is used in this paper for real option valuation.
The main contributions of this study are as follows:
1) The real option method was used to compare the investment benefits and timing of CCS retrofitting and RTDPV (taking into account uncertainties such as investment costs and carbon prices, and the potential value from technological advances). It also was compared with the NPV method to quantify the increased investment value of the real option method.
2) Considering the single and synergistic effects of the carbon emission trading market and subsidy incentive policies (including investment cost subsidy and FIT subsidy), multiple scenarios were designed to compare and analyze the impact of CCS retrofitting of coal-fired power plants and RTDPV investment in China.
3) Differences were identified and quantified between the investment returns and timing of CCS retrofitting and RTDPV in different provinces of China as a result of regional resources and local policies. Interprovincial differences in various indicators affecting economics were considered in the model.
2 Methodology
This paper deals with the comparison of two valuation methods, so in the first part of this section, we introduce the net present value (NPV) method and the real option method; in the second part and the third part, we conduct cost and benefit analysis for RTDPV and coal-fired power plant CCS retrofitting to assess the project value, respectively. The fourth part models the uncertainty factors affecting the project; and the last part details the steps of solving the real option through the LSMC method.
2.1 Valuation methods
The traditional NPV approach only yields deterministic investment decisions. In contrast, the real options method takes into account the value of uncertainty and provides investors with the flexibility to make investment decisions. In this section, the CCS retrofitting and RTDPV projects will be valued using the traditional NPV method and the real options method, respectively, and the investment value of the two valuation methods will be compared to verify whether the impact of uncertainty is significant.
2.1.1 Net present value model
The NPV method is widely used for investment benefit evaluation in deterministic settings that do not take uncertainty and management flexibility into account.
2.1.1.1 RTDPV investment projects
If the life cycle of a RTDPV project is T years and the initial investment cost is Ipv, the NPV of the whole generation cycle can be expressed as:
2.1.1.2 CCS retrofitting investment project for coal-fired power plants
Let T′ be the lifetime of a coal-fired power plant and
Where K is the subsidy percentage of the initial investment costs, α is the empirical parameter of the initial investment costs, and β is the empirical parameter of the O&M costs. The annual cash flow,
2.1.2 Real option model
A real option is a type of option where the subject matter is a physical object. First created by Myers in 1977 (Myers, 1977), its design takes into account three important factors: the irreversibility of the investment, the uncertainty of the future cash flows of the investment, and the opportunity for flexible timing of the investment (Fuss et al., 2008). Prior to this, the traditional NPV approach was widely used for investment efficiency evaluations, and investors chose to invest only if the NPV was greater than zero. The investment decision for CCS retrofitting of coal-fired power plants with RTDPV can be influenced by uncertainties such as carbon price, investment cost, and the timing of the investment. However, the NPV method does not consider these uncertainties or any flexibility in the management of the investment and may underestimate its actual value. A real option model can make the optimal investment decision.
According to the real option method, the total investment value of a project can be expressed as
FV represents the total investment value of the project, V denotes the increased investment value after accounting for uncertainty Funcertain in the classical NPV approach, and OV denotes the economic value of management flexibility. In the framework of the real option method, the investor has the right to delay the investment and choose the best time to invest in order to maximize the project value.
where tp is the optimal investment timing and ti is the delayed investment time frame.
2.2 Cost–benefit analysis of RTDPV project investment
RTDPV can take advantage of the decentralized nature of solar energy, and flexible use of idle rooftops for investment; in the long run, the economy is better. Due to the scattered rooftop resources of rural residents, the village committees are considered to unify resources and implement the ‘full access’ model under the county-wide promotion model. Given that China’s PV power generation has entered a new stage of subsidy-free development (National Development and Reform Commission, 2022), this paper discusses the RTDPV in the subsidy-free mode.
2.2.1 The benefits of the RTDPV project
RTDPV generation cycle revenues include FIT revenues
Where Pe is the price of desulfurized coal,
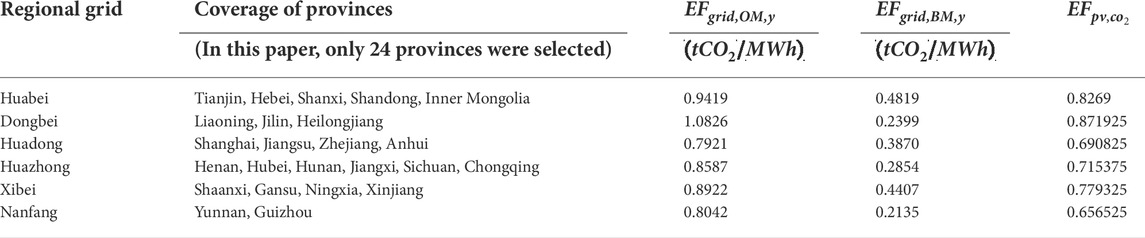
TABLE 1. Table of carbon emission factors of the regional power grid.
2.2.2 The costs of the RTDPV project
The RTDPV generation cycle cost includes an initial investment cost
where rpvO&M is the ratio of the annual O&M costs of RTDPV to the initial investment costs.
2.3 Cost–benefit analysis of CCS retrofitting project investment
The CCS system consists of three components: capture, transportation, and storage. This section analyzes the benefits and costs of CCS retrofitting separately.
2.3.1 Benefits of the CCS retrofitting project
CCS technology consists of several processes such as CO2 separation, capture, transport, and storage. The revenue from CCS retrofitting of coal-fired power plants during the generation cycle mainly includes CO2 reduction revenue
where
2.3.2 Costs of CCS retrofitting
The cost of CCS retrofitting coal-fired power plants during the generation cycle mainly covers the initial investment costs
Pcoal is the coal price; Ecoal is the additional coal consumption due to efficiency penalty. PSCC is the coal consumption per unit of power supply; λ is the additional coal consumption rate due to CO2 capture;
2.4 Uncertainty of CCS retrofitting and RTDPV investment
Uncertainty is a critical factor affecting investment decisions in CCS retrofitting and RTDPV projects. Uncertainty factors are modeled in this subsection and include changing carbon prices, decreasing costs of CCS retrofitting technologies, and initial PV investment costs consistent with geometric Brownian motion.
2.4.1 Carbon price
Due to the short and unstable history of the carbon emissions trading market, there is no sufficiently reliable time series to support a long-term trend fit. Based on previous studies (Fuss et al., 2008; Zhu and Fan, 2013), it is reasonable to assume that carbon price fluctuations are governed by geometric Brownian motion (GBM) as follows:
μc and σc denote the drift and variance parameters of the carbon price, respectively; dω is the Wiener process in independent increments. The carbon price tends to increase over time.
2.4.2 CCS technological advances
The concept of the “learning curve” was first proposed by Whight (Wright, 1936), and Arrow (Arrow, 1971) later established the Learning by Doing (LBD) learning curve model. The development of new energy industries, such as wind power and photovoltaic power generation, is consistent with the learning curve model. It is therefore necessary to consider the impact of technological advances on future investments in CCS projects in coal-fired power plants. Due to technological progress, the investment cost of CCS retrofitting decreases year by year as follows:
2.4.3 Initial investment cost
Based on existing studies (Zhang M. et al., 2014; Moon and Baran, 2018; Fan et al., 2019a), it is reasonable to assume that the initial investment costs of RTDPV is controlled by GBM as
where μp and σp represent the drift rate and volatility of the initial investment cost of RTDPV, respectively.
2.5 Real option model solution: Least squares Monte Carlo simulation
Given that the real option model includes uncertainties such as carbon price and initial investment cost, LSMC was used to solve the model using MATLAB software using the following procedure:
1) A Monte Carlo method is applied to simulate the change paths of a discrete process with random changes in carbon price and initial investment cost. S is the number of paths simulated, and the time interval [0, ti] is divided equally into I subintervals, each of length △t = ti/I. For any path j, the return on investment is calculated for each discrete time point of the investment validity period ti.
2) Each path’s optimal investment time and option value was calculated. The investor can choose the investment time point t during the investment life [0, ti] or can invest at the last discrete time point of the investment life (t = ti) if the investor has not already invested:
πt,j = 1 denotes an immediate investment, while πt,j = 0 denotes a deferred investment.
At any discrete time point t within [0, ti], the investor will compare the immediate return at each point in time with the expected return from continuing to hold the option. If the immediate return is greater than the expected return, the investor will choose to invest immediately. Otherwise, the investor will defer the investment. R denotes the average of the Bank of China’s RMB deposit rates for financial institutions for one-year deposits from 1990 to 2015.
In this case, the expected return of continuing to hold the option is fitted by least-squares regression. The immediate return of executing the option is regarded as the independent variable, the expected return of continuing to hold the option is regarded as the dependent variable, and the regression coefficients are derived through multiple regression and then brought into the least-squares fitting formula to obtain the expected return of continuing to hold the option. This replaces the expected return derived from the Monte Carlo simulation.
3) For any path j, the above recursive process needs to be solved backward from the last time point to the first time point until the optimal investment time point tp for each path is found. The option returns for each path are then discounted and averaged.
To compare the performance of CCS and RTDPV more clearly despite their difference in installed capacity and power generation, the unit investment efficiency was used to assess the market competitiveness and investment efficiency. The calculation formula is (Fan et al., 2019a),
UNPVpv and UFVpv denote the unit net present value per MWh and the unit total investment value per MWh for RTDPV, respectively. UNPVccs and UFVccs denote the unit net present value per MWh and the unit total investment value per MWh for CCS retrofitting, respectively.
3 Data processing and scenario setting
The share of super (super) critical units in Chinese coal-fired power plants reaches 59%, so 600 MW supercritical units are selected as the basis for calculation in this paper. The size of RTDPV under the whole county promotion policy varies from several tens to tens of thousands of MW, so to have the same benchmark for comparison among provinces, 1 MW is selected as the benchmark for calculating the unit revenue in this paper. Six scenarios are set up to evaluate the impact of single and synergistic effects of different incentives on investment decisions of CCS retrofit and RTDPV projects.
3.1 Data selection and processing
Since most power plants in China do not have suitable onshore storage sites within a reasonable pipeline distance, most of these plants are located in the more densely populated Guangdong, Fujian, and Guangxi regions. Therefore, CCS retrofitting is not considered for these provinces. There are few coal-fired power plants in the Hainan, Qinghai, and Tibet regions, and Beijing is no longer used for power generation due to policy restrictions on all coal-fired units. Therefore, CCS retrofitting were not considered in these four areas, either. In addition, there is no public data on coal-fired units in Hong Kong, Macao, and Taiwan. To make the study results more scientific and reasonable, the comparison between CCS retrofitting and RTDPV was processed based on data from plants in the remaining 24 provinces in China. In addition, this paper considers a comparative study of two low-carbon technologies, so taxes are not considered.
The average utilization hours of coal-fired units and coal consumption of power supply in China were obtained from the China Electricity Council, while coal prices are obtained from Inner Mongolia Coal Center (Inner Mongolia Coal Center, 2021) (Figure 1). The FIT for RTDPV in different provinces in China are different. According to the notice issued by the National Development and Reform Commission, the FIT for new projects in 2021 is based on the local benchmark price for coal-fired power generation. In addition, the annual effective hours of sunshine in each province are obtained from the “China Wind and Solar Energy Resources Annual Bulletin 2021” issued by the China Meteorological Administration, as shown in Figure 2 below, and the rest of the basic data and parameters are shown in Table 2.
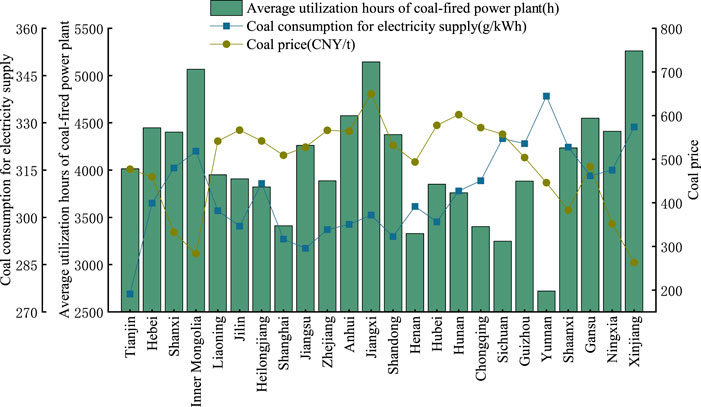
FIGURE 1. Coal-fired unit utilization hours, power supply coal consumption, and coal prices by province.
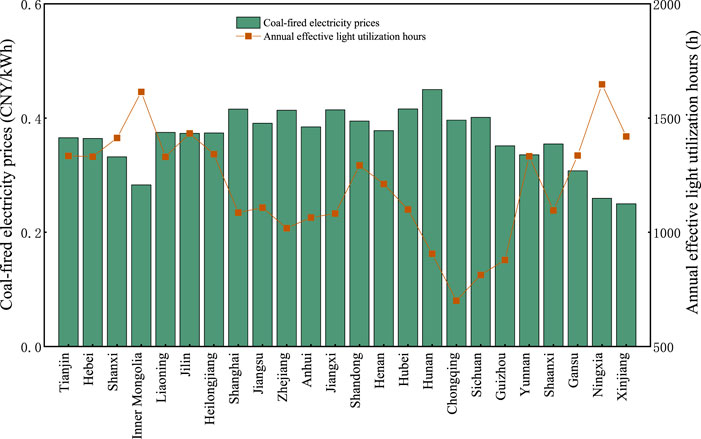
FIGURE 2. Coal-fired electricity prices and annual effective hours of light by the province.
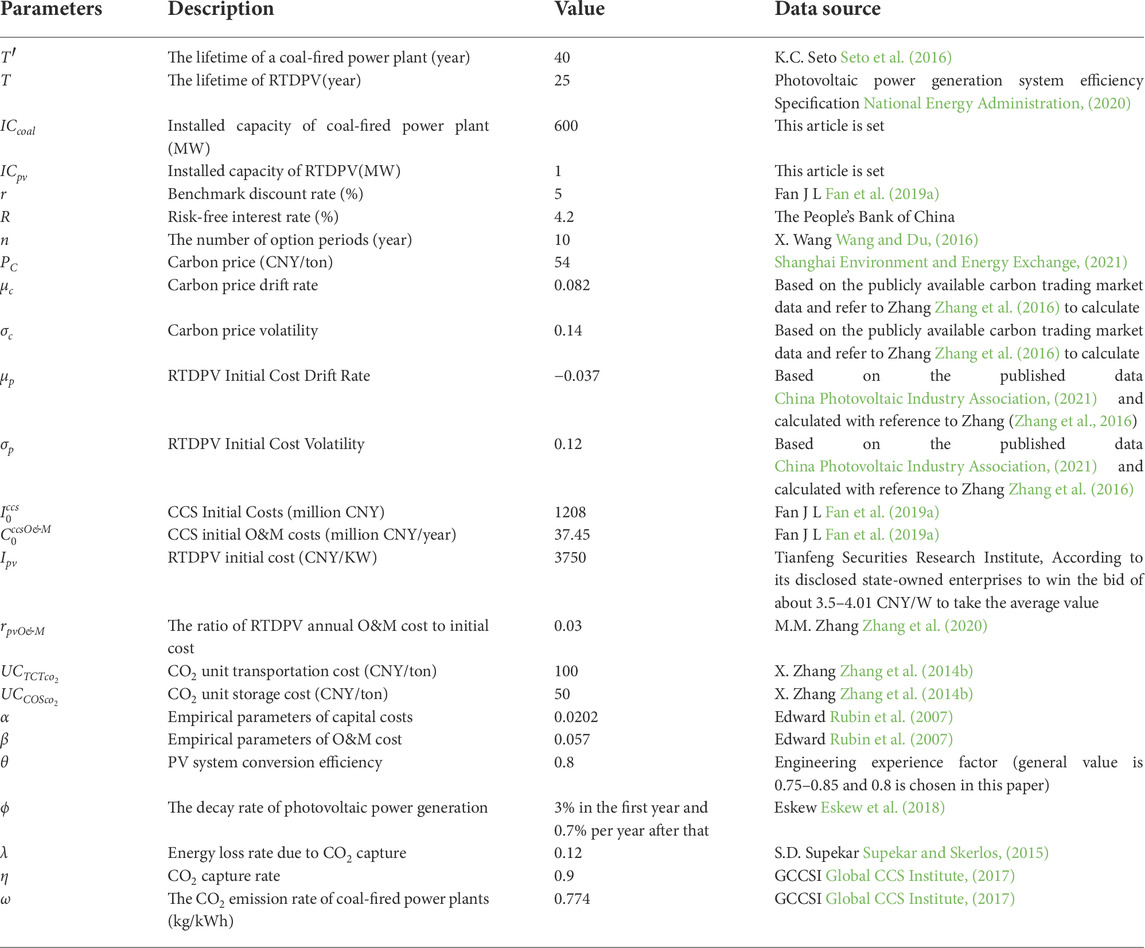
TABLE 2. Basic parameters of CCS retrofitting of coal-fired power plants and RTDPV.
3.2 Scenario setting
Public policies are important in driving a low-carbon transition; the benefits of projects can vary greatly under different policy scenarios. The Chinese government has implemented different policies to reduce carbon emissions. As a renewable energy source, RTDPV has received more government support since its development. PV power generation in China has essentially entered a new phase of flat-rate, subsidy-free development, and PV subsidies are gradually declining, as shown in Table 3; as such, they were not considered in the scenario setting for RTDPV. The unbalanced development of CCS technology and RTDPV can be seen as a result of different subsidy policy preferences. Therefore, this paper considers the historical subsidy policy of RTDPV, which is also a low-carbon technology, for CCS retrofitting in the scenario setting.
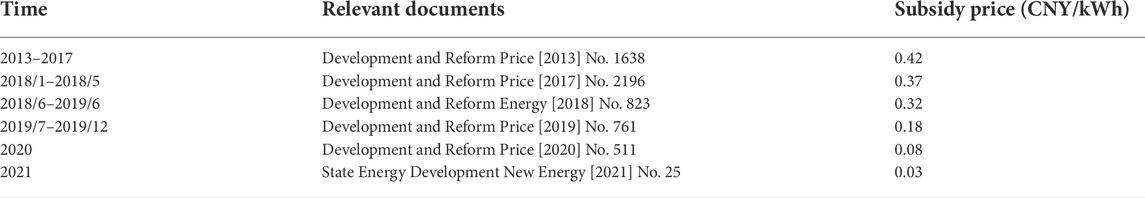
TABLE 3. Policies related to subsidies for household distributed PV.
The high initial cost of CCS retrofitting is one factor that often causes investors to hesitate. Therefore, the impact of initial cost on the investment decision is also considered in the scenario setting. In addition, China’s unified carbon emission market has been launched, and the power industry is the first industry to be included in the carbon trading market. Therefore, the carbon trading market is also included in the scenarios considered in this paper.
As mentioned above, six different scenarios are set up in this paper to assess the impact of single and synergistic effects of different incentives on project investment decisions. As shown in Table 4, S1 is the baseline scenario without any incentive mechanism; S2, S3, and S4 consider the single role of the carbon market, initial investment subsidy, and FIT subsidy, respectively; S5 and S6 consider the synergistic roles of both subsidies and carbon market, respectively.
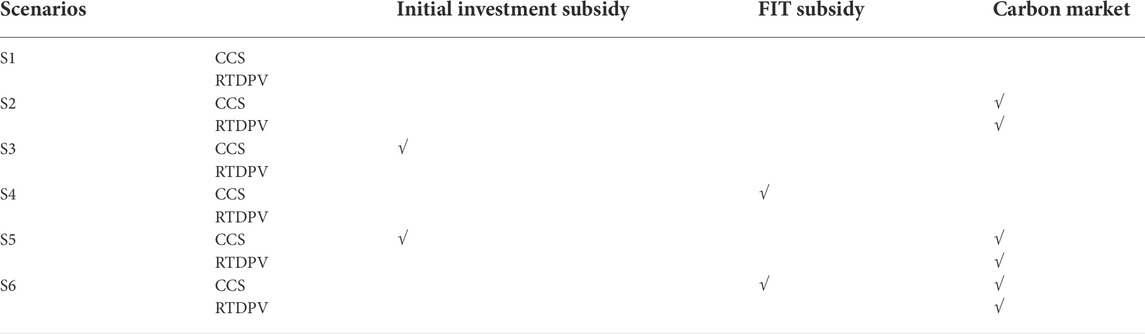
TABLE 4. Scenario setting.
4 Results and discussion
The scenario analysis in this section considers the impact of a single incentive mechanism and the synergistic impact of different incentive mechanisms. To make the results more accurate, 10,000 simulations were performed for each scenario. The optimal investment time for all scenarios is shown in Figure 3 below.
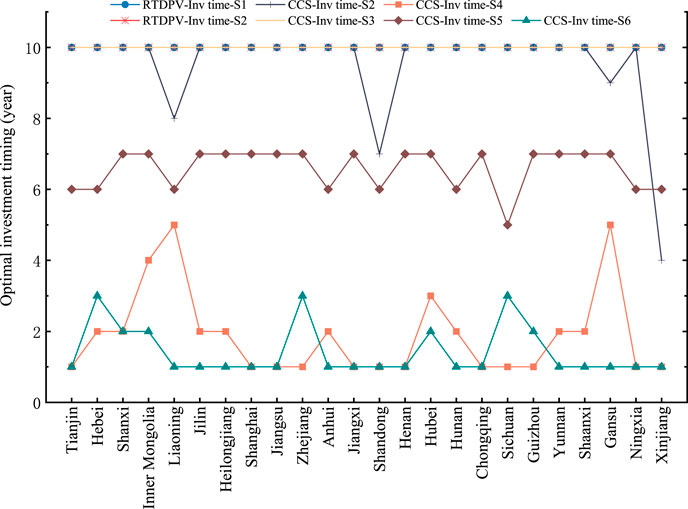
FIGURE 3. Optimal investment timing.
4.1 Baseline scenario without incentives
Scenario S1, which considers CCS retrofitting and RTDPV without subsidies or a carbon market, can be considered the baseline scenario. The UNPV and UFV of CCS and RTDPV are shown in Figure 4. Ten of the 24 provinces (Anhui, Jiangxi, Henan, Hubei, Hunan, Chongqing, Guizhou, Shaanxi, Ningxia, and Xinjiang) were unsuitable for investment under the NPV method. The differences among the provinces mainly stem from the differences in light resources and electricity prices. Although Ningxia and Xinjiang have acceptable light resources, their FIT are low, only 0.2595 CNY/kWh and 0.25 CNY/kWh. The remaining eight provinces possess poor light resources; among them, Chongqing and Guizhou have the worst unit NPV performance, at –142.18 CNY/MWh and –150.16 CNY/MWh, respectively. Excepting the above ten provinces, the UNPV of the remaining fourteen provinces is greater than zero, between 13 and 62 CNY/MWh. According to the NPV decision method, at this stage, RTDPV project investments can be made for those fourteen provinces. However, the investment returns are not yet satisfactory. In the discussion above, the real option method shows results that are more in line with reality, where investors tend to wait and all provinces choosing to invest in the last year of the investment validity period, as shown in Figure 3 above. At this point, the UFV increases by 63–180 CNY/MWh in these provinces compared to UNPV. Among them, Chongqing and Guizhou have the highest increase, indicating that the deferred investment in provinces with poorer light resources brings higher returns under this scenario.
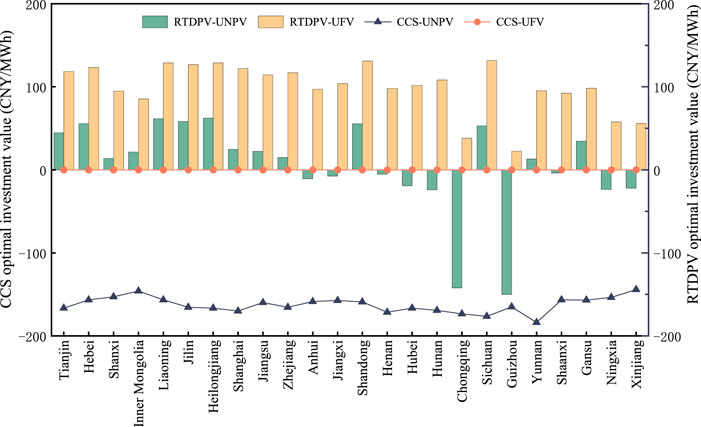
FIGURE 4. UNPV and UFV of CCS and RTDPV.
As for CCS, the UNPV of CCS retrofitting of coal-fired power plants is clearly negative among the 24 provinces in China under the NPV method, indicating that it is not suitable for investment. Among them, Yunnan, Chongqing, and Sichuan are at the lower level of economic efficiency among the 24 provinces, while Xinjiang and Inner Mongolia have the best UNPV performance. This is because the annual operating hours of coal-fired power plants in Yunnan, Chongqing, and Sichuan are relatively low, 2721, 3403, and 3247 h, respectively, which are far below the national average of 4640 h. Also, the coal price is high compared to other provinces. In contrast, Xinjiang and Inner Mongolia have the country’s highest annual power generation hours, exceeding 5000 h, and the coal price is less than 300 CNY/ton. Under the real option method, the UFV of all provinces is 0, and investment should be abandoned.
In summary, in the S1 case, RTDPV in China is more attractive to investors in some provinces, and investors tend to delay investment to obtain optimal investment value. In contrast, CCS is far inferior RTDPV from an investment standpoint. In the absence of favorable government incentives, coal-fired power plants would likely struggle to apply CCS technology.
4.2 Comparison of the impact of single incentive mechanism on investment decision of CCS retrofitting and RTDPV
The single-factor effects of the carbon price, initial investment subsidy, and FIT subsidy are explored in three scenarios, S2, S3, and S4, respectively, to compare the investment returns and investment timing of CCS retrofitting and RTDPV. These mechanisms can be effective in promoting CCS retrofitting when the same FIT subsidy scenario as RTDPV is provided, at least in instances where both the UFV and UNPV of CCS retrofitting are better than those RTDPV. The incentive effect of participating in the carbon market is slightly better than the initial investment subsidy.
4.2.1 Carbon price impact
In S2, the RTDPV and CCS retrofitting cash flows consider carbon trading revenue, and the comparison of the investment returns of S2 and S1 is shown in Figure 5. Under the NPV method, the UNPV of RTDPV in S2 increased and was positive in all provinces except for Chongqing and Guizhou, where the UNPV is still negative. This means that investment is a viable option for all provinces except for Chongqing and Guizhou. Under the real option method, the UFV increases by CNY 168–276 compared to UNPV. The provinces with the best returns are Liaoning, Jilin, and Heilongjiang, all exceeding 290 CNY/MWh. Chongqing and Guizhou remain on the low end among the 24 provinces examined due to their limited light resources, with returns of CNY 172.66 and CNY 145.87 per MWh, respectively. Although participation in the carbon market increases the value of their investment, provinces tend to delay their investment until the final year due to the high initial cost of RTDPV and the low return brought by the full feed-in model, as well as the lack of stimulus brought by participation in the carbon market (Figure 5).
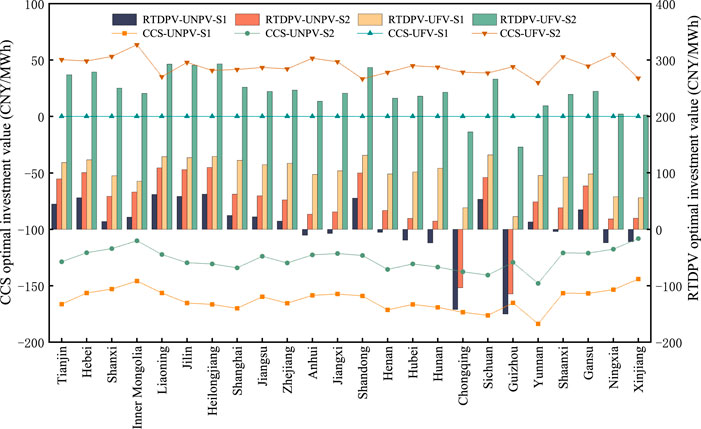
FIGURE 5. Comparison of CCS and RTDPV investment value in S1 and S2.
As for CCS, under the NPV method, the prospects of CCS retrofitting improved compared to S1, but the UNPV remained negative in all provinces. Even the introduction of the carbon market to the NPV method is not enough to encourage investment. Under the RO method, although UNPV is still negative, UFV becomes positive in all 24 provinces, indicating that CCS retrofitting is feasible. However, the investment must be delayed if it is to be profitable. Inner Mongolia has the highest return of 35.98 CNY/MWh, while Yunnan has the lowest return of 16.98 CNY/MWh. CCS under the RO method can flexibly choose the investment timing to obtain the optimal investment value. All provinces in S2 postpone their investment to different degrees until the return rises to a suitable level (Figure 5), and the optimal investment timing for most provinces in China is still the last year. In conclusion, under the current carbon price level, participating in the carbon trading market will reduce the application cost of CCS to some extent but does not make it competitive with RTDPV.
4.2.2 Initial investment subsidy impact
The RTDPV scenario in scenario S3 is consistent with S1. Since the upfront investment cost of CCS retrofitting is high, this scenario assumes it is given a certain initial cost subsidy. It was observed that even when the initial cost is fully covered, the UNPV of CCS retrofitting in each province is still less than zero and the UFV is equal to zero, meaning that both the NPV method and the real option method results recommend against making investments. A certain amount of government upfront investment subsidy can offset part of the CCS costs but has a limited effect on promoting CCS investment.
Figure 6 compares the incentive effects of initial cost subsidies and participation in the carbon market. Since the UFV of the RO method in both S1 and S3 is equal to zero, this scenario is compared from the NPV perspective. It can be seen that both S2 and S3 have a certain magnitude of cost reduction compared with the base scenario S1, and the effect of participating in the carbon market is slightly better than the initial investment cost subsidy at the current carbon price level.
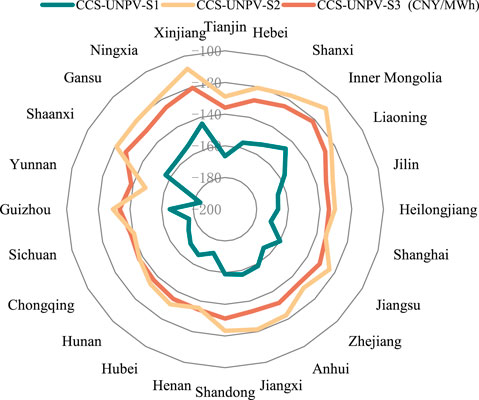
FIGURE 6. CCS retrofitting UNPV for S1, S2, S3.
4.2.3 Impact of FIT subsidy
The RTDPV case for scenario S3, which explores. Investment in a CCS retrofitting with the same FIT subsidy as RTDPV, is consistent with S1. The UNPV of CCS is above 160 CNY/MWh in all provinces, and the UFV ranges from 177 to 225 CNY/MWh, which is significantly better than the result of participation in the carbon market and the initial cost subsidy, As shown in Figure 7.

FIGURE 7. Comparison of CCS and RTDPV investment returns in S1 and S4.
Using both NPV and RO methods, the unit revenue of CCS retrofitting in each province is larger than that of RTDPV, the RO method is more desirable than the NPV method, and the investment timing of each province is more advanced. Optimal investment timings in Figure 3 shows that Tianjin, Shanghai, Jiangsu, Zhejiang, Jiangxi, Shandong, Henan, Chongqing, Sichuan, Guizhou, Ningxia, and Xinjiang can support immediate investment. With sufficient CCS incentives, CCS retrofitting can become more attractive than RTDPV in most provinces.
4.3 Comparison of the impact of combined incentive mechanisms on CCS retrofitting and RTDPV investment decisions
As previously discussed, the effect of a single incentive mechanism can be relatively limited. Subsidies that are too great may impose an enormous financial burden on the government, while low incentives—including the existing carbon market—are insufficient to encourage investment. The following scenarios consider the impact of a combination of two incentive mechanisms on promoting investment decisions. Combination incentives are more effective than a single mechanism in fostering investment in CCS retrofitting, significantly increasing the investment’s value and advancing the investment’s timing.
4.3.1 Synergistic impact of initial investment subsidy and carbon trading market
In S5, the synergistic impact of initial investment subsidies and the carbon market is considered. The RTDPV results are the same as S2, while the UNPV of CCS retrofitting in each province under the NPV method is improved compared with the initial cost subsidy alone (S3). However, investors are still likely to abandon investment. The UFV of each province under the real option method is greater than zero, and investors can choose to invest at this time. However, a total initial cost subsidy does not trigger investors to immediately invest in the project. At the same time, the unit revenue in each province is lower than the RTDPV, see Figure 8, Specifically. In other words, the initial cost subsidy at the current carbon price might convince investors to consider investing in CCS projects rather than abandoning them, but they would tend to delay investment and wait for the carbon price to rise to a suitable level.
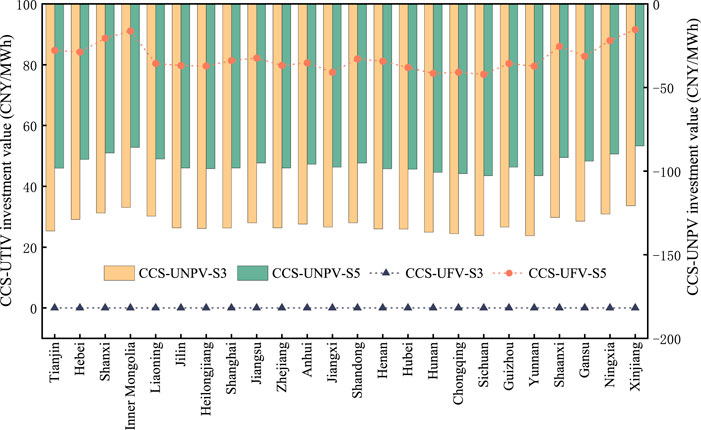
FIGURE 8. Comparison of UNPV and CCS-UFV under S3 and S5.
As mentioned above, the incentive effect of the carbon market depends on the carbon price, and increasing the carbon price is essential for participation in the carbon market. Therefore, this scenario explores a carbon price threshold with total initial investment cost subsidies (i.e., CCS retrofitting benefits for coal-fired power plants are equal to RTDPV benefits, all other things being equal). The critical carbon price is 1.8–2.4 times the current carbon price level (see Figure 9), while the higher carbon critical price allows for a 3–5 years improvement in the investment timing. At this point, most provinces delay investment by five or 6 years (see Figure 3).
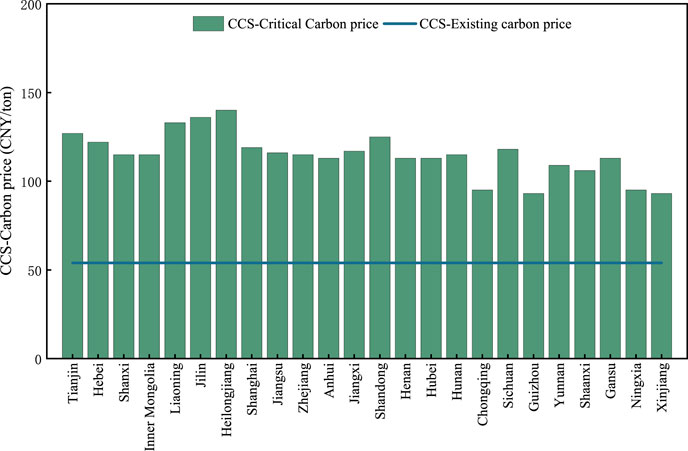
FIGURE 9. Critical carbon price versus existing carbon price.
4.3.2 Synergistic impact of FIT subsidy and carbon market
Scenario S6 considers the synergistic effect of FIT subsidies and the carbon market. The RTDPV results of S6 are the same as in S2. Compared with the single electricity subsidy (S4), the UNPV of each province is above 220 CNY under the NPV method, and the unit revenue of each province and city increases by 45–65 CNY/MWh (see Figure 10). Under NPV and real option methods, the best performing provinces for CCS conversion revenue are Inner Mongolia and Xinjiang, due to their longer generation hours and lower coal prices among the 24 provinces. Under the real option method, there is a significant improvement in the returns of each province compared to the NPV method, and the investment is triggered earlier. The extent to which investment timing is accelerated varies among the provinces (see Figure 3), probably due to the fact that some provinces do not have advantageous operating hours of coal-fired power plants and coal prices.
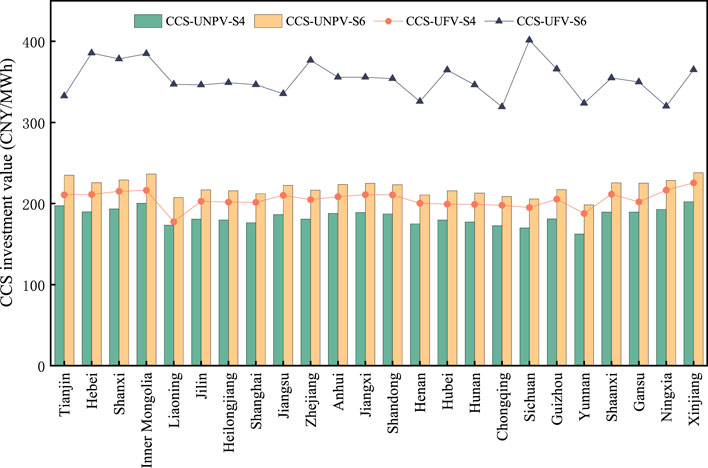
FIGURE 10. CCS retrofitting investment value in S4 and S6.
Figure 11 compares the return per unit of investment between CCS retrofitting and RTDPV. As with the FIT subsidy incentive in isolation, the return on CCS retrofitting is higher in this case than RTDPV for all 24 provinces. As shown in Figure 3, immediate investment is available in most provinces of China.
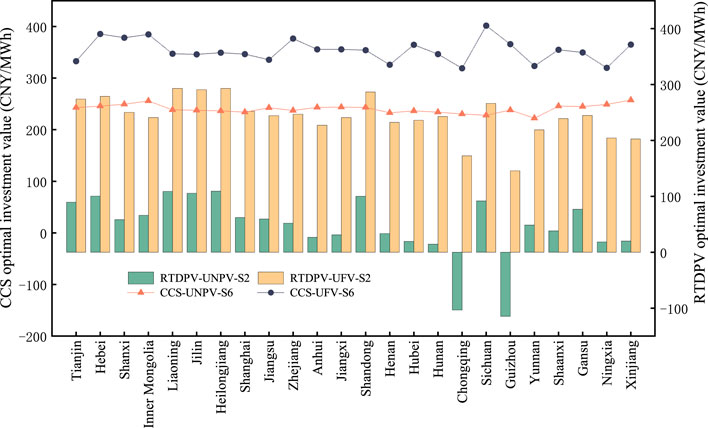
FIGURE 11. Comparison of CCS retrofitting and RTDPV unit investment returns.
It is worth noting how some provinces have sufficient light for RTDPV investment but limited application of CCS technology. For example, the UNPV of RTDPV in Hainan and Qinghai is 130.11 CNY/MWh and 123.74 CNY/MWh, respectively, but geological conditions will limit the deployment of CCS. This phenomenon also shows that regional heterogeneity must be considered when developing CCS and RTDPV installations.
5 Conclusion
To maintain the stability and sustainability of the power supply during the accelerated transformation of China’s energy mix to clean and low-carbon sources, the country’s coal power industry must play a key role. In this regard, the synergy of CCS retrofitting of coal-fired power plants and RTDPV is indispensable. This study evaluates and compares the investment returns and timing of CCS projects and RTDPV in different regions of China based on real option method. The main conclusions are as follows:
• With the low current carbon price lack of incentive policies, CCS retrofitting is at a disadvantage compared to RTDPV, and it is less attractive for coal-fired power plants to undertake carbon emission reduction due to the high cost of CCS application. When CCS does not participate in carbon trading, all provinces and municipalities chose to abandon their investment under both the NPV method and the real option method. With participation in carbon trading, although UNPV is still less than zero, its UFV starts to turn from negative to positive, indicating that the NPV method underestimates the investment value of the project. The project is feasible under the real option method, although all provinces chose to postpone investment to varying degrees and wait for the return to rise to a suitable level. As for RTDPV, due to differences in light resources and electricity prices, ten of the 24 provinces (Anhui, Jiangxi, Henan, Hubei, Hunan, Chongqing, Guizhou, Shaanxi, Ningxia, and Xinjiang) were not suitable for investment under the NPV model; even when incorporating the carbon market, Chongqing and Guizhou were not suitable for investment. Under the real option method, it is not yet possible to achieve immediate investment nationwide. Returns improved in each province but remained low enough that investors would likely postpone their investment to get the optimal investment value.
• By subsidizing the initial investment cost of CCS, this technology becomes attractive for investment under some conditions, but it yielded lower returns than RTDPV. Specifically, in the case of non-participation in the carbon market, either the NPV or the real option method could only partially offset the cost of CCS and could not induce investors to invest in the project. At the current carbon price level, participation in the carbon market is slightly better than the initial investment cost subsidy. In the case of participation in the carbon market, the NPV method would result in no investment. In contrast, the real option method makes investment viable but would not trigger investors to invest immediately. Provinces often would choose to invest in the last year of the investment period.
• If CCS is given the same FIT subsidy as RTDPV development, the outcome is significantly better than that of the carbon market incentive effect and initial investment cost subsidy. Regardless of whether the carbon market is utilized, the unit revenue of CCS retrofitting is better than the current RTDPV level under both the NPV and real option methods, and the real option method is more desirable than the NPV method. Investment timing moves forward in all provinces, with ten provinces (Tianjin, Shanghai, Jiangsu, Zhejiang, Jiangxi, Shandong, Henan, Chongqing, Sichuan, Guizhou, Ningxia, and Xinjiang) reaching immediate investment. Participation in the carbon market can promote earlier investment timing in most provinces across the country, and 16 provinces can invest in CCS retrofitting projects immediately at this time.
6 Recommendations
In conclusion, China’s green, low-carbon technology system for carbon neutrality has not yet been fully established. There is still a large gap between the existing emission reduction technologies and the actual demand for carbon neutrality. On the one hand, renewable energy projects, such as RTDPV, should be developed; on the other hand, the transitional role of CCS in accelerating the low-carbon transition in the coal power industry should be emphasized. Specifically, this paper provides the following recommendations.
First, the government should refine regulations and the policy system to enhance the broad consensus on carbon emission reduction among enterprises and the public. China currently allocates carbon emission quotas from top to bottom, and there is a lax distribution of quotas. It can refer to the carbon quota auction mechanism of EU-ETS to precisely match the needs of enterprises and give full play to the critical role of market mechanisms in addressing climate change.
Second, the synergy effect of CCS retrofitting and RTDPV should be exploited. Referring to RTDPV, the implementation of a subsidy policy provides a guarantee for its large-scale development and highlights the importance of policy incentives for CCS applications at scale. The government can develop a reasonable subsidy policy for CCS decarbonized power generation to support CCS retrofitting projects in suitable provinces with excess power supply and weak light resources that cannot effectively utilize RTDPV, such as Chongqing and Guizhou. In addition, as the primary cost bearer of the CCS chain, the carbon capture sector should be subsidized.
Third, with the establishment of the national carbon trading market, the coverage of the carbon market should be further expanded, and the supporting policies of the national carbon market should be established and improved to promote a steady increase in carbon prices. The International Energy Agency proposes a guideline carbon price for the BRIC countries, including China, of $45 in 2025, $90 in 2030, and $200 in 2050 (International Energy Agency, 2021). To reduce the subsidy pressure for implementing CCS, the government can introduce relevant measures to increase the carbon trading price.
Finally, the cost is a significant constraint for both RTDPV and CCS retrofitting. In recent years, driven by environmental protection policies and a significant decrease in the cost of renewable energy, especially the cost of PV has decreased by nearly 82% between 2010 and 2019 (International Renewable Energy Agency, 2020), which makes RTDPV grid parity possible. According to the International Energy Agency, CCS technology has the potential to significantly reduce costs by improving technology and increasing efficiency. The Boundary Dam and Shand power plants can save approximately 30% of their cost (International Energy Agency, 2020). Thus, China should increase the investment in the Research and Experimental Development of CCS to reduce its cost as soon as possible and accelerate its large-scale application process.
Data availability statement
The original contributions presented in the study are included in the article/supplementary material, further inquiries can be directed to the corresponding author.
Author contributions
CY is responsible for the conception and design of the work, drafting, and overall project leadership and management. YC was responsible for material preparation, data collection and analysis, and additional writing of the paper. LH and QJ analyzed or interpreted the data of the work, published comments on previous versions of the original draft, and optimized the scene analysis.
Funding
This paper was supported by the National Natural Science Foundation of China, grant number 72071058; the National Natural Science Foundation of China, grant number 71771076.
Conflict of interest
The authors declare that the research was conducted in the absence of any commercial or financial relationships that could be construed as a potential conflict of interest.
Publisher’s note
All claims expressed in this article are solely those of the authors and do not necessarily represent those of their affiliated organizations, or those of the publisher, the editors and the reviewers. Any product that may be evaluated in this article, or claim that may be made by its manufacturer, is not guaranteed or endorsed by the publisher.
Abbreviations
CCS, Carbon capture and storage; RTDPV, Distributed photovoltaic; CO2, Carbon dioxide; NPV, Net present value; GW, Gigawatt; FIT, Feed-in tariff; kW, Kilowatt; CO2-EOR, Carbon dioxide enhanced oil recovery; EU-ETS, The European Union Emissions Trading System; O&M, Operation and maintenance; tCO2, Tonne of carbon dioxide; LSMC, Least-squares Monte Carlo; MWh, Megawatt hour; UNPV, Unit net present value per megawatt hour; UFV, Unit total investment value per megawatt hour; BRIC, Brazil, Russia, India and China.
References
Agaton, C. B. (2021). Application of real options in carbon capture and storage literature: Valuation techniques and research hotspots. Sci. Total Environ. 795, 148683. doi:10.1016/j.scitotenv.2021.148683
Akerboom, S., Waldmann, S., Mukherjee, A., Agaton, C., Sanders, M., and Kramer, G. J. (2021). Different this time? The prospects of CCS in The Netherlands in the 2020s. Front. Energy Res. 9, 644796. doi:10.3389/fenrg.2021.644796
Arrow, K. J. (1971). The economic implications of learning by doing. London: Palgrave Macmillan UK, 131–149. doi:10.1007/978-1-349-15430-2_11
Budinis, S., Krevor, S., Mac Dowell, N., Brandon, N., and Hawkes, A. (2018). An assessment of CCS costs, barriers and potential. Energy strategy Rev. 22, 61–81. doi:10.1016/j.esr.2018.08.003
[Dataset] Carbon Emission Acconts & Datasets (2021). China CO2 inventory 1997-2019 (IPCC sectoral emissions). Available at: https://www.ceads.net/data/nation/ (Accessed May 2, 2022).
[Dataset] Central People’s Government of the People’s Republic of China (2020). China’s emissions reduction pledge to inspire global climate action. Available at: http://www.gov.cn/xinwen/2020-10/12/content_5550452.htm (Accessed December 22, 2021).
[Dataset] Central People’s Government of the People’s Republic of China (2021). The proportion of installed coal power capacity fell below 50% for the first time. Available at: http://www.gov.cn/xinwen/2021-02/07/content_5585511.htm (Accessed April 15, 2022).
Chen, H., Wang, C., and Ye, M. (2016). An uncertainty analysis of subsidy for carbon capture and storage (CCS) retrofitting investment in China’s coal power plants using a real-options approach. J. Clean. Prod. 137, 200–212. doi:10.1016/j.jclepro.2016.07.074
[Dataset] China Photovoltaic Industry Association (2021). China PV industry development roadmap. Available at: http://chinapv.org.cn/road_map/927.html (Accessed February 24, 2022).
[Dataset] Chinese Academy of Environmental Planning (2021). China carbon dioxide capture utilization and storage (CCUS) annual report (2021) - China CCUS pathway study. Available at: http://www.caep.org.cn/sy/dqhj/gh/202107/t20210725_851241.shtml (Accessed February 22, 2022).
Duman, A. C., and Güler, Ö. (2020). Economic analysis of grid-connected residential rooftop PV systems in Turkey. Renew. Energy 148, 697–711. doi:10.1016/j.renene.2019.10.157
Eskew, J., Ratledge, M., Wallace, M., Gheewala, S. H., and Rakkwamsuk, P. (2018). An environmental life cycle assessment of rooftop solar in Bangkok, Thailand. Renew. Energy 123, 781–792. doi:10.1016/j.renene.2018.02.045
Fan, J.-L., Shen, S., Xu, M., Yang, Y., Yang, L., and Zhang, X. (2020). Cost-benefit comparison of carbon capture, utilization, and storage retrofitted to different thermal power plants in China based on real options approach. Adv. Clim. Change Res. 11, 415–428. doi:10.1016/j.accre.2020.11.006
Fan, J.-L., Xu, M., Li, F., Yang, L., and Zhang, X. (2018). Carbon capture and storage (CCS) retrofit potential of coal-fired power plants in China: The technology lock-in and cost optimization perspective. Appl. energy 229, 326–334. doi:10.1016/j.apenergy.2018.07.117
Fan, J.-L., Xu, M., Yang, L., and Zhang, X. (2019a). Benefit evaluation of investment in CCS retrofitting of coal-fired power plants and PV power plants in China based on real options. Renew. Sustain. Energy Rev. 115, 109350. doi:10.1016/j.rser.2019.109350
Fan, J.-L., Xu, M., Yang, L., Zhang, X., and Li, F. (2019b). How can carbon capture utilization and storage be incentivized in China? A perspective based on the 45Q tax credit provisions. Energy Policy 132, 1229–1240. doi:10.1016/j.enpol.2019.07.010
Fan, R., and Dong, L. (2018). The dynamic analysis and simulation of government subsidy strategies in low-carbon diffusion considering the behavior of heterogeneous agents. Energy Policy 117, 252–262. doi:10.1016/j.enpol.2017.12.003
Fuss, S., Szolgayova, J., Obersteiner, M., and Gusti, M. (2008). Investment under market and climate policy uncertainty. Appl. Energy 85, 708–721. doi:10.1016/j.apenergy.2008.01.005
[Dataset] Global CCS Institute (2017). Global costs of carbon capture and storage. Available at: https://www.globalccsinstitute.com/resources/publications-reports-research/global-costs-of-carbon-capture-and-storage/ (Accessed April 4, 2022).
Guan, Y., Shan, Y., Huang, Q., Chen, H., Wang, D., and Hubacek, K. (2021). Assessment to China’s recent emission pattern shifts. Earth's. Future 9, e2021EF002241. doi:10.1029/2021EF002241
Han, M., Xiong, J., Wang, S., and Yang, Y. (2020). Chinese photovoltaic poverty alleviation: Geographic distribution, economic benefits and emission mitigation. Energy Policy 144, 111685. doi:10.1016/j.enpol.2020.111685
[Dataset] Inner Mongolia Coal Center (2021). China coal price index. Available at: http://www.gn580.cn/zgdml (Accessed February 3, 2022).
[Dataset] Intercontinental Exchange (2022). EUA futures. Available at: https://www.theice.com/products/197/EUA-Futures/data?marketId=6482028&span=3 (Accessed September 25, 2022).
[Dataset] Intergovernmental Panel on Climate Change (2018). Special report on global warming of 1.5°C. Available at: https://www.ipcc.ch/sr15/ (Accessed May 3, 2022).
[Dataset] International Energy Agency (2021). Net zero by 2050: A roadmap for global energy sector. Available at: https://www.iea.org/reports/net-zero-by-2050 (Accessed March 25, 2022).
[Dataset] International Energy Agency (2020). The role of CCUS in low carbon power generation systems. Available at: https://www.iea.org/reports/the-role-of-ccus-in-low-carbon-power-systems (Accessed February 13, 2022).
[Dataset] International Renewable Energy Agency (2020). Renewable power generation costs in 2019. Available at: https://www.irena.org/publications/2020/Jun/Renewable-Power-Costs-in-2019 (Accessed March 18, 2022).
Karaveli, A. B., Soytas, U., and Akinoglu, B. G. (2015). Comparison of large scale solar PV (photovoltaic) and nuclear power plant investments in an emerging market. Energy 84, 656–665. doi:10.1016/j.energy.2015.03.025
Kim, K., Park, H., and Kim, H. (2017). Real options analysis for renewable energy investment decisions in developing countries. Renew. Sustain. Energy Rev. 75, 918–926. doi:10.1016/j.rser.2016.11.073
Li, H., Li, H., Lu, W., Wang, Z., and Bian, J. (2020). Optimal power flow calculation considering large-scale photovoltaic generation correlation. Front. Energy Res. 8, 590418. doi:10.3389/fenrg.2020.590418
Lilliestam, J., Bielicki, J. M., and Patt, A. G. (2012). Comparing carbon capture and storage (CCS) with concentrating solar power (CSP): Potentials, costs, risks, and barriers. Energy policy 47, 447–455. doi:10.1016/j.enpol.2012.05.020
[Dataset] Ministry of Ecology and Environment of the People’s Republic of China (2020). 2019 annual emission reduction project China regional grid baseline emission factor. Available at: https://www.mee.gov.cn/ywgz/ydqhbh/wsqtkz/202012/t20201229_815386.shtml (Accessed March 4, 2022).
Moon, Y., and Baran, M. (2018). Economic analysis of a residential PV system from the timing perspective: A real option model. Renew. energy 125, 783–795. doi:10.1016/j.renene.2018.02.138
Myers, S. C. (1977). Determinants of corporate borrowing. J. financial Econ. 5, 147–175. doi:10.1016/0304-405X(77)90015-0
[Dataset] National Development and Reform Commission (2022). Implementation plan for promoting the high-quality development of new energy in the new era. Available at: http://www.gov.cn/zhengce/content/2022-05/30/content_5693013.htm (Accessed April 14, 2022).
[Dataset] National Energy Administration (2022). China’s installed capacity of grid-connected photovoltaic power generation exceeded 300 million kilowatts, and distributed development has become a new highlight. Available at: http://www.nea.gov.cn/2022-01/20/c_1310432517.htm (Accessed June 4, 2022).
National Energy Administration (2020). Photovoltaic power generation system efficiency specification. Beijing: China Water Conservancy and Hydropower Press.
Nguyen, S., Peng, W., Sokolowski, P., Alahakoon, D., and Yu, X. (2018). Optimizing rooftop photovoltaic distributed generation with battery storage for peer-to-peer energy trading. Appl. Energy 228, 2567–2580. doi:10.1016/j.apenergy.2018.07.042
Penizzotto, F., Pringles, R., and Olsina, F. (2019). Real options valuation of photovoltaic power investments in existing buildings. Renew. Sustain. Energy Rev. 114, 109308. doi:10.1016/j.rser.2019.109308
Rausser, G., Chebotareva, G., Smutka, L., Strielkowski, W., and Shiryaeva, J. (2022). Future development of renewable energy in Russia: A case of solar power. Front. Energy Res. 2022, 286. doi:10.3389/fenrg.2022.862201
Roussanaly, S., Ouassou, J. A., Anantharaman, R., and Haaf, M. (2020). Impact of uncertainties on the design and cost of CCS from a waste-to-energy plant. Front. Energy Res. 8, 17. doi:10.3389/fenrg.2020.00017
Rubin, E. S., Yeh, S., Antes, M., Berkenpas, M., and Davison, J. (2007). Use of experience curves to estimate the future cost of power plants with CO2 capture. Int. J. Greenh. gas control 1, 188–197. doi:10.1016/S1750-5836(07)00016-3
Safarianzengir, V., Fatahi, A., and Amiri Doumari, S. (2022). Feasibility and zoning of establishing solar power stations to produce sustainable energy from the environment in northwestern Iran. Front. Energy Res. 2022, 67. doi:10.3389/fenrg.2022.819577
Seto, K. C., Davis, S. J., Mitchell, R. B., Stokes, E. C., Unruh, G., Ürge-Vorsatz, D., et al. (2016). Carbon lock-in: Types, causes, and policy implications. Annu. Rev. Environ. Resour. 41, 425–452. doi:10.1146/annurev-environ-110615-085934
Shan, Y., Guan, D., Zheng, H., Ou, J., Li, Y., Meng, J., et al. (2018). China CO2 emission accounts 1997–2015. Sci. Data 5, 170201–170214. doi:10.1038/sdata.2017.201
Shan, Y., Huang, Q., Guan, D., and Hubacek, K. (2020). China CO2 emission accounts 2016–2017. Sci. Data 7, 54–59. doi:10.1038/s41597-020-0393-y
[Dataset] Shanghai Environment and Energy Exchange (2021). National carbon market monthly transaction data 20211201-20211231. Available at: https://www.cneeex.com/c/2021-12-31/491810.shtml (Accessed August 21, 2022).
Supekar, S. D., and Skerlos, S. J. (2015). Reassessing the efficiency penalty from carbon capture in coal-fired power plants. Environ. Sci. Technol. 49, 12576–12584. doi:10.1021/acs.est.5b03052
Wang, M., Mao, X., Gao, Y., and He, F. (2018). Potential of carbon emission reduction and financial feasibility of urban rooftop photovoltaic power generation in Beijing. J. Clean. Prod. 203, 1119–1131. doi:10.1016/j.jclepro.2018.08.350
Wang, X., and Du, L. (2016). Study on carbon capture and storage (CCS) investment decision-making based on real options for China’s coal-fired power plants. J. Clean. Prod. 112, 4123–4131. doi:10.1016/j.jclepro.2015.07.112
Wright, T. P. (1936). Factors affecting the cost of airplanes. J. aeronautical Sci. 3, 122–128. doi:10.2514/8.155
Xian, Y., Wang, K., Wei, Y. M., and Huang, Z. (2020). Opportunity and marginal abatement cost savings from China’s pilot carbon emissions permit trading system: Simulating evidence from the industrial sectors. J. Environ. Manag. 271, 110975. doi:10.1016/j.jenvman.2020.110975
Xin-gang, Z., and Yi-min, X. (2019). The economic performance of industrial and commercial rooftop photovoltaic in China. Energy 187, 115961. doi:10.1016/j.energy.2019.115961
Xin-gang, Z., and Zhen, W. (2019). Technology, cost, economic performance of distributed photovoltaic industry in China. Renew. Sustain. Energy Rev. 110, 53–64. doi:10.1016/j.rser.2019.04.061
Yang, F. F., and Zhao, X. G. (2018). Policies and economic efficiency of China’s distributed photovoltaic and energy storage industry. Energy 154, 221–230. doi:10.1016/j.energy.2018.04.135
Yang, L., Xu, M., Yang, Y., Fan, J., and Zhang, X. (2019). Comparison of subsidy schemes for carbon capture utilization and storage (CCUS) investment based on real option approach: Evidence from China. Appl. Energy 255, 113828. doi:10.1016/j.apenergy.2019.113828
Zhang, M., Zhang, C., Liu, L., and Zhou, D. (2020). Is it time to launch grid parity in the Chinese solar photovoltaic industry? Evidence from 335 cities. Energy Policy 147, 111733. doi:10.1016/j.enpol.2020.111733
Zhang, M., Zhou, D., and Zhou, P. (2014a). A real option model for renewable energy policy evaluation with application to solar pv power generation in China. Renew. Sustain. Energy Rev. 40, 944–955. doi:10.1016/j.rser.2014.08.021
Zhang, M., Zhou, P., and Zhou, D. (2016). A real options model for renewable energy investment with application to solar photovoltaic power generation in China. Energy Econ. 59, 213–226. doi:10.1016/j.eneco.2016.07.028
Zhang, X., Wang, X., Chen, J., Xie, X., Wang, K., and Wei, Y. (2014b). A novel modeling based real option approach for CCS investment evaluation under multiple uncertainties. Appl. Energy 113, 1059–1067. doi:10.1016/j.apenergy.2013.08.047
Zheng, H., Song, M., and Shen, Z. (2021). The evolution of renewable energy and its impact on carbon reduction in China. Energy 237, 121639. doi:10.1016/j.energy.2021.121639
Keywords: CCS retrofitting, rooftop distributed photovoltaic, real option approach, low-carbon technology, renewable energy
Citation: Yang C, Cui Y, He L and Jiang Q (2022) Evaluation of investment strategies for rooftop distributed PV and CCS technologies in China under multiple scenarios. Front. Energy Res. 10:1033365. doi: 10.3389/fenrg.2022.1033365
Received: 31 August 2022; Accepted: 24 October 2022;
Published: 09 November 2022.
Edited by:
Aliya Isiksal, Near East University, CyprusReviewed by:
Helena Martín, Universitat Politecnica de Catalunya, SpainElisa Marrasso, University of Sannio, Italy
Copyright © 2022 Yang, Cui, He and Jiang. This is an open-access article distributed under the terms of the Creative Commons Attribution License (CC BY). The use, distribution or reproduction in other forums is permitted, provided the original author(s) and the copyright owner(s) are credited and that the original publication in this journal is cited, in accordance with accepted academic practice. No use, distribution or reproduction is permitted which does not comply with these terms.
*Correspondence: Changhui Yang, eWFuZ2NoYW5naHVpQGhmdXQuZWR1LmNu