
94% of researchers rate our articles as excellent or good
Learn more about the work of our research integrity team to safeguard the quality of each article we publish.
Find out more
ORIGINAL RESEARCH article
Front. Energy Res., 24 January 2023
Sec. Smart Grids
Volume 10 - 2022 | https://doi.org/10.3389/fenrg.2022.1033066
This article is part of the Research TopicInnovative Methods and Techniques in New Electric Power SystemsView all 17 articles
 Hongtao Mao1Dong Nie1Xi Chen1Yanan Cai1Jie Zhao1Xuzheng Zhang2Haoyu Yu2Wanli Ma2
 Zepeng Lv2
 Jun Zhou2*
It is inevitable that renewable energy consumption will increase as installed capacity continues to increase, primarily wind and photovoltaic power generation. Power to Gas (P2G) technology can store electrical energy in the form of chemical energy on a large scale. Reversible solid oxide cell (RSOC) has a very high conversion efficiency in both electrolytic gas production and fuel cell power generation compared with traditional electricity-to-gas devices. For the future integrated energy system, Reversible solid oxide cells are expected to play a significant role in integrating power generation and energy storage. This work proposes a new integrated energy system based on Reversible solid oxide cell for photovoltaic (PV) consumption. The Integrated Electricity-Gas System (IEGS) considers the two modes of electrolysis and power generation of Reversible solid oxide cell in the model. The model takes the minimum running cost as the objective function to linearize part of the model to generate a mixed integer linearization problem and solve it in GAMS. The case study shows that wind power is maximized, and the gas mixture can be transported in natural gas pipelines, improving the economics and stability of Integrated Electricity-Gas System. This work not only can reduce the operating cost of the system but also increase the high penetration of photovoltaic power generation. A quantitative assessment of the impact of hydrogen injection ratio and renewable energy penetration was also carried out.
The rapid and disorderly development of renewable energy has raised some related issues (Zhang et al., 2022; Zhao S, et al., 2022). First of all, renewable energy power generation is mainly wind power generation and photovoltaic power generation, which naturally have the characteristics of intermittent fluctuation. The integration of renewable energy into the grid is a huge challenge for the power network that requires stability and security (Denholm and Hand, 2011; Brouwer et al., 2014; Ahmed and Khalid, 2019). Secondly, most of the areas rich in renewable energy are located at the terminal stations of the power grid. Although the installed capacity is large, it cannot be fully absorbed on site. Due to the rapid and unbalanced development of renewable energy and regional environmental impacts, the surrounding facilities of some large-scale new energy power plants that have been built are not perfect, which may easily lead to waste of renewable resources. A promising solution to these problems is to convert it into other energy for consumption (Fang et al., 2018; Wang et al., 2019; Martínez Ceseña et al., 2020). Power to gas (P2G) technology produces hydrogen by hydrolysis of water using renewable energy power, which can supply power during peak power demand of the grid, and store surplus energy when renewable energy power generation is more than power demand. Paul C. Okonkwo has studied Proton exchange membrane fuel cells (PEMFCs), which converted power to gas through hydrolysis of water (Okonkwo et al., 2021a; Okonkwo et al., 2021b; Okonkwo and Otor, 2021; Okonkwo et al., 2022). Reversible Solid Oxide Cells (RSOC) can achieve an energy conversion efficiency of more than 85% for electrolysis mode, which is far above other methods in forms of energy storage, and have the advantages of bidirectional conversion, low preparation cost, and easy realization of cogeneration (Zhang et al., 2010; Laguna-Bercero, 2012). RSOC stands out among many P2G processes (Mogensen et al., 2019a). The RSOC can consist of the integrated operation of both positive and negative modes of co-electrolysis and co-generation (Luo et al., 2017). In addition to producing hydrogen, RSOC can also convert hydrogen into part of synthetic natural gas (SNG) through co-electrolysis. The produced hydrogen is mixed with natural gas and injected into the natural gas pipeline to form Hydrogen-Enriched Compressed Natural Gas (HCNG). Current experimental and simulation studies have demonstrated that it is feasible to inject hydrogen in the range of 10%–20% without changing the natural gas pipeline and natural gas equipment used by users (Abeysekera et al., 2016; Lapo et al., 2021; Zhao et al., 2021). Such a high proportion of hydrogen injection enables the natural gas network to store large amounts of renewable energy. Through P2G technology, the natural gas network and the power network are coupled, which greatly improves the flexibility of the power system and promotes the ability of the entire system to absorb renewable energy, such as photovoltaic power generation.
The operation mode of the electric P2G part of the integrated energy includes the injection and utilization of hydrogen (Schiebahn et al., 2015; Manuel et al., 2016). Aiming at the difficult problem of transmission of a large number of wind power equipment installed in different regions to the demand center, the literature (Qadrdan et al., 2015) studied an operation optimization model of the combined natural gas and power network in the United Kingdom. Reference (Stephen and Pierluigi, 2015a) considers the amount of hydrogen that can be mixed with natural gas under different natural gas network conditions and develops a two-stage optimization method for integrated power and natural gas networks. The impact of P2G technology on natural gas prices and seasonal gas storage utilization was assessed. Reference (Gao et al., 2018) linearized the non-linear electric-gas hybrid integrated energy system model to construct an integrated energy system model with linear power flow distribution characteristics. Under the condition of satisfying the demand for electric load and heat load, the economical and reliable indicators of the system are analyzed, and the economic benefits of P2G technology absorbing wind power are evaluated.
RSOC has become more and more popular due to its high energy conversion efficiency in both hydrogen production and cogeneration (Singhal, 2012; Barelli et al., 2017). RSOC stacks can not only be used as distributed power generation devices but also can be grouped and integrated into large-scale stationary power generation/P2G power plants. In the integrated energy system, it is possible to switch freely between working modes, making the use and storage of hydrogen more flexible. In recent research work, solid oxide cells (SOFCs) have been thermodynamically modeled. Several studies have provided insight into the dynamic performance of the co-electrolysis/generation process (Becker et al., 2012; Foit et al., 2017; Yu et al., 2017). In addition, the electrochemical performance and durability of RSOC were studied, and the internal electrolytic reduction process was analyzed in detail (Azra et al., 2005; Mogensen et al., 2019b). RSOC-based energy systems have also been extensively studied. Previous work modeled fuel cells in microgrid-scale analysis but did not consider the co-electrolysis process. In the modeling of energy systems with power-to-gas relationships, the research mainly focuses on the planning and operation of networks. Fuel cells are generally used as devices with fixed energy conversion efficiency, and P2G technology is generally directly modeled as input/output components (Stephen and Pierluigi, 2015b; Haifei and Yibo, 2018; Luo et al., 2018).
In this work, a new type of RSOC electricity-gas integrated energy system hub station is constructed, which is able to inject hydrogen produced by electrolysis into the existing natural gas network for storage of renewable energy and utilization of mixed gas. The modes of co-electrolysis and power generation are considered in the RSOC modeling. The time start-up cost of RSOC is also considered. Combining the DC power flow model with the gas power flow model realizes the network optimization of the electrical integrated energy system. A mixed integer linear programming problem can be obtained by linearizing the Weymouth gas flow function incrementally. In terms of case studies, the above model is tested using an improved RTS-24 busbar grid combined with a 20-node natural gas network. The benefits and impacts of H2 injection, storage and utilization and natural gas blending throughout the natural gas pipeline are quantitatively analyzed. The effects of different renewable energy levels and H2 injection limitations on integrated energy systems with P2G were investigated. The research results show that RSOC combined with P2G and H2/SNG injection can increase the consumption of new energy through the energy system, and improve economic and environmental benefits.
The RSOC of integrated electricity-gas energy system studied in this work aims to provide multiple energy carriers such as electricity, natural gas, and hydrogen and their mixtures on the basis of the transmission network, and has a considerable renewable penetration rate. The advantage of this system is that it reduces the capacity of the hydrogen storage facility and saves the transportation losses of compressed hydrogen. As shown in Figure 1, RSOC stacks are considered multi-stackable and can be grouped into large stationary power plants. RSOC system consists of SOEC part and methanation part, which are combined in one reactor with different temperature gradient zones (Zhou et al., 2020). When the photovoltaic power generation is insufficient, the RSOC will operate in fuel cell mode and provide power together with a conventional heat set and a gas turbine (GT). During sufficient PV availability, the RSOC will operate in electrolyser mode, generating H2 with SNG that can be injected, stored and utilized, and passed through the storage unit and NG network. The injected H2 can be mixed in the NG pipeline and sent to the downstream natural gas terminal. The mixed gas can be utilized by traditional gas-consuming units such as gas turbines and household stoves, as long as the mixed hydrogen does not exceed a safe mixing percentage. The mathematical model of the energy system includes a power network model and a gas pipeline network model that injects a certain proportion of hydrogen mixed with natural gas.
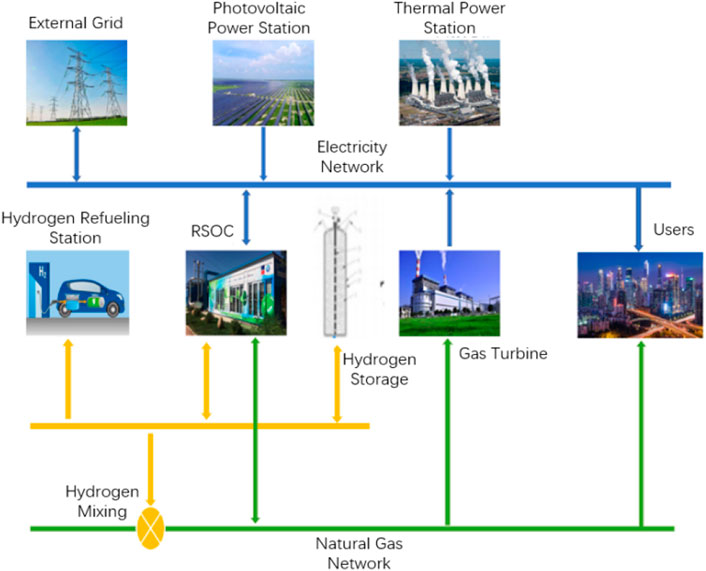
FIGURE 1. The IEGS including RSOC and H2 injection.
The goal of IEGS is to minimize the overall operating cost while meeting the user’s electricity and gas needs. Its objective function is shown in Eq. 1. The first item represents the power generation cost of the generator set; the second item is the natural gas cost provided by the natural gas source; the third item is the photovoltaic curtailment cost. The fourth item is the cost of power abandonment.
where
The RSOC station model proposed in this work adopts the method of lumped functions and considers several properties of RSOC in the hour time frame. Part-load performance of power generation and co-electrolysis, operating schedule for RSOC, and time-varying start-up costs are calculated as mixed integer linear programming (MILP). Fitted curves for the part-load performance of power generation and co-electrolysis at steady-state RSOC are given in Figure 2. Since the C=O bond is not easily broken, the co-electrolysis efficiency decreases with the increase of the volume fraction of the prepared SNG. Figure 2B depicts the operating curves for 15% (mol) H2 and 100% (mol) H2. Part-load performance can be expressed as a non-linear function in Eqs 2, 3. It is assumed that the effect of the production fraction of SNG on the co-electrolysis efficiency is linear, that is, a coefficient
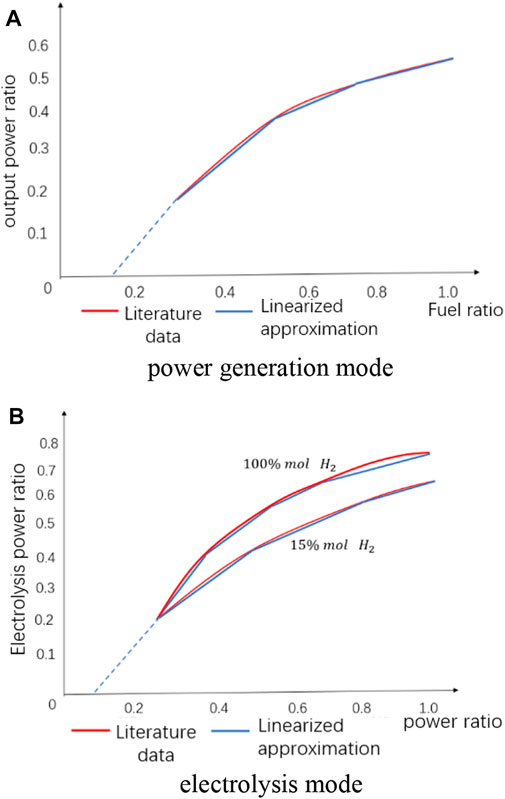
FIGURE 2. Linearization of the characteristic curve of RSOC during steady-state operation. (A) power generation mode, (B) electrolysis mode.
In the above formula, the subscript r represents each RSOC.
RSOC is limited by physical conditions and cannot be started and stopped frequently. The device needs to consider the start and stop time constraints, as represented by Eqs 9, 10.
where
The response of the SOFC is relatively slow when it switches from one thermal equilibrium state to another, so it is necessary to consider its ramping power when the solid oxide fuel cell works. The relationship between the minimum operating power and the rise/fall power is determined by Eqs 15, 16.
As the operating hub of the entire integrated energy system, the RSOC’s start-up and shutdown costs cannot be ignored. As a thermal unit, the start-up cost of an RSOC is considerable. A 1 kWh SOC stack requires approximately 1.3 kWh of energy to cold start (Peksen, 2018). In an energy system, the RSOC can be taken offline for a short period of time and then connected to the grid before it is fully cooled, so that the start-up cost of the RSOC is much lower than when it is fully cooled. The start-up cost of the RSOC is measured by the input gas energy and depends on how long the RSOC is offline before start-up. A typical time-dependent start-up cost function can be found in (Carrion and Arroyo, 2006). The start-up cost is discretized, as shown in Figure 3 and Eqs 17, 18.

FIGURE 3. The relationship between startup cost and offline time.
Among them,
The integrated energy system adopts the transmission network and adopts the DC power flow transmission model. Equations 19–23 represent the constraints of the transmission network.
In the formula,
Gas network constraints include pressure boundary constraints and gas flow equilibrium constraints. For a pipeline node, the gas coming in from the node mainly comes from the terminal gas supply, storage facilities, gas supply from pipelines (transmitted from other nodes), and hydrogen produced by P2G, and the gas going out mainly goes to another pipeline or is consumed by utilization. For network optimization, the volume of injected H2 is converted to the volume of natural gas. Equations 24–26 further constrain the gas source output and gas flow.
Among them,
Linearize the Weymouth formula in order to make the entire optimization system a mixed integer linear programming model. In the Weymouth formula, it can be linearized by the incremental linearization technique mentioned in the previous section.
In order to ensure a safe mixing ratio of the hydrogen mixture, the limit of the mixture of hydrogen and natural gas must be limited. The risks and hazards of mixing high proportions of hydrogen with natural gas have been evaluated in many projects (Azra et al., 2005). In this paper, the mixing constraint of H2 can be expressed as:
The
As shown in Figure 4, the tested electric-gas integrated energy system network consists of a 20-node gas system and a modified IEEE RTS-24-bus power system. In the following example, we demonstrate the behavior of the proposed model during hourly optimization of the day. There are three photovoltaic power plants on Lines 1, 19 and 21 with capacities of 750, 1,000, and 1,250 MW respectively. When the sunlight is sufficient during the day, the excess photovoltaic power generation of the power system can be used by the reversible solid oxide fuel cell to participate in the P2G process. RSOC1, RSOC2, RSOC3, and RSOC4 are installed on bus bars 1, 2, 16 and 22 with capacities of 152, 152, 155, and 300 MW respectively. The technical data of RSOC refer to literature (Peksen, 2018; Mogensen et al., 2019b), which are uniformly adjusted to all RSOC units. The performance of power generation and co-electrolysis is shown in Figure 2. The power generation efficiency of each fixed RSOC is 52%, and the electrolysis efficiency of pure H2 is 76%. The maximum gas production is 85%, and the total electrolysis efficiency is 69%. Start-up fees vary over time, as shown in Figure 3. The electricity demand data, natural gas demand data, and photovoltaic power generation forecast data are shown in Figure 5. User natural gas demand is measured by the volume of natural gas, which adds up to 36.4 × 10⁶ SCM per day. The rest of the system data can be obtained from literature [38].
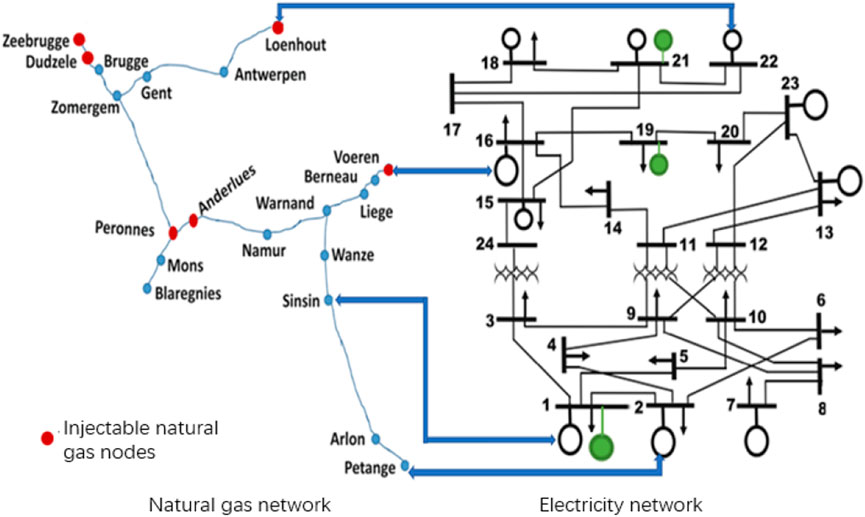
FIGURE 4. The IEGS network test system.
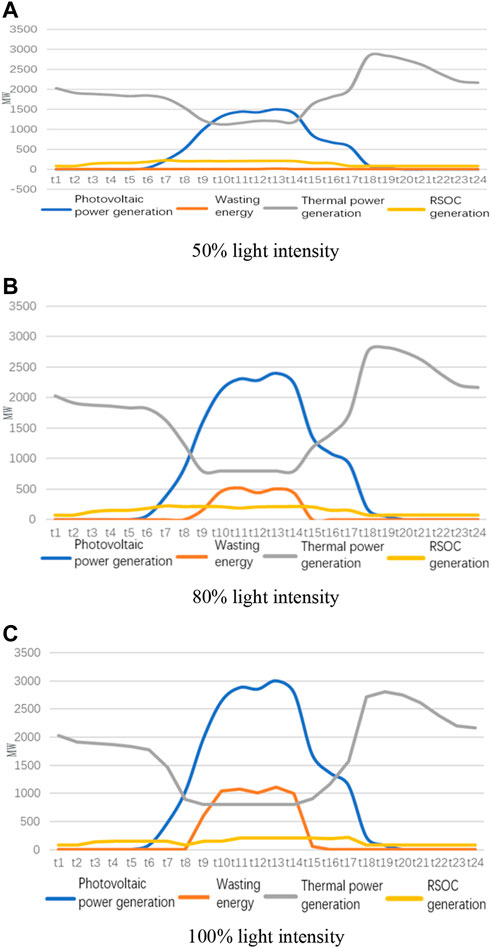
FIGURE 5. Scheduling results for hydrogen injection with a maximum concentration of 20%. (A) 50% light intensity, (B) 80% light intensity, (C) 100% light intensity.
Because photovoltaic power plants fluctuate greatly on a daily basis, they have been chosen as the renewable energy source of this integrated energy system. This indicates a system’s ability to absorb renewable energy more clearly in a fluctuating renewable energy environment. In order to evaluate the impact of different levels of renewable energy and different hydrogen injection limitations on the established integrated energy system, three different light levels were used: 1) low light (50%) light intensity, 2) medium light (80%) light intensity, 3) strong light (100%) light intensity, three hydrogen injection limits: 1) 5% maximum hydrogen injection concentration; 2) 20% maximum hydrogen injection concentration; 3) 0% hydrogen injection concentration. In order to operate the system at different light intensities, the system will increase/decrease the input predicted photovoltaic power generation power for each time period, while the light intensity changes hourly way does not change. In order to reflect the changes in the system when the hydrogen injection limit values are different, the injection percentage parameter MI in Eq. 33 for the maximum hydrogen injection concentration is adjusted to adjust the maximum hydrogen injection concentration that can be safely injected into the natural gas pipeline.
Figure 5 shows the scheduling results for a maximum H2 injection concentration of 20%. We can observe that as light intensity increases, fossil fuel power generation decreases, and electrolysis power increases. When the light intensity increases to 80%, the power generation of fossil fuels is lower at the time of t9–t14. This is because the light intensity at noon is large, the power supplied to the grid is sufficient, and a part can be used for electricity to gas conversion. When the light intensity is 100%, the power generation of fossil fuels and the power of electricity to gas does not change greatly, which is caused by the power limitation of fuel cell electricity to gas and the limitation of the maximum hydrogen concentration. The electricity-to-gas process can still generate fossil fuel power at night, even when there is no light. This is because the lines are congested, and in order to balance supply and demand, part of the electricity is converted into natural gas or hydrogen.
The operating state of the RSOC is shown in Figure 6 and Table 1. As light intensity increases, the P2G process’s operating power increases. At 50% light intensity, RSOC1 and RSOC4 operate in electrolysis mode at noon, and the rest of the time is to provide power to the power system. The start-up costs for RSOC1, RSOC2 and RSOC4 are 183, 206, and 408 MWh, respectively, because PV generation is not sufficient to maintain the minimum P2G operating power of these units. At 80% light intensity, all RSOCs can operate in electrolysis and power generation modes, except for all-day RSOC2 in power generation mode. At 100% light intensity, all RSOC will participate in the electrolysis and power generation process. Under 50% light intensity, although the efficiency of converting electricity to natural gas is relatively low, the gas production is still considerable. SNG production balances hydrogen and natural gas mixing ratios. The production of electricity to natural gas and hydrogen increased continuously with the increase of light intensity, but the increase was not obvious at more than 80% light intensity. To integrate more unconsumed photovoltaic power generation, more natural gas needs to be mixed with hydrogen injection pipelines. In addition, due to the limitation of the transmission capacity of the circuit line, when the light intensity is relatively high, a part of the renewable energy cannot be converted into hydrogen and natural gas in time through the RSOC for storage.
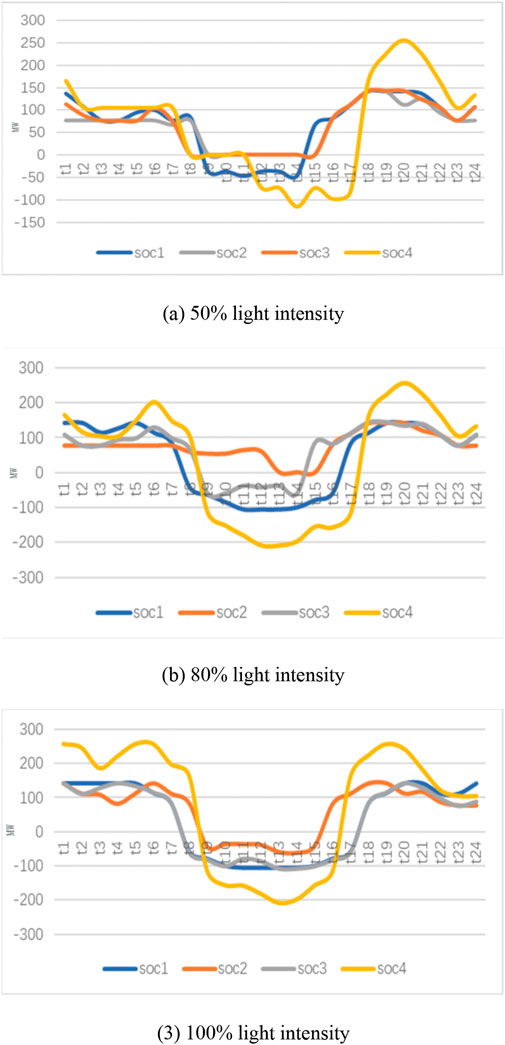
FIGURE 6. The situation of each RSOC electrolysis and power generation. (A) 50% light intensity, (B) 80% light intensity, (C) 100% light intensity.
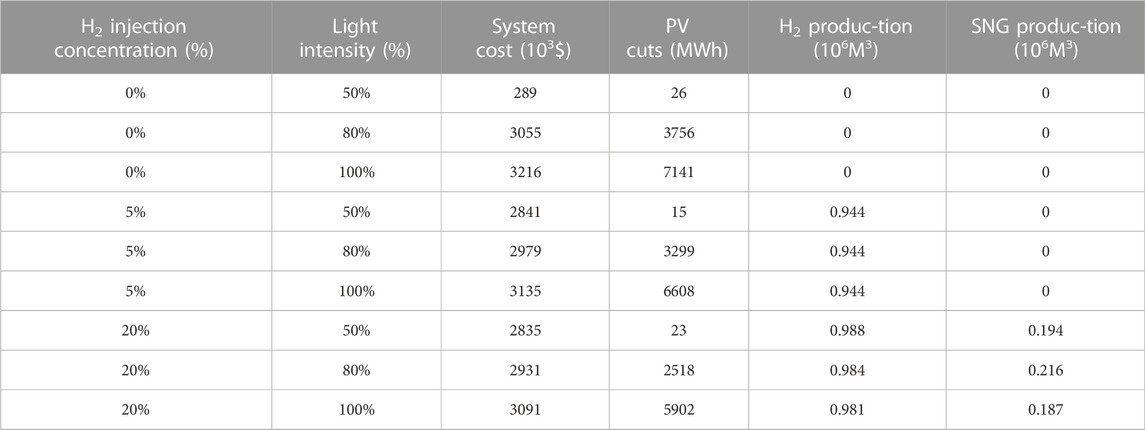
TABLE 1. Operating results of the system under different hydrogen doping concentrations and light intensities.
Under the framework of energy dispatch, the benefit of mixing different concentrations of hydrogen 0%, 5% and 20% maximum hydrogen injection concentration scenarios is discussed. Among them, the total optimal cost includes source gas cost, photovoltaic reduction penalty, and load reduction.
It can be concluded from Table 2 that when the highest hydrogen doping concentration is 20%, the system cost and photovoltaic reduction are relatively reduced, while the production of hydrogen and natural gas increases correspondingly. In spite of this, the cost of the system did not decrease significantly after the light intensity gradually increased. This is because when calculating the cost of the system, its light penalty is taken into account. The cost of the system will increase significantly when the light intensity is high, and the load demand is low. It is found that when the highest hydrogen doping concentration is 5%, the natural gas production is 0 when the highest hydrogen doping concentration is 20%. When the highest hydrogen doping concentration is 20%, the system will generate natural gas, which reduces the supplement of external natural gas and reduces the cost. The intake of hydrogen gas is higher.
In this work, we presented a power-to-gas integrated energy system based on RSOC in order to promote the development of multi-energy complementary systems. By dividing the electricity-to-gas process in the RSOC into electricity-to-hydrogen and electricity-to-natural gas, we investigated the system characteristics and the time-varying law of start-up costs under different RSOC operating modes (electrolysis and power generation). Based on the DC power flow power system model and the linearized gas pipeline model, the optimal scheduling problem of the integrated energy system is established. In addition, we also evaluated the amount of energy generated from renewable sources, such as photovoltaics, and the effect of the maximum concentration of hydrogen injection on the energy system. This work also quantified the economic benefits of power-to-gas in renewable energy integration. With the continuous improvement and progress of electricity-to-gas technology, reversible solid oxide fuel cells may ultimately contribute significantly to carbon neutrality.
The original contributions presented in the study are included in the article/Supplementary Material, further inquiries can be directed to the corresponding author.
All authors listed have made a substantial, direct, and intellectual contribution to the work and approved it for publication.
This work was supported by State Key Laboratory of Electrical Insulation and Power Equipment (EIPE22314).
Authors HM, DN, XC, YC, and JZ were employed by Baoding Power Supply Company.
The remaining authors declare that the research was conducted in the absence of any commercial or financial relationships that could be construed as a potential conflict of interest.
All claims expressed in this article are solely those of the authors and do not necessarily represent those of their affiliated organizations, or those of the publisher, the editors and the reviewers. Any product that may be evaluated in this article, or claim that may be made by its manufacturer, is not guaranteed or endorsed by the publisher.
Abeysekera, M., Wu, J., Jenkins, N., and Rees, M. (2016). Steady state analysis of gas networks with distributed injection of alternative gas. Appl. Energy 164 (15), 991–1002. doi:10.1016/j.apenergy.2015.05.099
Ahmed, A., and Khalid, M. (2019). A review on the selected applications of forecasting models in renewable power systems. Renew. Sustain. Energy Rev. 100, 9–21. doi:10.1016/j.rser.2018.09.046
Azra, S., Miriam, K., Tord, T., and Assadi, M. (2005). Steady state and transient thermal stress analysis in planar solid oxide fuel cells. J. Power Sources 145 (2), 463–469. doi:10.1016/j.jpowsour.2004.11.073
Barelli, L., Bidini, G., Cinti, G., and Ottaviano, A. (2017). Study of SOFC-SOE transition on a RSOFC stack. Int. J. Hydrogen Energy 42 (41), 26037–26047. doi:10.1016/j.ijhydene.2017.08.159
Becker, W. L., Braun, R. J., Penev, M., and Melaina, M. (2012). Production of Fischer–Tropsch liquid fuels from high temperature solid oxide co-electrolysis units. Energy 47, 99–115. doi:10.1016/j.energy.2012.08.047
Brouwer, A. S., Broek, M., Seebregts, A., and Faaij, A. (2014). Impacts of large-scale Intermittent Renewable Energy Sources on electricity systems, and how these can be modeled. Renew. Sustain. Energy Rev. 33, 443–466. doi:10.1016/j.rser.2014.01.076
Carrion, M., and Arroyo, J. M. (2006). A computationally efficient mixed-integer linear formulation for the thermal unit commitment problem. IEEE Trans. Power Syst. 21 (3), 1371–1378. doi:10.1109/tpwrs.2006.876672
Denholm, P., and Hand, M. (2011). Grid flexibility and storage required to achieve very high penetration of variable renewable electricity. Energy Policy 39 (3), 1817–1830. doi:10.1016/j.enpol.2011.01.019
Fang, J., Zeng, Q., Ai, X., Chen, Z., and Wen, J. (2018). Dynamic optimal energy flow in the integrated natural gas and electrical power systems. IEEE Trans. Sustain. Energy 9 (1), 188–198. doi:10.1109/tste.2017.2717600
Foit, S. R., Vinke, I. C., De, L. G., and Eichel, R. A., (2017). Power to syngas an enabling technology for the transition of the energy system[J]. Energy Storage Convers. 56 (20), 5488–5498.doi:10.1002/anie.201607552
Gao, Y., Wang, P., Xue, Y., Wen, F., Zhang, L., Sun, K., et al. (2018). Collaborative planning of integrated electricity-gas energy systems considering demand side management[J]. Autom. Electr. Power Syst. 42 (13), 3–11. doi:10.7500/AEPS20180223002
Haifei, Z., and Yibo, W. (2018). Distributed optimal energy flow of electricity-gas integrated energy system considering P2G[J]. Electr. Meas. Instrum. 55 (21), 61–67.doi:10.1109/TPWRS.2019.2929685
Laguna-Bercero, M. A. (2012). Recent advances in high temperature electrolysis using solid oxide fuel cells: A review. J. Power Sources 203, 4–16. doi:10.1016/j.jpowsour.2011.12.019
Lapo, C., Gabriele, G., Dominique, A., and Carcasci, C. (2021). Steady-state analysis of a natural gas distribution network with hydrogen injection to absorb excess renewable electricity. Int. J. Hydrogen Energy 46 (50), 25562–25577. doi:10.1016/j.ijhydene.2021.05.100
Li, H. L., and Yu, C. S. (1999). A global optimization method for nonconvex separable programming problems. Eur. J. Operational Res. 117 (2), 275–292. doi:10.1016/s0377-2217(98)00243-4
Luo, Y., Shi, Y, Zheng, Y., and Cai, N. (2017). Reversible solid oxide fuel cell for natural gas/renewable hybrid power generation systems. J. Power Sources 340, 60–70. doi:10.1016/j.jpowsour.2016.11.057
Luo, Y., Wu, X., Shi, Y., Ghoniem, A. F., and Cai, N. (2018). Exergy analysis of an integrated solid oxide electrolysis cell-methanation reactor for renewable energy storage. Appl. Energy 215, 371–383. doi:10.1016/j.apenergy.2018.02.022
Manuel, G., Jonathan, L., Friedemann, M., McDaniel Koch, A., Graf, F., Bajohr, S., et al. (2016). Renewable power-to-gas: A technological and economic review. Renew. Energy 85, 1371–1390. doi:10.1016/j.renene.2015.07.066
Martínez Ceseña, E. A., Loukarakis, E., Good, N., and Mancarella, P. (2020). Integrated electricity– heat–gas systems: Techno–economic modeling, optimization, and application to multienergy districts. Proc. IEEE 108 (9), 1392–1410. doi:10.1109/jproc.2020.2989382
Mogensen, M. B., Chen, M., Frandsen, H. L., Graves, C., Hansen, J. B., Hansen, K. V., et al. (2019). Reversible solid-oxide cells for clean and sustainable energy. Clean. Energy 3 (3), 175–201. doi:10.1093/ce/zkz023
Mogensen, M. B., Chen, M., Frandsen, H. L., Graves, C., Hansen, J. B., Hansen, K. V., et al. (2019). Reversible solid-oxide cells for clean and sustainable energy. Clean. Energy 3 (3), 175–201. doi:10.1093/ce/zkz023
Okonkwo, P. C., Belgacem, I. B., Emori, W., and Uzoma, P. C. (2021). Nafion degradation mechanisms in proton exchange membrane fuel cell (pemfc) system: A review. Int. J. hydrogen energy 46 (55), 27956–27973. doi:10.1016/j.ijhydene.2021.06.032
Okonkwo, P. C., Emori, W., Uzoma, P. C., Mansir, I. B., Radwan, A. B., Ige, O. O., et al. (2022). A review of bipolar plates materials and graphene coating degradation mechanism in proton exchange membrane fuel cell. Int. J. Energy Res. 46 (4), 3766–3781. doi:10.1002/er.7428
Okonkwo, P. C., Ige, O. O., Uzoma, P. C., Emori, W., Benamor, A., et al. (2021). Platinum degradation mechanisms in proton exchange membrane fuel cell (pemfc) system: A review. Int. J. Hydrogen Energy 46 (29), 15850–15865. doi:10.1016/j.ijhydene.2021.02.078
Okonkwo, P. C., and Otor, C. (2021). A review of gas diffusion layer properties and water management in proton exchange membrane fuel cell system. Int. J. Energy Res. 45 (3), 3780–3800. doi:10.1002/er.6227
Peksen, M. (2018). Safe heating-up of a full scale SOFC system using 3D multiphysics modelling optimisation. Int. J. Hydrogen Energy 43 (1), 354–362. doi:10.1016/j.ijhydene.2017.11.026
Qadrdan, M., Abeysekera, M., Chaudry, M., Wu, J., and Jenkins, N. (2015). Role of power-to-gas in an integrated gas and electricity system in Great Britain. Int. J. Hydrogen Energy 40 (17), 5763–5775. doi:10.1016/j.ijhydene.2015.03.004
Schiebahn, S., Grube, T., Robinius, M., Tietze, V., Kumar, B., Stolten, D., et al. (2015). Power to gas: Technological overview, systems analysis and economic assessment for a case study in Germany. Int. J. Hydrogen Energy 40 (12), 4285–4294. doi:10.1016/j.ijhydene.2015.01.123
Singhal, S. C. (2012). Solid oxide fuel cells: Past, present and future[J]. Solid Oxide Fuels Cells Facts Figures, 1–23.
Stephen, C., and Pierluigi, M. (2015). Integrated modeling and assessment of the operational impact of power-to-gas (P2G) on electrical and gas transmission networks. IEEE Trans. Sustain. Energy 6 (4), 1234–1244. doi:10.1109/tste.2015.2424885
Stephen, C., and Pierluigi, M. (2015). Storing renewables in the gas network: Modelling of power-to-gas seasonal storage flexibility in low-carbon power systems[J]. IET generation Transm. Distribution 10 (3), 566–575.
Wang, C., Dong, S., Xu, S., Yang, M., Dong, X., and Liang, J., (2019). Impact of power-to-gas cost characteristics on power-gas-heating integrated system scheduling. IEEE Access 7, 17654–17662. doi:10.1109/access.2019.2894866
Yu, L., Shi, Y., Yi, Z., and Cai, N. (2017). Reversible solid oxide fuel cell for natural gas/renewable hybrid power generation systems. J. Power Sources 340, 60–70. doi:10.1016/j.jpowsour.2016.11.057
Zhang, X., Chan, S. H., Li, G., Ho, H. K., Li, J., and Feng, Z. (2010). A review of integration strategies for solid oxide fuel cells. J. Power Sources 195 (3), 685–702. doi:10.1016/j.jpowsour.2009.07.045
Zhang, Z., Zhou, J., Zong, Z., Chen, Q., Zhang, P., and Wu, K. (2019). Development and modelling of a novel electricity-hydrogen energy system based on reversible solid oxide cells and power to gas technology. Int. J. Hydrog. Energy 44, 28305–28315. doi:10.1016/j.ijhydene.2019.09.028
Zhao, P., Gu, C., Hu, Z., Xie, D., Hernando-Gil, I., and Shen, Y. (2021). Distributionally robust hydrogen optimization with ensured security and multi-energy couplings. IEEE Trans. Power Syst. 36 (1), 504–513. doi:10.1109/tpwrs.2020.3005991
Zhang, C., Zhao, S., and He, Y., (2022). An integrated method of the future capacity and RUL prediction for lithium-ion battery pack[J]. IEEE Trans. Veh. Technol. 71 (3), 2601–2613. doi:10.1109/TVT.2021.3138959
Zhou, S., Sun, K., Wu, Z., Gu, W., Wu, G., Li, Z., et al. (2020). Optimized operation method of small and medium-sized integrated energy system for P2G equipment under strong uncertainty[J]. Energy 199 (15), 117269. doi:10.1016/j.energy.2020.117269
Zhao, S., Zhang, C., and Wang, Y., (2022). Lithium-ion battery capacity and remaining useful life prediction using board learning system and long short-term memory neural network[J]. J. of Energy Storage 52, 104901. doi:10.1016/j.est.2022.104901
HCNG Hydrogen-Enriched Compressed Natural Gas
IEGS Integrated Electricity-Gas System
P2G Power to Gas
PV Photovoltaic
RSOC Reversible solid oxide cell
SNG Synthetic natural gas
SOFCs Solid oxide cells
Keywords: electric-to-gas, reversible solid oxide cells, photovoltaic consumption, renewable energy, hydrogen
Citation: Mao H, Nie D, Chen X, Cai Y, Zhao J, Zhang X, Yu H, Ma W, Lv Z and Zhou J (2023) Innovative technology for large-scale photovoltaic consumption using reversible solid oxide cells. Front. Energy Res. 10:1033066. doi: 10.3389/fenrg.2022.1033066
Received: 31 August 2022; Accepted: 05 December 2022;
Published: 24 January 2023.
Edited by:
Chaolong Zhang, Jinling Institute of Technology, ChinaReviewed by:
Sennai Mesfun, Research Institutes of Sweden (RISE), SwedenCopyright © 2023 Mao, Nie, Chen, Cai, Zhao, Zhang, Yu, Ma, Lv and Zhou. This is an open-access article distributed under the terms of the Creative Commons Attribution License (CC BY). The use, distribution or reproduction in other forums is permitted, provided the original author(s) and the copyright owner(s) are credited and that the original publication in this journal is cited, in accordance with accepted academic practice. No use, distribution or reproduction is permitted which does not comply with these terms.
*Correspondence: Jun Zhou, emhvdWp1bkBtYWlsLnhqdHUuZWR1LmNu
Disclaimer: All claims expressed in this article are solely those of the authors and do not necessarily represent those of their affiliated organizations, or those of the publisher, the editors and the reviewers. Any product that may be evaluated in this article or claim that may be made by its manufacturer is not guaranteed or endorsed by the publisher.
Research integrity at Frontiers
Learn more about the work of our research integrity team to safeguard the quality of each article we publish.