 Zhigang Lu*
 Zhilin Cai
- School of Economics and Management, Shanghai Maritime University, Shanghai, China
Promoting new energy vehicle (NEV) is one of the main ways to save energy and reduce transport emissions, China has provided substantial subsidies for this since 2009. With the impending end of the subsidy policy ending in 2022, NEV manufacturers need to strengthen their competitiveness to continuously attract customers. Under the framework of cue utilization theory, this study takes NEV manufacturers’ technical capability as an intrinsic cue and reputation as an extrinsic cue to explore the mechanism in which two cues stimulate customers’ perceptions of travel quality and brand value, and subsequently motivate purchase intention. Based on a sample of 207 respondents from China, proposed hypotheses have been tested using Likert scale questionnaires through SPSS and AMOS. Structural equation modeling techniques were used to analyze the measurement scales and variable relationships. The results show that manufacturers’ reputation is more influential on both perceived travel quality and perceived brand value than technical capability; Technological turbulence plays a moderating role in the influence between perceived brand value and purchase intention. This article provides references for deepening related theories, and pragmatic insights for manufacturer strategic response and government policy making.
Introduction
On a global scale, mobile transport causes the largest increase in carbon dioxide emissions, continuously intensifying global warming and extreme climates (Li et al., 2020b). Emphasizing carbon neutrality, China issued relevant plans for energy saving and emission reduction (Yuan et al., 2015). As electrification is one of the main ways to reduce transportation emissions, Chinese government has provided substantial subsidies for private purchase of new energy vehicle (NEV) since 2009 (Ma et al., 2019b). Twenty-six cities, including Beijing, Shenzhen, Shanghai and Hangzhou, launched pilot programs in batches to subsidize private purchase of NEVs (Ma et al., 2017; Qiu et al., 2019).
According to data published by Ministry of Industry and Information Technology (MIIT), the total amount of subsidies for the promotion of NEVs exceeded 30.2 billion yuan from 2016 to 2020 (MIIT, 2022). As of June 2022, the ownership of NEVs nationwide has reached 10.1 million, with production and sales ranking first in the world for seven consecutive years (MPS, 2022). However, with the expiration of the subsidy policy, the Chinese NEV market experienced a decline at the end of 2019 (Zhang et al., 2018). To further stimulate the NEV market, the government has implemented a subsidy rollback policy, extending the private purchase subsidy from 2020 to the end of 2022 (MIIT, 2021). For NEV manufacturers, to ensure continuous sales growth after the subsidy policy ends, they need to strengthen their competitiveness and attractiveness to enhance customers’ purchase intention (Wang et al., 2019).
Several studies suggested that providing customers with good travel quality and delivering excellent brand value are important measures for vehicle manufacturers to maintain competitiveness and attractiveness (Bennett and Vijaygopal, 2018; Ma et al., 2019a). Travel quality involves three main parameters associated with mobile transportation: time, comfort and travel cost (Curiel Esparza et al., 2016). Brand value represents the comprehensive value of brand in terms of function and emotion (Kato, 2021). Customers’ perception of these two helps them to assess vehicle more accurately and confidently before purchasing, preventing unnecessary regret and improving satisfaction. Especially when customers lack sufficient NEV knowledge, have concerns about quality problems or worry about the uncertainty caused by rapid technological changes (Chen et al., 2021), their interest and purchase intention may be weakened. Hence, NEV manufacturers should deliver more expressive information to customers to demonstrate good travel quality and brand value (Plananska, 2020).
Nevertheless, what information do customers pay more attention to about NEVs? How do customers use the information to perceive travel quality and brand value, and motivate purchase intention? Some studies have shown that milage range and safety of NEVs are common concerns for customers (Priessner et al., 2018; Li et al., 2019). NEV manufacturers can attract customers by demonstrating their technical capabilities and technological maturity. Some scholars argue that the reputation of NEV manufacturers plays a more important role in drawing customers’ attention because it can reduce customers’ perceived risk and thus influence their purchase decisions (Wei and Ho, 2019; Gomez-Trujillo et al., 2020; Li et al., 2020a). In addition, customers’ willingness to purchase NEVs is influenced by such information factors as price, environmental awareness and psychology (Bennett and Vijaygopal, 2018; He et al., 2021). The above studies have focused on analyzing the direct effects of individual factors on customers’ purchase intentions, instead of explaining the structure among these factors and the process by which they arouse customers’ perceptions and generate purchase intentions. Cue utilization theory provides a systematical framework for making inferences about products using cue configurations, and clarifies the process by which customers’ perceived intensity influences their decision-making behavior (Li et al., 2020a; Plananska, 2020). This paper adopts cue utilization theory to propose a three-stage mechanism for an in-depth investigation of how NEV manufacturers’ technical capability and reputation affect customers’ purchase intention. The three stages explain how intrinsic and extrinsic cue stimuli evoke customers’ perceptions of travel quality and brand value, which further influence purchases. We take technical capability as an intrinsic cue with factors such as manufacturers’ technologies of battery, electric motor and electronic control system; reputation as an extrinsic cue with factors such as manufacturers’ word-of-mouth (WOM), reviews and media reports. In addition, technological turbulence is considered a moderating factor based on the environmental characteristics of high technical requirements and rapid development in NEV industry. Correspondingly, this study proposes the following three main points to be investigated:
1. Do NEV manufacturers’ technical capability and reputation legitimately cue customers to perceive travel quality and brand value, and then promote their purchase intention?
2. Does technological turbulence participate in the process of cues’ influence on purchase intention?
3. What is the difference in cueing roles between NEV manufacturers’ technical capability (intrinsic cue) and reputation (extrinsic cue)?
This study aims to investigate cueing roles of NEV manufacturers’ technical capability and reputation in influencing purchase intention. We establish a research model refers to the relationship between technical capability, reputation, perceived travel quality, perceived brand value, technological turbulence and purchase intention. Based on measurement results, the innovation and theoretical contributions are as follows. First, the study proposes a customer evaluation mechanism for NEV private purchasing from the perspective of comprehensive utilization of intrinsic and extrinsic cues. Second, the research considers features of customers’ value perceptions and technological turbulence effects. Third, the investigation discusses cueing roles of both intrinsic and extrinsic sides, and their differences in affecting customers’ judgments on manufacturers and vehicles. This study provides some practical suggestions for NEV manufacturers to sustain strong competitiveness without subsidy support. Some directions are also proposed to provide references for the government for policy-making to support the NEV industry.
Literature review and hypotheses development
Cue utilization theory
The concept of cue utilization was first proposed by Cox (1967). Olson and Jacoby further argued its importance and used cues as proxy to assess product quality (Olson and Jacoby, 1972). Richardson et al. (1994) integrated previous studies and proposed the theory of cue utilization. In the theory, cue is defined as a kind of signal released by encoder, which is received by decoder and used as a quality evaluation criterion. In process of information encoding and decoding, partial loss and distortion of information will also occur. Therefore, information asymmetry about product quality is formed between suppliers (coder) and buyers (decoder) (Liu and Yuan, 2021). In addition, when lacking knowledge of products and facing uncertain function and quality, customers may have no time, complete information or sufficient ability, they can only use certain heuristic information as a measure of quality (Lu and Hu, 2018). According to cue utilization theory, in process of quality assessment, customers take advantage of information they already have and separate certain cues from these information, and thus profit from reducing information searches (Liu and Yuan, 2021). Based on the attributes of the cues, they are often classified as intrinsic cues or extrinsic cues (Liu et al., 2019). The former includes information about the characteristics of product itself, such as product specifications, shape, size, etc; the latter includes information with marketing characteristics, such as price, packaging, reputation, etc.
Cue utilization theory has a wide range of applications in different fields (Konuk, 2019; Liu et al., 2019; Li M. et al., 2021). In business management, leadership structural cues are often used to investigate leader behavior and decision-making. In psychological science, situation-specific perceptual, auditory, and tactile cues are used to analyze the effect of cognitive recognition mechanisms (Lu and Hu, 2018). In physical product consumption, product-related cues, such as geographical indications of agricultural products and packaging of green products, are used to study customers’ purchase intentions (Herbes et al., 2020; Yu and Zhu, 2020). In addition, some internet-related cues, such as data of streaming videos and industry observation reports, are used to explore customers’ demand for virtual products and services (Wei and Ho, 2019; Li G. et al., 2021; Longstreet et al., 2022). However, there are few studies that discuss customers’ willingness to purchase NEVs from the perspective of cue utilization. Neither did they provide a complete evaluation process or mechanism for customer NEV purchases.
Cue utilization theory provides us a theoretical framework for studying customer NEV purchases. In this paper, customers’ evaluation mechanism of NEV purchase is divided into three stages, information stimulus, emotional arousal and value perception, and behavior transformation. In this mechanism, customers utilize a combination of intrinsic and extrinsic cues to perceive travel quality and brand value, evaluate NEVs and their manufacturers, and then make purchase decisions. Based on the characteristics of high requirements and rapid development in technology of NEV industry, we consider NEV manufacturers’ technical capability as the intrinsic cue. And as several related researches suggested, we take NEV manufacturers’ reputation as the extrinsic cue. Intrinsic cues are based on physical attributes of NEV manufacturers, including technical capabilities in battery, electric motor and electronic control system, while extrinsic cues are other related attributes, including reputation in market WOM, customer reviews, commercial and media reports (Li et al., 2020a; Liu and Yuan, 2021). By applying cue utilization theory to research data, this study aims to explore which cues signal travel quality and brand value to arouse customers’ perceptions and motivate their purchase behavior. Furthermore, we are expected to find out the difference in roles between intrinsic and extrinsic cues.
Information stimulus of NEV manufacturers’ technical capability and reputation
In the fiercely competitive environment of the Chinese NEV industry, the performance of technical capabilities established by NEV manufacturers is an indispensable strategic resource (Wu et al., 2020). The strength of a NEV manufacturer’s technical capability not only determines its competitiveness, but also provokes customers’ perception of travel quality and brand value, and further influences their purchase decision (Potter and Graham, 2019). The definition of technical capability usually revolves around skills, resources and knowledge (Zeng et al., 2017). A NEV manufacturer’s technical capability mainly refers to the ability of R&D and application of battery, electric motor and electronic control system, which are respectively represented by battery endurance, fast charging technology, chip patent, 100 km acceleration, braking system and autonomous driving system (Potter and Graham, 2019; Li et al., 2020a). This study understands a NEV manufacturer’s technical capability as the ability of R&D and application of NEV core technologies to improve vehicle quality with accumulation of relevant knowledge, resources and skills. Specifically, it is divided into five dimensions: range, power, charging, safety, and R&D (XUE et al., 2015; Priessner et al., 2018).
As travel quality is the most important factor in NEV evaluation, the relationship between manufacturers’ technical capability and travel quality has always been discussed (Wang and Luo, 2020). Perceived travel quality serves as customers’ assessment results of perceived advantages and disadvantages about comfort, convenience and economy of the vehicles, and responsiveness and reliability of their manufacturers (Okada et al., 2019). Manufacturers’ technical capability of battery and motor determines the time and frequency of charging, the experience of long-distance travel, and the cost reduction relative to fuel vehicles. They prompt customers to sense whether travel is comfortable, convenient and economical, and evaluate travel quality from an intrinsic perspective (XUE et al., 2015; Wu et al., 2020). For manufacturers, providing sufficient information about technical capability makes sure customers perceive potential advantages of vehicles and judge the travel quality more optimistically (Plananska, 2020). On the contrary, if a NEV manufacturer invests little in R&D or relies solely on purchasing technologies and components to produce vehicles, the perceived risk will increase (Li et al., 2020a). Customers may doubt about its reliability and professional responsiveness in solving after-sales problems, and believe that the travel quality is lower than expected.
In addition to travel quality, customers pay great attention to intangible feature brand value in NEV evaluation, expecting uniqueness and superiority of the vehicle (Xiong and Cheng, 2020). Perceived brand value represents customers’ comprehensive appraisal of brand in terms of functional and emotional value (Kato, 2021). If the NEVs of a brand have long-lasting range, strong fast-charging technology and good chip performance, customers’ perceived risk will be reduced (He et al., 2018). They will trust the brand from a technical perspective, and consider the functional value created by the manufacturer’s technical capability to be value for money (Tseng and Lee, 2018). Similarly, if a NEV manufacturer attaches importance to the development and upgrading of vehicle control systems and the implementation of a higher safety standard, it will give customers a sense of psychological superiority and security for driving (Ouyang et al., 2019). They will develop trust and preference from an emotional point of view, and recognize the value that the brand brings.
Although the influence of technical capability as an intrinsic attribute on customers’ purchase decision-making has been discussed in many researches (Priessner et al., 2018; Li et al., 2020a), few studies have noted it as a cue to explore its cascading impacts in the process of NEV purchase, and investigate its influence in arousing customers’ perceptions of travel quality and brand value. Moreover, these researches generally considered one of the aspects covered by technical capability (Ouyang et al., 2019; Dong et al., 2020), instead of comprehensively considering a variety of NEV core technical capabilities of batteries, electric motors, electronic control systems, etc. Consequently, this study expects NEV manufacturers’ technical capability acting as an intrinsic cue to stimulate customers’ perceptions of travel quality and brand value in purchasing. Therefore, the following hypotheses are proposed:
Customers’ perceived travel quality, perceived brand value and purchase intention
As NEV manufacturer’s technical capability and reputation cues are transformed into customers’ value perception, the perceived brand value therein further facilitates customers’ operations and behaviors in purchasing (Konuk, 2019; Li et al., 2020a). The continuous stimulation from two cues inspires customers to achieve a breakthrough in perception, allowing them to make positive associations with NEVs from functional and emotional perspectives. Customers will develop and accumulate approval emotions to recognize the brand value, and subsequently generate willingness to purchase (Saavedra Torres et al., 2020).
In the stage of emotional arousal and value perception, increased travel quality enables the brand to gain competitive advantage, and leads to a higher brand value (Plananska, 2020). Perceived travel quality refers to customers’ evaluation of travel quality and judgment of its overall superiority, involving three main parameters associated with mobile transportation: time, comfort and travel cost (Curiel Esparza et al., 2016). Lehtonen et al. (2021) further divided it into five dimensions from the perspective of drivers (feeling of comfort, feeling of safety, user confidence, user stress and secondary task engagement). Accordingly, this study defines perceived travel quality as customers’ subjective assessment of five dimensions: NEV comfort, convenience and economy, as well as manufacturer responsiveness and reliability (Okada et al., 2019). Good perceived travel quality can lead to positive associations with the brands of the NEVs, and stimulate customers’ emotions of trust in the brand value. When customers are convinced that a NEV is comfortable and convenient for driving, and the service respond of the manufacturer is quick and professional, they will tend to deem that the trade-off between travel quality and cost is beneficial (Tseng and Lee, 2018). Perceived brand value represents customers’ recognition of its all tangible and intangible features, and their comprehensive evaluation in terms of functional and emotional value (Yan et al., 2016; Kato, 2021). The former refers to value perceptions about quality, technology and availability, and the latter refers to value perceptions about trust, commitment and risk aversion.
After perceived travel quality is transformed into perceived brand value, the emotional connections between brands and customers become closer, which will further motivate customers’ purchase intention in the stage of behavior transformation (van Berlo et al., 2021). A good brand value increases customers’ confidence in and satisfaction with their decision, attracts customers to purchase NEV, and develops loyalty or even long-term relationships Liu et al. (2019). If the quality of a NEV brand has established a good image in customers’ minds, they will be confident that purchasing its NEVs may meet their requirements and expectations in terms of vehicle functions. They may believe that the NEV performance of the brand is reliable and value for money, and thus generate purchase intention of its NEVs (Tseng and Lee, 2018). Moreover, if the brand means trustworthy to customers, and can give them some symbols of status, then customers will perceive that the added value of the brand can meet their psychological expectations (Xiong and Cheng, 2020). As a result, they become emotionally attached and believe that buying the NEVs of the brand is a good choice. However, most studies focused on individuals’ preferences for particular vehicle features and their factor roles in NEV acceptance (Bennett and Vijaygopal, 2018; He et al., 2021). Few scholars have investigated travel quality and brand value as antecedents of NEV purchase intention. An opportunity exists in NEV field to discuss the causal effects between perceived travel quality, perceived brand value and purchase intention. Therefore, the following hypotheses are proposed:
The moderating effects of technological turbulence in NEV industry
So far, NEV industry has made great strides in technologies. Technological turbulence refers to the changing of development of information and technology in NEV manufacturing, and its irregularity of occurrence and spread (Celtekligil and Adiguzel, 2019). In the past 2 decades, the power batteries of NEVs have evolved from lead-acid batteries to nickel-metal hydride batteries, and then to lithium batteries and ternary polymer lithium batteries now with the highest market share (Li et al., 2020a; Dong et al., 2020). Since 1988, Insulated Gate Bipolar Translator (IGBT) chips have undergone 7-generation iterations to reach 8-inch, and achieve the structure of micro-trench plus field stop. However, there is still a lot of space for technology development. Many NEV related technologies have yet to be improved (Hasan and Simsekoglu, 2020). Technology updates every few years have made customers hesitate to purchase, fearing that some better models will be launched soon. In addition, the frequent occurrences of major accidents like NEV battery explosions and brake system failures resulting from immature technologies have caused many customers who value safety issues to take a wait-and-see approach (Chen et al., 2021). Technological turbulence in the NEV industry is a complex socio-environmental phenomenon that leads to frequent industry adjustments and fierce competition (Celtekligil and Adiguzel, 2019; Li Y. et al., 2020). Its disruptive nature poses a serious threat to business operations.
The impact of perceived brand value on purchase intention varies with the degree of technological turbulence (Martin et al., 2020). In conditions of high technological turbulence, uncertainties and risks are relatively high, making customers hesitant to purchase. Under this circumstance, the buffer role of the brand value will be more prominent (Ma, 2020; Saavedra Torres et al., 2020). The emotional connections already established between the brands and the customers will reduce perceived risk, and give customers a sense of security in the purchases. At the same time, the rapid changes in technology force NEV manufacturers to keep up with and adapt to current technology trends, making them pay more attention to the functional values that their brands should deliver to customers for attracting consumption (Li Y. et al., 2020; Martin et al., 2020). When the technological turbulence of the NEV industry tends to slow down, the perceived differentiation of functional value brought by different NEV brands will diminish, i.e., customers will place less importance on perceived brand value in the purchase process. Previous studies of technological turbulence mainly focused on its impact on strategy selection, new product development and innovation capability from perspective of suppliers (Wu et al., 2017; Yun et al., 2019). Few researches have investigated it in NEV industry and from the perspective of customers. Combined with the above, this study considers that the technological turbulence in NEV industry may play a moderating role in NEV purchase intention. Therefore, the following hypothesis is proposed:
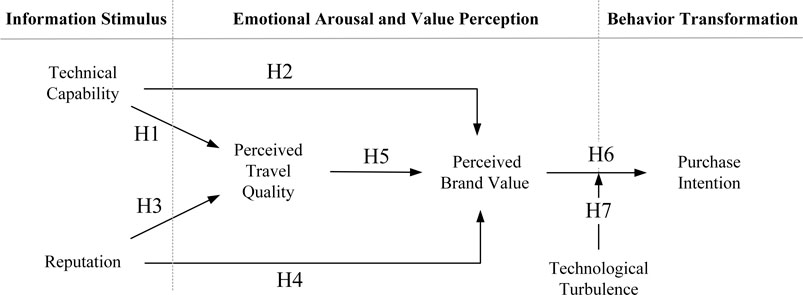
FIGURE 1. The conceptual model of cueing roles of NEV manufacturers’ technical capability and reputation in influencing customers’ purchase intention.
Research methodology
Instrument development
In order to effectively carry out the scale design and questionnaire distribution, we investigated and analyzed the market data in the Chinese NEV industry. We collected the NEV production and sales data from January 2011 to June 2022 through government websites of the Ministry of Industry and Information Technology (MIIT) and the Ministry of Public Security (MPS). Also, we collected information about 45 brands in the domestic NEV market through the industry information platforms, such as China Passenger Car Association (CPCA) and China Association of Automobile Manufacturers (CAAM), as well as mainstream automotive information websites and NEV manufacturers’ official websites. The analysis results show that among the three types of NEV, battery electric vehicle (BEV), plug-in hybrid electric vehicle (PHEV) and hybrid electric vehicle (HEV), the market share of BEV and PHEV has exceeded 99.96% in 2021, while it of BEVs is about 82.5%. As shown in Figure 2, 93.3% of the 45 brands have BEV models, and more than half sell both BEV and PHEV models, while HEV models have become relatively rare (8.8%). Additionally, to further consider the variable design and items measurement, this paper made stemming analysis according to various types of information collected from manufacturers’ official websites and information media disclosures. It was found that most of the official websites have detailed descriptions of model overviews, latest technologies, product quality and service experiences, while online media prefer to report information related to vehicle accidents, recalls and R&D breakthroughs.
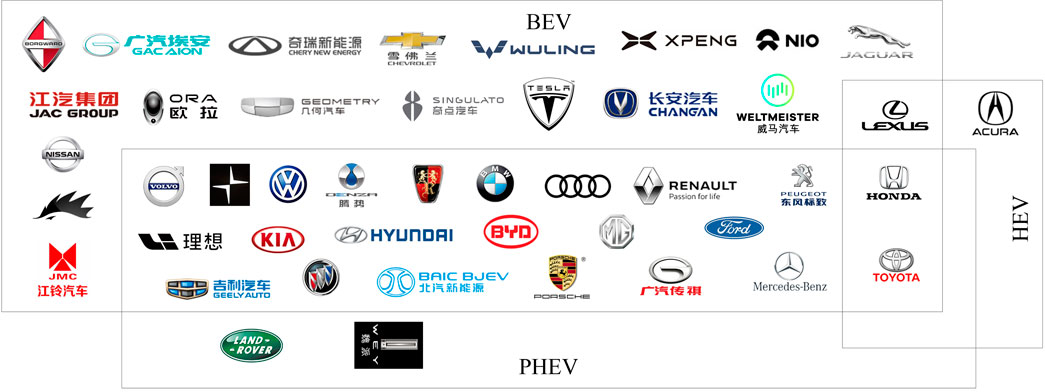
FIGURE 2. The distribution of new energy models released by influential car brands in the Chinese market in 2021. BEV: battery electric vehicle; PHEV: plug-in hybrid electric vehicle; HEV: hybrid electric vehicle.
In this study, questionnaire was used to obtain research data and survey the six constructs in the model illustrated in Figure 1: manufacturers’ technical capability, reputation, perceived travel quality, perceived brand value, technoligical turbulence and purchase intention. Based on the investigation and analysis results of the Chinese NEV market, we designed the question items and scales of this study by appropriately adapting the mature scales from existing studies. A seven-point Likert scale was adopted for coding to fulfill the requirement of equidistance, ranging from 1 (strongly disagree) to 7 (strongly agree). By referring to relevant researches’ comprehensive descriptions of technical capability on NEV (XUE et al., 2015; Ma et al., 2019a; Potter and Graham, 2019), technical capability was measured from five dimensions: range, power, charging, safety, and R&D (nine items in total). Considering the specificity of NEVs, the items of reputation were adapted from Ling et al. (2019) and Dong and Zheng (2022), comprising seven elements. Combining NEV and manufacturer characteristics, perceived travel quality was measured with 6 reflective items (Okada et al., 2019; Lehtonen et al., 2021). Perceived brand value includes two dimensions as defined: functional value and emotional value. The scale for measuring functional value was adapted from Kato’s and Konuk’s scales (Konuk, 2019; Kato, 2021). The scale measuring emotional value was adapted from the works of Habich-Sobiegalla et al. (2019) and Xiong and Cheng (2020). Perceived brand value contains 6 items in total. The three-item scale suggested by Yan et al. (2016) was used to measure technological turbulence. Based on the study of Li et al. (2020b) and He et al. (2018), three items were used to measure purchase intention. The measurement items are noted in Table 1.
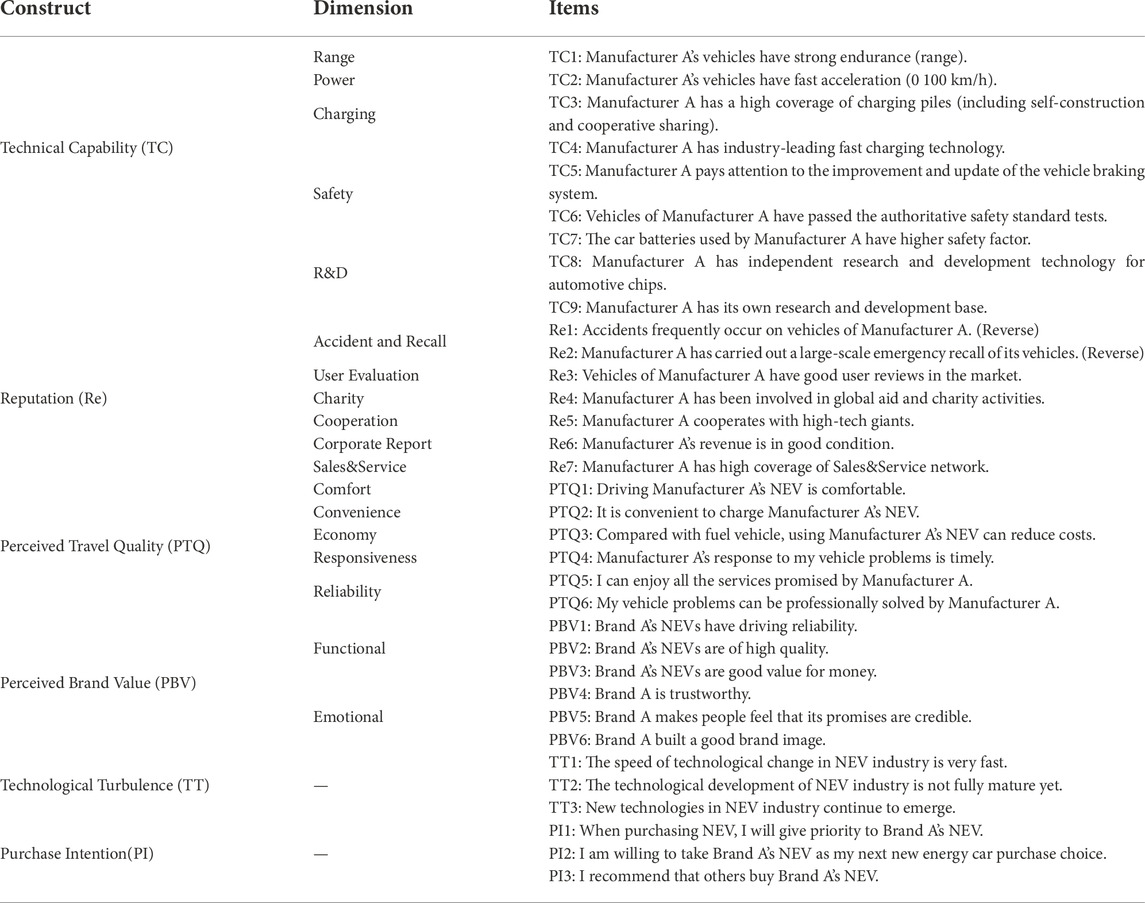
TABLE 1. Variable design and measurement items.
Sampling and data collection
Given the dominant position of BEVs and PHEVs in the Chinese NEV market, BEV and PHEV drivers were taken as respondents for the survey questionnaire. Questionnaire filling was organized in online forms through the internet survey platform MIKECRM (https://www.mikecrm.com/). In order to ensure the authenticity of the completed questionnaires, we made a friendly reminder to the respondents to fill out the online forms seriously and carefully at the top of starting page. In addition, to ensure the consistency of data, we set 2 reverse questions and 1 repeated question to test whether the respondents answered the questions honestly. Respondents who completed the questionnaire were rewarded with a certain amount of cash bonuses. The survey period lasted for 36 days. A total of 222 questionnaires were collected. After eliminating the questionnaires that did not pass the authenticity and consistency test and some invalid questionnaires, 207 valid responses were retained.
Of the valid responses, 57.49% of the respondents were from the Yangtze River Delta and Pearl River Delta regions of China, and the remaining 42.51% were from other regions. This is consistent with the regional distribution of the 2021 NEV sales data published by Auto Thinker (http://www.autothinker.net/), with the Yangtze River Delta and Pearl River Delta regions accounting for about 60%. NEVs have high penetration rates in the automobile markets of these two regions, as the R&D, manufacturing, assembly and supply chain companies of NEVs are mainly concentrated in there. The collected data with the above regional distribution characteristics can appropriately reflect the relationship between customers’ perception of NEV manufacturers’ abilities and their purchase intention.
The descriptive statistical results of valid samples are shown in Table 2. Among all the respondents, 67.633% are male (n = 140) and 32.367% are female (n = 67). Most of them are aged 35–44 (n = 77, 37.198%) or 45–59 (n = 62, 29.952%). Regarding vehicle types, 48.792% are PHEV users, and 51.208% are BEV users. As for vehicle use, most respondents used their vehicles for online car-hailing (n = 129, 62.319%), followed by commuting (33.333%) and others (4.348%). Online car-hailing drivers refer to the group who operate their private cars for taxi business. This group of respondents were the registered drivers on Xiangdao Travel (https://www.saicmobility.com/), an online car service platform. According to the related regulations and platform requirements, online car-hailing drivers must hold online reservation cab driver qualification certificates, while the vehicle must not be more than 5 years old and must have online reservation cab operation certificates.
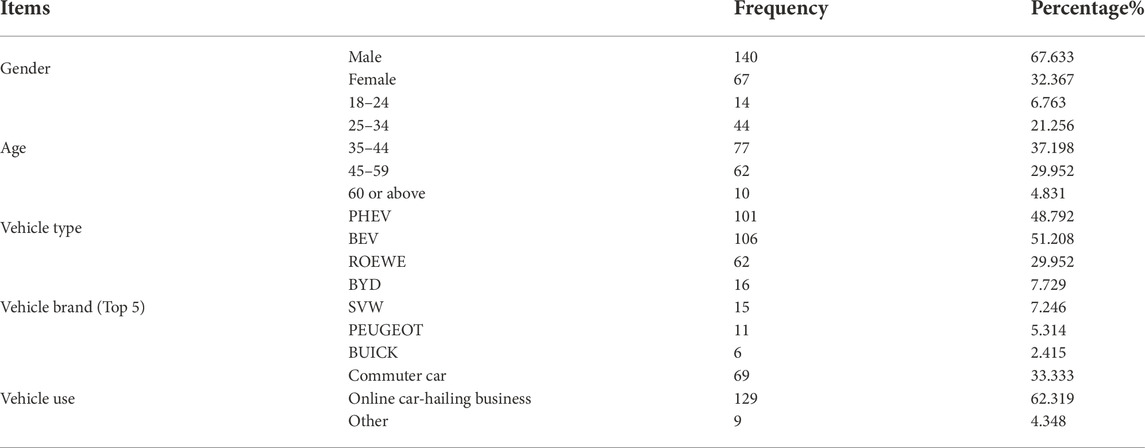
TABLE 2. Descriptive statistical results of valid samples (N = 207).
Data analysis methods and common method bias
It is generally believed that maximum likelihood estimation (MLE) is suitable for estimating structural equations when the number of samples is over 100 but not too large to prevent being overly sensitive. According to the research hypotheses and questionnaire form, on the basis of retained 207 valid samples, this study applied MLE to calculate and analyze the measurement model and the structural model. The statistical software SPSS22.0 was used to conduct reliability and validity tests and exploratory factor analysis (EFA), and AMOS26.0 was used to conduct confirmatory factor analysis (CFA) and structural equation modeling (SEM). Data collected by questionnaires may cause a common method bias (CMB) issue. To evaluate potential CMB, we used Harman’s single-factor method. The unrotated principal components factor analysis indicates that 3 factors’ eigenvalues are greater than 1 and there is 37.744% total variance in Harman’s single-factor test (Ou et al., 2014). The results suggest that CMB is not a concern in this study.
Results
Measurements
Cronbach’s alpha and composite reliability (CR) were used to test the reliability of the scale. Table 3 shows that Cronbach’s alpha values of all constructs range from 0.885 to 0.959, and CR values are between 0.886 and 0.959. Both metrics thus exceed the required value of 0.7, which satisfies the reliability requirement.
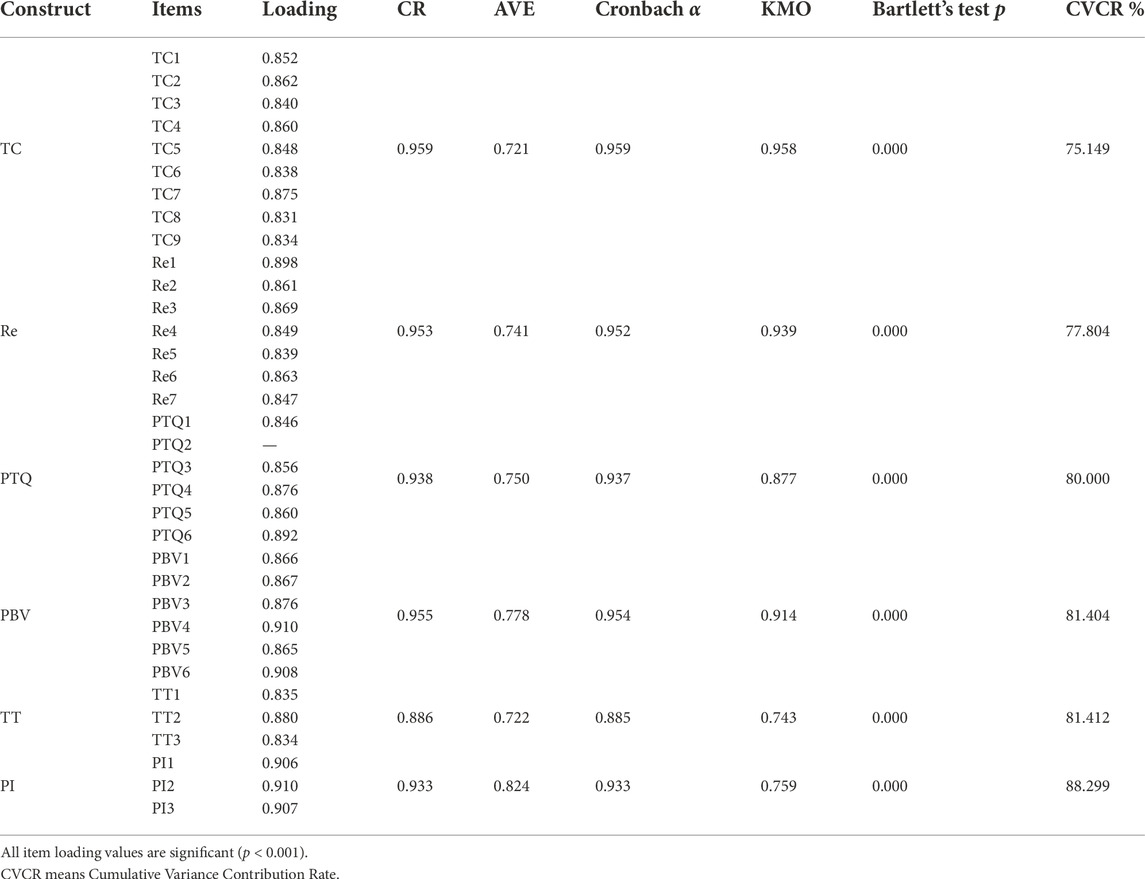
TABLE 3. The results of reliability and convergent validity.
In terms of validity, this study measured convergent validity and discriminant validity. First, EFA and CFA were used for convergent validity test. We employed principal component analysis (PCA) to investigate construct validity. We intercepted the data with the standard of eigenvalue = 1 and applied varimax orthogonal rotation, and the results of which show that the extracted factors correspond to the six factors of the scale. The overall Kaiser-Mayer-Olkin (KMO) measure is 0.849, the Bartlett’s test is significant (p < 0.000), and cumulative variance contribution rate is 77.360%. Table 3 presents that KMO of all constructs are greater than 0.500, and Bartlett’s tests are all significant. These results support this study to further conduct CFA by factor loading and average variance extracted (AVE). Table 3 indicates that all items’ loadings are above the standard of 0.500 except PTQ2, and AVEs of all constructs are also greater than 0.500. As Cronbach’s alpha value of PTQ is significantly improved after deletion of PTQ2, it is excluded. The results above represent solid convergent validity. Then, discriminant validity was tested by comparing the square root of each construct’s AVE with the correlations shared between this and other constructs. In Table 4, the square root of AVE values of all constructs are over 0.700 and greater than the correlations of its row and column, which confirms strong discriminant validity.
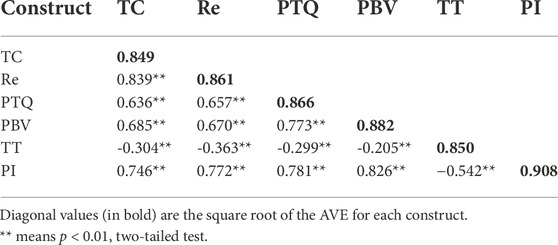
TABLE 4. Correlations of the latent variables and AVEs.
Structural model
A structural model was applied to the conceptual model. This study adopted MLE to estimate the structural model with 207 valid samples. We evaluated the fit between the model and survey data by three categories of fit indexes. The absolute fit is used to determine the degree to which the model can predict the covariance and correlation matrices. The normed chi-square (χ2/df) is 1.404 between 1 and 3, the root-mean-square error of approximation (RMSEA) is 0.044 less than 0.08, and the goodness-of-fit index (GFI) is 0.844 over 0.80. These indicate that the model’s goodness of fit is fine. In relative fit, the comparative fit index (CFI) is 0.975 greater than 0.90, and the Tucker-Lewis index (TLI) is 0.973 over 0.90, demonstrating that the model fits well compared with the independent model. Parsimonious normed fit index (PNFI) and parsimonious goodness-of-fit index (PGFI) in the parsimony fit are employed to evaluate whether the model is too complicated. Both of them are greater than 0.50, proving that the model’s overall simplicity is ideal. The evaluation results of the model are shown in Table 5. All the values of each index meet the corresponding evaluation criteria, suggesting that the model has good fitness with the survey data, and the model proposed is reasonable.
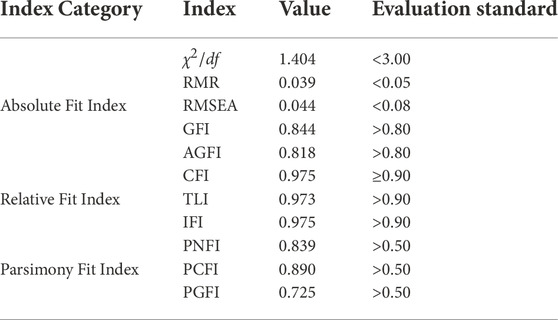
TABLE 5. The fit evaluation results of the model.
Concerning the proposed hypotheses, we bootstrapped 5000 times to calculate the two-tailed significance and standardized parameters of full effects. The standard path coefficient of NEV manufacturers’ technical capability on perceived travel quality is 0.309, statistically significant at the 0.05 level, and H1 is verified. H2 is supported by a significant effect of NEV manufacturers’ reputation on perceived travel quality (path coefficient = 0.560, p < 0.001). NEV manufacturers’ technical capability and reputation both demonstrate significant effects on perceived brand value. The path coefficients are 0.234 and 0.401 respectively, statistically significant at the p < 0.01 and p < 0.001 levels, which confirms H3 and H4. Moreover, perceived travel quality is positively associated with perceived brand value (path coefficient = 0.361, p < 0.001), H5 is verified. H6 is also supported by a positive effect of perceived brand value on purchase intention (path coefficient = 0.880), statistically significant at the p < 0.001 level. T-scores of all paths are over 1.960 at α = 0.05, which means that all hypotheses are affirmed. The results of the structural model are illustrated in Figure 3. Accordingly, these suggest that NEV manufacturers’ technical capability and reputation do play cueing roles in influencing purchase intention. They both have causal chains with the relationship from perceived travel quality, perceived brand value to purchase intention. In particular, reputation as an extrinsic cue has greater impact on the two intermediate variables, indicating that customers tend to use extrinsic cues to evaluate the quality of NEVs.
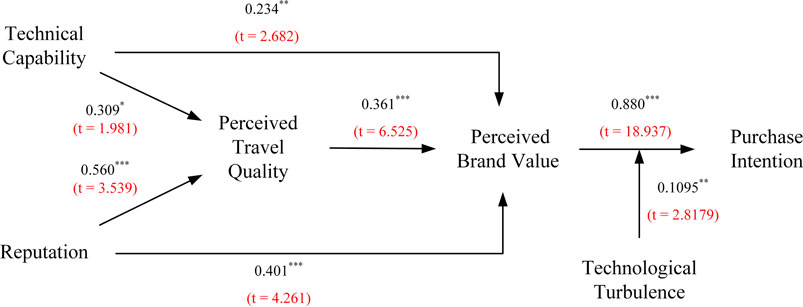
FIGURE 3. Research results of the structural model. *: p < 0.05; **: p < 0.01; ***: p < 0.001, two-tailed test.
Post hoc assessment of moderating effects
In order to investigate the moderating effects of technological turbulence on the relationship between perceived brand value and purchase intention, the model 1 of PROCESS (a plug-in under SPSS) was adopted to conduct the Bootstrap test for indirect effects (Jie et al., 2015). After mean centering of the interaction items, we set bootstrap sampling to be 5000 times and confidence interval to be 95%. The results reported in Table 6 show that the regression coefficient of interaction term (PBV×TT) is 0.1095, statistically significant at the 0.01 level. R2 is significantly increased after adding interaction term (p < 0.01), representing significant moderating effects. Consequently, these demonstrate that technological turbulence positively moderates the relationship between perceived brand value and purchase intention, and H7 is confirmed (T-score = 2.8179). When the NEV industry is in technological turbulence, the impact of perceived brand value on purchase intention may be enhanced. This allows customer’s perception of good brand value to stimulate a higher purchase intention; Conversely, when technological turbulence is low, the impact of perceived brand value on purchase intention may be diminished. Customer’s perceived brand value can only increase their purchase intention to a limited extent.
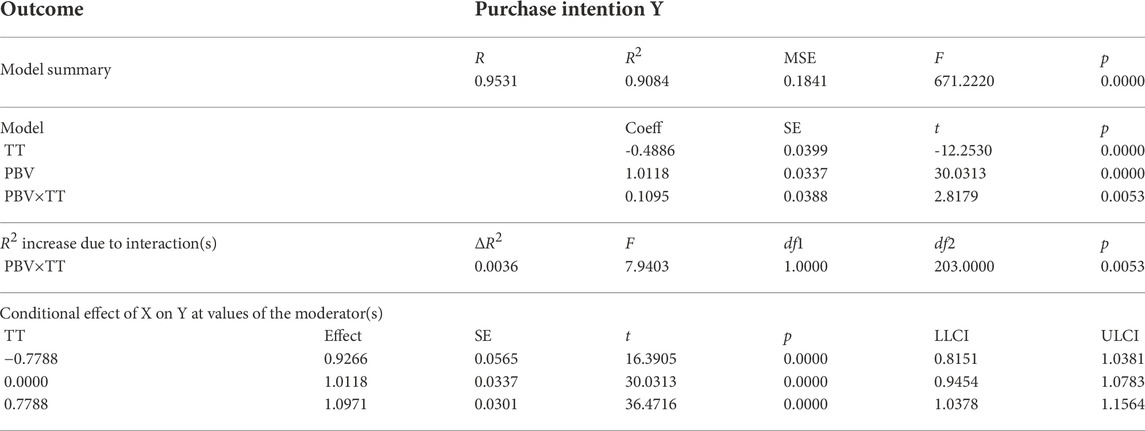
TABLE 6. The results from testing the moderating effects of technological turbulence.
Discussion
Research findings
The main purpose of this study is to explore the cueing roles of NEV manufacturers’ technical capability (intrinsic cue) and reputation (extrinsic cue) in influencing customers’ purchase intention. Contributing to information stimulation and emotional arousal, NEV manufacturers’ technical capability and reputation are found to be important cues for customers to evaluate travel quality and brand value. The higher the manufacturers’ technical capability and reputation, the better the customers’ perception of travel quality and brand value. In technical capability, factors of TC7, TC2, TC4, and TC1 are relatively more important in sequence, meaning that customers may pay more attention to the issues about battery safety, fast acceleration, fast charging technology and endurance. Items Re1, Re3, Re6, and Re2 of reputation are comparatively more important in order, indicating that customers may lay more emphasis on accident frequency, user evaluation, corporate report and emergency recall. In terms of the difference between intrinsic and extrinsic cues, both path coefficients of reputation to perceived travel quality and to perceived brand value are slightly higher than technical capability (0.560 > 0.309; 0.401 > 0.234). It shows that the extrinsic cue is more momentous than the intrinsic cue, which coincides with the views put forward by previous studies that customers mainly rely on extrinsic cues to assess quality (Liu and Yuan, 2021). Consequently, manufacturers’ technical capability and reputation may provide cues for customers’ assessment of vehicles and manufacturers, and reputation as an extrinsic cue plays a bigger role because it is relatively easier to be obtained and understood.
In value perception and behavior transformation, it is observed that perceived travel quality first positively affects perceived brand value, and then perceived brand value helps in purchase decision-making process and significantly enhances customers’ purchase intention. The better the perceived travel quality, the better the perceived brand value, and eventually the higher purchase intention. During value perception transformation, customers’ perception of travel quality (functional) established from obtained cues gradually moves up to perception of brand value (functional and emotional) (Kato, 2021). In this study, this is specifically manifested as customers’ attention from comfort, economy and responsiveness in perceived travel quality to driving reliability, trustworthiness and brand image in perceived brand value. Behavior transformation realizes the process from long-term accumulation of perceived brand value to purchase intention and even possible purchase behavior. These findings are consistent with the results of previous researches on relationship between perceived quality, perceived value and purchase intention (Wei and Ho, 2019). Hence, in customer evaluation mechanism of this study, travel quality and brand value are successively the antecedents of NEV purchase intention.
On basis of the relationship chain above, this study considers the moderating effects of technological turbulence. The results demonstrate that it plays a positive role in moderating the process of perceived brand value enhancing purchase intention. If technological turbulence of the NEV industry is high, perceived brand value will be more important for the formation of purchase intention. Technological turbulence creates uncertainties and risks. Brand awareness and value guarantee the quality of vehicles, alleviate anxiety appropriately, and enhance customers’ confidence. Emotional connection between the brand and customers may act as a buffer in a high turbulence environment. Accordingly, with high technological turbulence, customers are more likely to generate higher purchase intention in NEVs whose brands have accumulated good perceived brand value.
Theoretical implications
In the past few years, researches on NEV industry have received extensive attention from academia. Most current studies have been conducted on promotion, adoption and purchasing of NEVs, and applied theories such as evolutionary game theory, resource-based theory and planned behavior theory (Chu et al., 2019; Okada et al., 2019; Li et al., 2020b). However, scholars who have investigated NEV purchase intention mainly considered direct impacts of single factors such as price, environmental awareness, psychology, experience, policy, etc. (Bennett and Vijaygopal, 2018; Wolbertus et al., 2018; He et al., 2021). They ignored the structural characteristics of the factors influencing customers’ NEV purchase intention, and neglected to explore the influence mechanism by considering customer evaluation as a process. Considering the structural characteristics of the influencing factors, this study takes NEV manufacturers’ technical capability as an intrinsic cue and reputation as an extrinsic cue. Based on cue utilization theory, we divide the evaluation process of customer NEV purchase into three specific stages: information stimulus, emotional arousal and value perception, and behavior transformation. We explore the mechanism of how technical capability and reputation contribute to customers’ perceived travel quality and brand value, and then motivate their purchase intention. Also, this paper integrates both intrinsic and extrinsic cues to reveal the perceived variability they create in the purchase process. In addition, considering the environmental peculiarities of the NEV industry, we demonstrate the moderating role of technological turbulence in the process of perceived brand value influencing purchase intention. Overall, this study contributes to providing theoretical foundations and references to investigate more cues, paths and environmental variables that affect customers’ purchase intention of NEV.
Practical implications
This study has some strategic and practical implications, which can be reflected in four aspects. First, manufacturers should invest in an orderly manner with the ultimate goal of developing a solid and strong technical capability (intrinsic cue). In order to improve the travel quality of NEVs, IGBT chips, batteries, charging technology and braking system should be the main foci of technology development. Manufacturers can improve their technical capability in various ways, such as through independent R&D or cooperative R&D, resources or patents purchase, and commissioned production. In particular, manufacturers that already have a certain capability and scale should further expand their independent and autonomous technical capabilities to achieve higher customer recognition and trust. They can consider investing in the introduction of advanced equipment and management systems, establishing their own R&D teams and bases, and hiring technical consultants to develop chips and batteries independently, etc. At the same time, manufacturers should provide customers with more information related to the technical capability that they care about, such as safety performance, fast charging time, range, etc., to attract potential purchase.
Second, manufacturers should strive to enhance and carefully maintain their reputation (extrinsic cue) in NEV industry. In the marketing funnel of NEV purchasing, customers first search for information, take alternative evaluation, then make purchase decision, and finally do post-purchase satisfaction evaluation. Manufacturers should build positive images related to aspects such as travel quality and social responsibility through advertising, news and word-of-mouth (WOM), focusing on promoting reports of technological breakthroughs, cooperation with leading high-tech companies and participation in charity activities. They should also pay attention to public relations management, especially when negative incidents like battery explosions, braking system failures and emergency recalls are exposed. Manufacturers should respond in a timely and reasonable manner, rather than confusing the public and shirking their responsibilities. In addition, customers rely more on extrinsic cues for evaluation of travel quality and brand value, implying that manufacturers should strengthen their external operation management capability. During purchase and post-purchase, it is necessary to track customers’ expectation of model design and features, listen to their comments and dissatisfaction with the driving experience, and give them positive feedback. Accordingly, in order to form virtuous cycles of promoting customer purchase, manufacturers should start by investments in reputation construction and maintenance. Based on the initial good image, they can subsequently strengthen independent technical capability. With own technologies of chips and batteries, manufacturers can ultimately stand firm and gain long-term competitiveness in NEV industry. And the profits from the increased sales can in turn help fund the next round in reputation building.
Third, in the highly volatile technological environment of NEV industry, manufacturers should pay more attention to brand consolidation strategies and value delivery. To maintain the high value and stability of their brands in customers’ minds, manufacturers should demonstrate to them that their brands can continue to adapt to technological changes without wavering. They should master at least one core technology, and strive to become the representative leaders of one or more technologies in NEV industry. Cooperating with other companies to establish integrated service ecosystems can also convince customers that the brands are unshakable and credible. Through the above, manufacturers can overcome high technological turbulence and attract potential purchase with solid brand images.
Fourth, after the subsidy policy ends, the government should consider some alternative supports to ensure that the NEV market continues to maintain an upward trend. To accelerate the achievement of carbon neutrality targets and develop low-carbon ports and cities, technology-led NEV manufacturers should be encouraged to participate in investing in electric electrification projects for public transportation and freight collector trucks. Additionally, opening up international cooperation, improving the technology innovation systems and building common technology sharing platforms can help create a favorable NEV technology R&D environment for manufacturers to conduct independent or cooperative researches on batteries, chips, control systems, intelligent networking, etc. These measures can support small and micro NEV manufacturers to get stronger and more professional, and guide them to strengthen their brand development strategy in an orderly manner. At the same time, it is also necessary to strengthen intellectual property protection and create a healthy competitive environment, protecting the reputation of NEV manufacturers and the rights of customers according to the relevant laws.
Limitations and directions for future research
The research is subject to several limitations, which may have certain guiding significance for future researches. First, this study proposes two cues from the customers’ perspective, and investigates their roles on perceived travel quality and perceived brand value in NEV purchasing. However, it is far from enough to grasp all influences and relationships, more different cues are expected to be explored to deepen the overall understanding of customers’ evaluation mechanism. Second, this study selects NEV as one research object, it is hoped that future researches can further compare the differences in customer evaluation mechanisms between the three types of NEV. Third, due to the environmental particularity of NEV industry, this study chooses technological turbulence as a single moderating variable for investigation. Future researches can consider the impacts of other environment variables such as competition intensity and information density. Additionally, due to the low penetration rate of NEVs in northern China, this study only received a small number of survey responses from the northern regions. Future research can be conducted specifically in the northern regions of China to compare the differences in customers’ NEV purchase intention in different regions.
Conclusion
This study proposed that NEV manufacturers’ technical capability and reputation serve as cues of customers’ perceived travel quality and brand value, which in turn influences their purchase intention. The results demonstrate that two cues do affect customers’ evaluation of vehicles and manufacturers, and further leading to purchase decision. Especially, compared with technical capability (intrinsic cue), reputation (extrinsic cue) is more influential on both perceived travel quality and brand value. In addition, technological turbulence plays a positive moderating role in the relationship between perceived brand value and purchase intention. Based on the findings, this study recommends that NEV manufacturers can focus on improving technical capability and maintaining reputation to keep attraction and competitiveness when the subsidy policy support from the government ends. Moreover, if technological turbulence is high, manufacturers should pay more attention to brand consolidation and value delivery. Future researches will identify and explore more intrinsic and extrinsic cues, and investigate the differences and interactions between them. The findings and conclusions of this study may benefit future development and investigation of NEV industry, and provide pragmatic insights for NEV manufacturing and sales.
Data availability statement
The raw data supporting the conclusion of this article will be made available by the authors, without undue reservation.
Author contributions
ZL: guidance and conceptualization. ZC: methodology, survey, software, data curation and writing—original draft preparation.
Funding
This work was supported by the National Natural Science Foundation of China [grant number 71971135]; and the Natural Science Foundation of Shanghai [grant number 18ZR1416900].
Conflict of interest
The authors declare that the research was conducted in the absence of any commercial or financial relationships that could be construed as a potential conflict of interest.
Publisher’s note
All claims expressed in this article are solely those of the authors and do not necessarily represent those of their affiliated organizations, or those of the publisher, the editors, and the reviewers. Any product that may be evaluated in this article, or claim that may be made by its manufacturer, is not guaranteed or endorsed by the publisher.
References
Bennett, R., and Vijaygopal, R. (2018). Consumer attitudes towards electric vehicles. Eur. J. Mark. 52, 499–527. doi:10.1108/EJM-09-2016-0538
Carlson, J., Wyllie, J., Rahman, M. M., and Voola, R. (2019). Enhancing brand relationship performance through customer participation and value creation in social media brand communities. J. Retail. Consum. Serv. 50, 333–341. doi:10.1016/j.jretconser.2018.07.008
Celtekligil, K., and Adiguzel, Z. (2019). Analysis of the effect of innovation strategy and technological turbulence on competitive capabilities and organizational innovativeness in technology firms. Procedia Comput. Sci. 158, 772–780. doi:10.1016/j.procs.2019.09.114
Chen, Y., Kang, Y., Zhao, Y., Wang, L., Liu, J., Li, Y., et al. (2021). A review of lithium-ion battery safety concerns: The issues, strategies, and testing standards. J. Energy Chem. 59, 83–99. doi:10.1016/j.jechem.2020.10.017
Chu, W., Im, M., Song, M., and Park, J. (2019). Psychological and behavioral factors affecting electric vehicle adoption and satisfaction: A comparativestudy of early adopters in China and Korea. Transp. Res. Part D Transp. Environ. 76, 1–18. doi:10.1016/j.trd.2019.09.009
Cox, D. F. (1967). Risk taking and information handling in consumer behavior. Boston: Harvard University.
Curiel Esparza, J., Mazario-Diez, J., Canto-Perello, J., and Martín Utrillas, M. (2016). Prioritization by consensus of enhancements for sustainablemobility in urban areas. Environ. Sci. Policy 55, 248–257. doi:10.1016/j.envsci.2015.10.015
Dong, F., and Zheng, L. (2022). The impact of market-incentive environmental regulation on the development of the new energy vehicle industry: a quasi-natural experiment based on China’s dual-credit policy. Environ. Sci. Pollut. Res. 29, 5863–5880. doi:10.1007/s11356-021-16036-1
Dong, G., Wei, L., Xie, J., and Zhang, W. (2020). Financing and operational optimization: An example of electric vehicle’s major component – power battery. Comput. Ind. Eng. 148, 106751. doi:10.1016/j.cie.2020.106751
Gomez-Trujillo, A. M., Velez-Ocampo, J., and Gonzalez-Perez, M. A. (2020). A literature review on the causality between sustainability and corporate reputation. Manag. Environ. Qual. An Int. J. 31, 406–430. doi:10.1108/MEQ-09-2019-0207
Habich-Sobiegalla, S., Kostka, G., and Anzinger, N. (2019). Citizens’ electric vehicle purchase intentions in China: An analysis of micro-level and macro-level factors. Transp. Policy 79, 223–233. doi:10.1016/j.tranpol.2019.05.008
Hasan, S., and Simsekoglu, Ö. (2020). The role of psychological factors on vehicle kilometer travelled (VKT) for battery electric vehicle (BEV) users. Res. Transp. Econ. 82, 100880. doi:10.1016/j.retrec.2020.100880
He, X., Zhan, W., and Hu, Y. (2018). Consumer purchase intention of electric vehicles in China: The roles ofperception and personality. J. Clean. Prod. 204, 1060–1069. doi:10.1016/j.jclepro.2018.08.260
He, Z., Zhou, Y., Wang, J., Li, C., Wang, M., and Li, W. (2021). The impact of motivation, intention, and contextual factors on green purchasing behavior: New energy vehicles as an example. Bus. Strategy Environ. 30, 1249–1269. doi:10.1002/bse.2682
Herbes, C., Beuthner, C., and Ramme, I. (2020). How green is your packaging–a comparative international study of cues consumers use to recognize environmentally friendly packaging. Int. J. Consum. Stud. 44, 258–271. doi:10.1111/ijcs.12560
Jie, F., Zhonglin, W., Dongmei, L., and Nini, L. (2015). Moderation effect analyses based on multiple linear regression. J. Psychol. Sci. 38, 715–720. doi:10.16719/j.cnki.1671-6981.2015.03.001
Kato, T. (2021). Synergistic effect of matching corporate and product brand images on purchase intentions: Comparing the importance of functional and emotional value. J. Brand Manag. 28, 671–684. doi:10.1057/s41262-021-00250-w
Konuk, F. A. (2019). The influence of perceived food quality, price fairness, perceived value and satisfaction on customers’ revisit and word-of-mouth intentions towards organic food restaurants. J. Retail. Consum. Serv. 50, 103–110. doi:10.1016/j.jretconser.2019.05.005
Lehtonen, E., Wörle, J., Malin, F., Metz, B., and Innamaa, S. (2021). Travel experience matters: Expected personal mobility impacts after simulated l3/l4 automated driving. Transportation 49, 1295–1314. doi:10.1007/s11116-021-10211-6
Li, J., Jiao, J., and Tang, Y. (2019). An evolutionary analysis on the effect of government policies on electric vehicle diffusion in complex network. Energy Policy 129, 1–12. doi:10.1016/j.enpol.2019.01.070
Li, L., Guo, S., Cai, H., Wang, J., Zhang, J., and Ni, Y. (2020a). Can China’s bev market sustain without government subsidies?: An explanation using cues utilization theory. J. Clean. Prod. 272, 122589. doi:10.1016/j.jclepro.2020.122589
Li, L., Wang, Z., and Wang, Q. (2020b). Do policy mix characteristics matter for electric vehicle adoption?a survey-based exploration. Transp. Res. Part D Transp. Environ. 87, 102488. doi:10.1016/j.trd.2020.102488
Li, Y., Kwok, R. C.-W., Zhang, S., and Gao, S. (2020c). How could firms benefit more from absorptive capacity under technological turbulence? the contingent effect of managerial mechanisms. Asian J. Technol. Innovation 28, 1–20. doi:10.1080/19761597.2019.1686708
Li, G., Lin, S., Yu, W., and Guo, S. (2021a). An empirical study on the cueing effect of the emotional post title in a virtual community. Data Inf. Manag. 5, 208–227. doi:10.2478/dim-2020-0024
Li, M., Huang, L., Sun, H., and Yu, J. (2021b). The factors of articles’ perceived quality in the internet encyclopededia from the perspectve of cue utilization theory. Inf. Stud. Theory Appl. 44, 154–160. doi:10.16353/j.cnki.1000-7490.2021.02.022
Ling, Z., Cherry, C. R., and Yang, H. (2019). Emerging mini electric cars in China: User experience and policy implications. Transp. Res. Part D Transp. Environ. 69, 293–304. doi:10.1016/j.trd.2019.02.009
Liu, Z., and Yuan, Q. (2021). The development and application of five cue theories. J. Mod. Inf. 41, 140–149. doi:10.3969/j.issn.1008-0821.2021.10.016
Liu, Y., Fan, X., Li, J., and Dong, X. (2019). Extrinsic cues, perceived quality, and purchase intention for private labels. Asia Pac. J. Mark. Logist. 31, 714–727. doi:10.1108/APJML-08-2017-0176
Longstreet, P., Brooks, S., Featherman, M., and Loiacono, E. (2022). Evaluating website quality: which decision criteria do consumers use to evaluate website quality? Inf. Technol. People 35, 1271–1297. doi:10.1108/ITP-05-2020-0328
Lu, C., and Hu, P. (2018). A literature review of the consumer cognitive miserlinessbehavior and its marketing implications: Based on theframework of the cue utilization theory. Foreign Econ. Manag. 40, 58–70. doi:10.16538/j.cnki.fem.2018.08.005
Ma, S.-C., Fan, Y., and Feng, L. (2017). An evaluation of government incentives for new energy vehicles in China focusing on vehicle purchasing restrictions. Energy Policy 110, 609–618. doi:10.1016/j.enpol.2017.07.057
Ma, S.-C., Fan, Y., Guo, J.-F., Xu, J.-H., and Zhu, J. (2019a). Analysing online behaviour to determine Chinese consumers’ preferences for electric vehicles. J. Clean. Prod. 229, 244–255. doi:10.1016/j.jclepro.2019.04.374
Ma, S.-C., Xu, J.-H., and Fan, Y. (2019b). Willingness to pay and preferences for alternative incentives to ev purchase subsidies: An empirical study in China. Energy Econ. 81, 197–215. doi:10.1016/j.eneco.2019.03.012
Ma, L. (2020). When love becomes hate: how different consumer-brand relationships interact with crises to influence consumers’ reactions. Corp. Commun. An Int. J. 25, 357–375. doi:10.1108/CCIJ-08-2019-0103
Martin, S. L., Javalgi, R. R. G., and Ciravegna, L. (2020). Marketing capabilities and international new venture performance: The mediation role of marketing communication and the moderation effect of technological turbulence. J. Bus. Res. 107, 25–37. doi:10.1016/j.jbusres.2019.09.044
MIIT (2021). Four ministries and commissions on further improving the financial subsidy policy for the promotion and application of new energy vehicles. [EB/OL]. Available at: https://www.miit.gov.cn/xwdt/gxdt/sjdt/art/2021/art_a42ae2cf64d34e0a9c4bf97a37b71c64.html (Accessed June 20, 2022).
MIIT (2022). Public announcement on the final review of the 2019-2020 new energy vehicle promotion and application subsidy funds clearance and the 2019-2021 subsidy funds pre-allocation. [EB/OL]. Available at: https://www.miit.gov.cn/jgsj/zbys/qcgy/art/2022/art_874ef28e22d244fab66b0b765facf84c.html (Accessed June 20, 2022).
MPS (2022). National ownership of new energy vehicles has exceeded 10 million units. [EB/OL]. Available at: https://app.mps.gov.cn/gdnps/pc/content.jsp?id=8451260&mtype (Accessed June 20, 2022).
Okada, T., Tamaki, T., and Managi, S. (2019). Effect of environmental awareness on purchase intention and satisfaction pertaining to electric vehicles in Japan. Transp. Res. Part D Transp. Environ. 67, 503–513. doi:10.1016/j.trd.2019.01.012
Olson, J. C., and Jacoby, J. (1972). Cue utilization in the quality perception process. Editor M. Venkatesan (Chicago, IL: Association for Consumer Research).
Ou, C., Pavlou, P., and Davison, R. M. (2014). Swift guanxi in online marketplaces: the role of computer-mediated communication technologies. MIS Q. 38, 209–230. doi:10.25300/MISQ/2014/38.1.10
Ouyang, D., Ou, X., Zhang, Q., and Dong, C. (2019). Factors influencing purchase of electric vehicles in China. Mitig. Adapt. Strateg. Glob. Chang. 25, 413–440. doi:10.1007/s11027-019-09895-0
Plananska, J. (2020). Touchpoints for electric mobility: Investigating the purchase process for promoting sales of electric vehicles in Switzerland. Energy Res. Soc. Sci. 69, 101745. doi:10.1016/j.erss.2020.101745
Potter, A., and Graham, S. (2019). Supplier involvement in eco-innovation: The co-development of electric, hybrid and fuel cell technologies within the Japanese automotive industry. J. Clean. Prod. 210, 1216–1228. doi:10.1016/j.jclepro.2018.10.336
Priessner, A., Sposato, R., and Hampl, N. (2018). Predictors of electric vehicle adoption: An analysis of potential electric vehicle drivers in austria. Energy Policy 122, 701–714. doi:10.1016/j.enpol.2018.07.058
Qiu, Y., Zhou, P., and Sun, H. (2019). Assessing the effectiveness of city-level electric vehicle policies in China. Energy Policy 130, 22–31. doi:10.1016/j.enpol.2019.03.052
Richardson, P. S., Dick, A. S., and Jain, A. K. (1994). Extrinsic and intrinsic cue effects on perceptions of store brand quality. J. Mark. 58, 28–36. doi:10.1177/002224299405800403
Saavedra Torres, J. L., Rawal, M., and Bagherzadeh, R. (2020). Role of brand attachment in customers’ evaluation of service failure. J. Prod. Brand Manag. 30, 377–391. doi:10.1108/JPBM-03-2019-2293
Tseng, T. H., and Lee, C. T. (2018). Facilitation of consumer loyalty toward branded applications: The dual-route perspective. Telematics Inf. 35, 1297–1309. doi:10.1016/j.tele.2018.03.002
van Berlo, Z. M., van Reijmersdal, E. A., Smit, E. G., and van der Laan, L. N. (2021). Brands in virtual reality games: Affective processes within computer-mediated consumer experiences. J. Bus. Res. 122, 458–465. doi:10.1016/j.jbusres.2020.09.006
Walsh, G., Beatty, S. E., and Holloway, B. B. (2015). Measuring client-based corporate reputation in b2b professional services: Scale development and validation. J. Serv. Mark. 29, 173–187. doi:10.1108/JSM-04-2014-0141
Wang, X., and Luo, Y. (2020). Has technological innovation capability addressed environmental pollution from the dual perspective of FDI quantity and quality? Evidence from China. J. Clean. Prod. 258, 120941. doi:10.1016/j.jclepro.2020.120941
Wang, N., Tang, L., Zhang, W., and Guo, J. (2019). How to face the challenges caused by the abolishment of subsidies for electric vehicles in China? Energy 166, 359–372. doi:10.1016/j.energy.2018.10.006
Wei, C.-L., and Ho, C.-T. (2019). Exploring signaling roles of service providers’ reputation and competence in influencing perceptions of service quality and outsourcing intentions. J. Organ. End. User Comput. 31, 86–109. doi:10.4018/joeuc.2019010105
Wolbertus, R., Kroesen, M., van den Hoed, R., and Chorus, C. G. (2018). Policy effects on charging behaviour of electric vehicle owners and on purchase intentions of prospective owners: Natural and stated choice experiments. Transp. Res. Part D Transp. Environ. 62, 283–297. doi:10.1016/j.trd.2018.03.012
Wu, L., Liu, H., and Zhang, J. (2017). Bricolage effects on new-product development speed and creativity: The moderating role of technological turbulence. J. Bus. Res. 70, 127–135. doi:10.1016/j.jbusres.2016.08.027
Wu, Y., Gu, F., Ji, Y., Guo, J., and Fan, Y. (2020). Technological capability, eco-innovation performance, and cooperative r&d strategy in new energy vehicle industry: Evidence from listed companies in China. J. Clean. Prod. 261, 121157. doi:10.1016/j.jclepro.2020.121157
Xiong, X., and Cheng, A. (2020). Evaluation of heavy commercial vehicles brand considering multi-attribute indexes in China. J. Syst. Sci. Inf. 8, 291–308. doi:10.21078/JSSI-2020-291-18
Xue, Y., Wu, J., Xie, D., Li, K., Zhang, Y., Wen, F., et al. (2015). Multi-agents modelling of EV purchase willingness based on questionnaires. J. Mod. Power Syst. Clean. Energy 3, 149–159. doi:10.1007/s40565-015-0112-4
Yan, Z., Huang, L., and Liu, X. (2016). Suppliers’ key capabilities industrial brand valueand purchasers’ repurchase intention. J. Manag. Sci. 29, 15–27.
You, L., and Hon, L. C. (2021). Testing the effects of reputation, value congruence and brand identity on word-of-mouth intentions. J. Commun. Manag. 25, 160–181. doi:10.1108/JCOM-10-2020-0119
Yu, H., and Zhu, Q. (2020). Research on influence and mechanism of external clues oncustomers’ online purchase intention of agriculturalproducts with geographical indications. China Bus. Mark. 08, 37–47. doi:10.14089/j.cnki.cn11-3664/f.2020.08.004
Yuan, X., Liu, X., and Zuo, J. (2015). The development of new energy vehicles for a sustainable future: A review. Renew. Sustain. Energy Rev. 42, 298–305. doi:10.1016/j.rser.2014.10.016
Yun, S., Lee, J., and Lee, S. (2019). Technology development strategies and policy support for the solar energy industry under technological turbulence. Energy Policy 124, 206–214. doi:10.1016/j.enpol.2018.09.003
Zeng, M., Lin, Q., Pan, H., and Zhu, J. (2017). The relationship among information technology capability, trust and supply chain integration. Manag. Rev. 29, 217–225. doi:10.14120/j.cnki.cn11-5057/f.2017.12.020
Keywords: new energy vehicle, cue utilization theory, travel quality, brand value, technological turbulence, purchase intention
Citation: Lu Z and Cai Z (2023) Cueing roles of new energy vehicle manufacturers’ technical capability and reputation in influencing purchase intention in China. Front. Energy Res. 10:1032934. doi: 10.3389/fenrg.2022.1032934
Received: 31 August 2022; Accepted: 08 November 2022;
Published: 17 January 2023.
Edited by:
Furkan Ahmad, Hamad Bin Khalifa University, QatarReviewed by:
Daoyan Guo, Xi’an University of Science and Technology, ChinaArry Widodo, Telkom University, Indonesia
Copyright © 2023 Lu and Cai. This is an open-access article distributed under the terms of the Creative Commons Attribution License (CC BY). The use, distribution or reproduction in other forums is permitted, provided the original author(s) and the copyright owner(s) are credited and that the original publication in this journal is cited, in accordance with accepted academic practice. No use, distribution or reproduction is permitted which does not comply with these terms.
*Correspondence: Zhigang Lu, emdsdUBzaG10dS5lZHUuY24=