
94% of researchers rate our articles as excellent or good
Learn more about the work of our research integrity team to safeguard the quality of each article we publish.
Find out more
ORIGINAL RESEARCH article
Front. Energy Res. , 02 November 2022
Sec. Energy Storage
Volume 10 - 2022 | https://doi.org/10.3389/fenrg.2022.1032660
This article is part of the Research Topic New energy and energy storage system control of lithium-ion battery View all 5 articles
A correction has been applied to this article in:
Corrigendum: An improved deep extreme learning machine to predict the remaining useful life of lithium-ion battery
To aim at the problem of inaccurate prediction of the remaining useful life of the lithium-ion battery, an improved grey wolf optimizer optimizes the deep extreme learning machine (CGWO-DELM) data-driven forecasting method is proposed. This method uses the grey wolf optimization algorithm based on an adaptive normal cloud model to optimize the bias of the deep extreme learning machine, the weight of the input layer, the selection of activation function, and the number of hidden layer nodes. In this article, indirect health factors that can characterize the degradation of battery performance are extracted from the discharge process, and the correlation between them and capacity is analyzed using the Pearson coefficient and Kendel coefficient. Then, the CGWO-DELM prediction model is constructed to predict the capacitance of the lithium-ion battery. The remaining useful life of lithium-ion batteries is indirectly predicted with a 1.44 A·h failure threshold. The prediction results are compared with deep extreme learning machines, long-term memory, other prediction methods, and the current public prediction methods. The results show that the CGWO-DELM prediction method can more accurately predict the remaining useful life of lithium-ion batteries.
The lithium-ion battery is a rechargeable battery, usually used in portable electronic equipment and electric vehicles (Venugopal, 2019), and is widely used in the military and aerospace fields. In the process of use, with the increase in charge and discharge times and the temperature change, the performance of the lithium-ion battery will gradually decrease, which further affects its safety and service life. There may even be safety incidents such as fires and explosions. Long-term use may affect people’s life and property safety. Therefore, it is of great significance to study the remaining functional life prediction of lithium-ion batteries.
At present, there are three main prediction methods for lithium-ion battery remaining useful life (RUL): mechanism-based model (Fang et al., 2021), semi-empirical model (Varini et al., 2019), and data-driven model (Ali et al., 2022; Pugalenthi et al., 2022). The mechanism-based prediction method is to establish a degradation model by analyzing the internal structure of the lithium-ion battery, which can be divided into three categories: electrochemical model, equivalent circuit model, and empirical model. The semi-empirical model has a small amount of calculation and is suitable for general use scenarios. The data-driven prediction method does not need to analyze the internal structure of the lithium-ion battery. It constructs a degradation model to predict the RUL of lithium-ion batteries by analyzing the operational data of lithium-ion batteries detected in real-time, including an artificial neural network (Qin et al., 2019; Driscoll et al., 2022), support vector machine (Feng et al., 2019) and other prediction methods.
Lithium-ion batteries are widely used in many fields. Hu et al. (2020) identify and discuss upcoming challenges and future research directions. The prediction of RUL for Li-ion batteries has become a research hotspot, and the prediction of RUL for the lithium-ion battery has become a research hotspot. In order to reduce the noise of capacitance data, Zhang et al. (2015) used wavelet analysis to reduce noise, improved the relevance vector machine (RVM) by differential evolution, and proposed a new prediction method. Pugalenthi et al. (2022) used the neural network with adaptive Bayesian for solving the problem that the optimization algorithm is easy to fall into optimum local learning to predict the remaining useful life of the lithium-ion battery. Lyu et al. (2022) simultaneously estimated the health status and predicted the remaining useful life of lithium-ion batteries through the optimized relevance vector machine framework. To solve the problem that particle filter (PF) cannot update particle weight and particle degradation in the prediction stage, Zhang et al. (2020) used the F distribution particle filter and kernel smoothing algorithm to predict the remaining useful life of aircraft lithium-ion battery. For example, Chen et al. (2021) presented a hybrid algorithm combining BLS and RVM, which broadens the research direction of the hybrid prediction method for lithium-ion battery life. To improve state of health (SOH) estimation and RUL prediction, Li et al. (2020) put forward a variant long short-term memory neural network. By further extracting the health index of battery aging, the improved extreme learning machine (ELM) is used to complete the feature extraction and is more competitive than other algorithms (Tang and Yuan, 2021). Hailin Feng et al. gave improved Gaussian process regression for SOH and RUL prediction of lithium-ion batteries (Feng and Shi, 2021). Aiming at the problems of low long-term prediction accuracy, unstable model output, and complicated selection of key parameters, Yufan Ji et al. proposed an adaptive differential evolution algorithm to optimize the prediction method of the monotone echo state network (Ji et al., 2021). Zhang et al. (2018) completed the prediction of the remaining lifetime of Li-ion using a long and short-term memory cycle neural network to assess the reliability of Li-ion batteries. To prevent surprises, Jiang et al. (2021) used a multicore support vector machine to optimize the parameters for predicting the cyclic aging of Li-ion batteries. In order to enhance the prediction accuracy of the remaining lifetime of Li-ion, Wang et al. (2022) designed a bi-directional long and short-term memory model based on the attention mechanism to accomplish the prediction of the remaining lifetime of Li-ion. Rouhi Ardeshiri and Ma, (2021) designed a gated cyclic unit-cyclic neural network to manage the improvement and optimization of Li-ion batteries. Kim et al. (2021) designed a novel practical life cycle prediction method based on the entropy estimation of lithium-ion batteries, which has an accuracy of at least 94%. To reduce the cost of cycle life testing, Wang et al. (2022) used deep reinforcement learning to predict the long-term degradation trend of lithium-ion batteries. Li et al. (2019) proposed a new hybrid Elman-LSTM method that combines an empirical model decomposition algorithm with long and short-term memory and Elman neural networks for remaining battery life prediction. Chen et al. (2022) designed a Transformer-based neural network to accomplish the prediction of the remaining life of lithium ions. To better improve the generalisability of lithium-ion prediction algorithms, Kim et al. (2021) proposed a deep learning-based method for predicting the health of lithium-ion batteries.
The Grey wolf optimizer (GWO) (Mirjalili et al., 2014) is an efficient group intelligence-like metaheuristic algorithm. However, it has the disadvantage of slow convergence and easily falls into local optimal solutions. The grey wolf optimization algorithm based on the adaptive normal cloud model (CGWO) (Zhang et al., 2021) can effectively solve these problems. Extreme learning machine (ELM) (Samal and Dash, 2021) is a very popular class of machine learning algorithms. In the past decade or so, the theory and applications of ELM have been widely studied. From the perspective of learning efficiency, extreme learning machines have the advantages of few training parameters, fast learning speed, and strong generalization capability. The combination of ELM and deep learning produces a deep extreme learning machine (DELM) (An et al., 2022), which significantly improves learning speed and other aspects and can solve the prediction problem more effectively. However, the selection of hyperparameters of DELM affects its prediction effect, and the improper selection of hyperparameters can lead to poor prediction accuracy. Hence, this paper proposes a new method for indirectly predicting the remaining useful life of lithium-ion batteries by optimizing the hyperparameters of a deep extreme learning machine using an improved grey wolf optimization algorithm to predict the capacitance of lithium-ion batteries. By comparing and analyzing the prediction results of the proposed CGWO-DELM and SVR, BP, LSTM, and DELM, it can be concluded that the proposed method can predict the remaining useful life of lithium-ion batteries more accurately. The main contributions of this paper are as follows.
(1) Optimized hyper-parameters of deep extreme learning machine using grey wolf optimizer based on cloud-normal model.
(2) Proposed new health factors.
(3) Predicted the remaining useful life of lithium-ion batteries using the proposed method.
(4) Validated the performance of the proposed prediction method.
(5) Compared with widely known prediction methods and publicly available prediction results.
An extreme learning machine (ELM) is a new single hidden layer feedforward neural network learning algorithm. The parameters between the hidden layer and other layers are randomly established without adjustment (Samal and Dash, 2021). ELM maintains good approximation capability, fast training speed, less manual intervention, strong generalization capability, etc.
The sample ensemble of model inputs and outputs is hypothesized to be
The hidden layer output of ELM is
where
Based on satisfying the error requirements, if the output of ELM can gradually approach the output sample
where,
if the least square solution of
where
In the face of large data samples, ELM cannot achieve satisfactory results. Since the weights and biases in the whole model are randomly generated, it may cause some neuron nodes to fail, thus affecting the prediction effect of the model. Therefore, Huang et al. combined deep learning with extreme learning machines and introduced the concept of an automatic encoder based on ELM (An et al., 2022). The extreme learning machine of multi-layer structure is constructed, namely the deep extreme learning machine (DELM).
DELM is a derivative algorithm of ELM, which is equivalent to connecting multiple ELMs with equal dimensions. DELM adopts the ELM automatic encoder in unsupervised learning mode to train the parameters of the multi-layer neural network model layer by layer and incorporates the feature that ELM parameters do not need fine tuning so that the learning speed is much faster.
DELM is established based on a multi-layer network structure, which is divided into two parts: unsupervised hierarchical feature representation and supervised feature classification. This paper improves DELM for regression prediction, involving “unsupervised hierarchical feature representation.” “Unsupervised hierarchical feature representation” is an automatic encoder based on ELM, which is used to extract multi-layer sparse features of input data. Before unsupervised feature learning, the original input data should be transformed into ELM random feature space. It helps to extract the hidden information in the training samples. Then, an
where
The automatic encoder uses the coded output and restores the original input by minimizing the reconstruction error. Mapping input data
Most grey wolves like to live in groups, with an average of 5–12 wolves in each group. They have a strict social hierarchy. Grey Wolf Optimizer (GWO) is a swarm intelligence optimization algorithm inspired by grey wolf hunting activities (Mirjalili et al., 2014). This algorithm has the advantages of strong convergence, fewer parameters, and easy realization.
Three grey wolves with the best fitness in the wolves are marked as
The optimization process of GWO is mainly guided by the three best solutions (
The grey wolf searches for prey and surrounds it, which is expressed in Eq. 11 and Eq. 12. Eq. 11 is used to calculate the distance between individuals and prey. Eq. 12 is the position update formula of the grey wolf.
where
where
Wolf
In the process of simulating the grey wolf search, all search positions are updated according to the position of the current three optimal solutions. The mathematical model of grey wolf individual tracking prey position is described as follows:
where
where
The Grey wolf optimization algorithm based on the adaptive normal cloud model (CGWO) uses Tent mapping to generate the initial grey wolf population (Zhang et al., 2021). The cloud model has three mathematical parameters of expectation
A forward normal cloud generator is an algorithm for generating cloud droplets that obey the normal distribution, which can be defined in the following form:
where
The normal cloud model is introduced based on Tent mapping for population initialization. The wolf group position update mechanism is explored with the initial optimal position as the expectation of the normal cloud model. The update formula is expressed as
where
where
The bias and input layer weights of extreme learning machine-autoencoder (ELM-AE) are randomly generated orthogonal matrices during the pre-training process. Moreover, the bias and input layer weights are not updated when the parameters are updated, which results in the prediction effect of DELM being affected by the random bias and random input layer weights of each ELM-AE.
In order to optimize the performance of DELM, the CGWO-DELM prediction method is proposed for lithium-ion battery RUL prediction using CGWO to optimize the bias of DELM, the input layer weights, the selection of activation function, and the number of hidden layer nodes. The flow of the proposed algorithm is shown in Figure 6, and its main steps are as follows.
(1) Data pre-processing: The raw data is pre-processed, and the processed data is divided into training and test sets.
(2) Model parameter setting: The population size is 30, and the number of iterations is 100 in CGWO. The number of hidden layers is 2, the number of hidden layers is 1–5, the bias and input layer weights are 0–1, and the activation functions are chosen from
(3) Fitness function setting: The mean square error (MSE) between the actual and predicted capacity values is used as the fitness function, i.e.,
where
(4) CGWO optimizes DELM: Tent mapping was used to initialize the grey wolf population. After that, the fitness value of each wolf is calculated, and the position of each grey wolf is updated. The CGWO-DELM prediction model is constructed by iterating continuously until the maximum number of iterations is reached, the best parameters are output, and the best parameters are used to construct the CGWO-DELM prediction model.
(5) Remaining life prediction of lithium-ion batteries: The trained model is validated with test data to complete the RUL prediction for lithium-ion batteries.
In the actual work of the battery, it is difficult to obtain the direct parameters such as capacity and internal resistance, which not only requires much money but also ensures the reliability of the parameter extraction environment, which undoubtedly increases the difficulty of the experiment. Therefore, indirect data that can be directly observed and are not affected by the environment are usually used for lithium-ion battery RUL prediction.
This article uses data from NASA’s 18,650 battery aging dataset. NASA conducted a total of nine aging cycles of lithium-ion batteries. These data are available at: http://ti.arc.nasa.gov/project/prognostic-data-repository. Each group consisted of three or four lithium cobaltate batteries with a rated capacity of 2 A·h. Each charge and discharge cycle included three parts: charging, discharging, and impedance measurement. The battery continuously conducts charge-discharge cycle test experiments until it reaches the life failure threshold. Nine sets of battery-specific experimental data are shown in Table 1, including temperature (T), cut-off voltage (CV), charging current (CC), discharge current (DC), and termination threshold (TT).
It can be seen from the experimental data in Table 1 that the first group meets the experimental conditions of the conventional charge-discharge cycling test, which can obtain better capacity degradation characteristics. The other groups change the experimental conditions, such as temperature or discharge current, which accelerates the aging experiment and does not conform to the performance degradation trend of lithium-ion batteries under normal conditions. Moreover, the first group of experiments ended with the batteries reaching end-of-life, while the other groups either had decayed or were discharged, with some batteries having particularly low discharge capacities, which had a greater impact on the experiments. Therefore, this paper adopts the representative first group of lithium-ion battery data set for research.
Due to the influence of various factors in the use of lithium-ion batteries, the voltage and current of lithium-ion batteries will be affected to a certain extent. The use of these parameters as health factors has certain limitations. Considering the feasibility of the health factor and the working process of lithium-ion batteries, this paper selects the time when the voltage is reduced from 3.8 V to 3.5 V (M1). When the temperature increases from 32°C to 36°C (M2), the voltage load is reduced from 2.8 V to 2.5 V (M3) as the health factor, which predicts the residual capacity of the battery. It can obtain the remaining useful life of the lithium-ion battery. The curves of each health factor are shown in Figure 7.
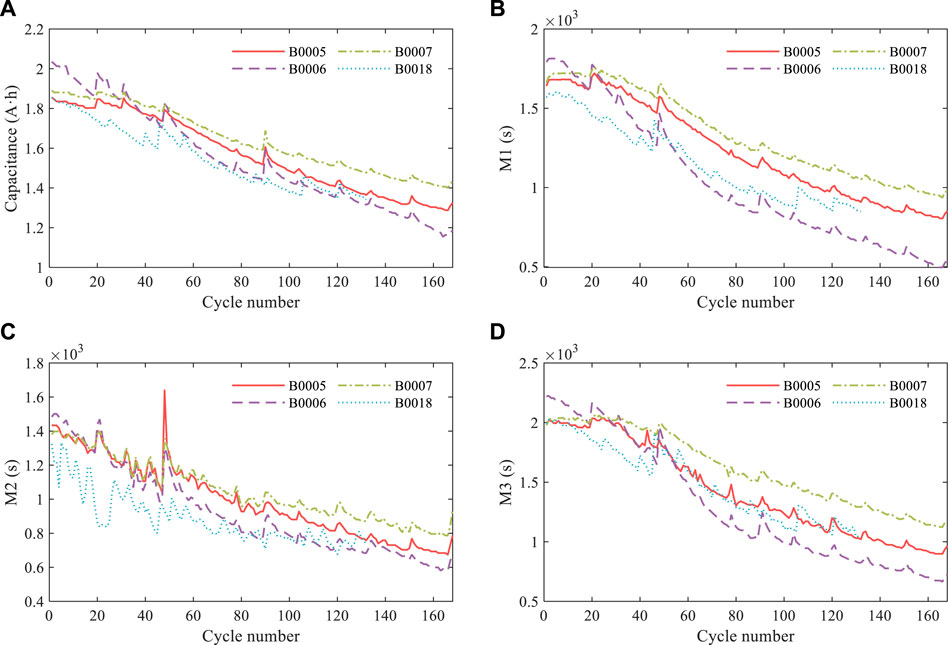
FIGURE 7. Health factor curve. (A) Variation of capacitance with the number of cycles. (B) Variation of health factor M1 with the number of cycles. (C) Variation of health factor M2 with the number of cycles. (D) Variation of health factor M3 with the number of cycles.
In statistics, covariance is usually used to reflect the correlation between the two random variables. Pearson correlation coefficient is a method to calculate the correlation. It is assumed that there are two variables
where
The Kendall coefficient is used in the order and interval variables, which does not meet the normal assumption. Because the capacitance and health factor data of lithium-ion batteries do not meet the normal distribution, the method is more suitable. The Kendall coefficient is defined as:
where
The values in Table 2 correspond to the correlation coefficient between the health factor and the capacitance of the fixed cell. If the correlation coefficient obtained is greater than 0.9 and less than 1, then the data is strongly correlated. It can be seen from the data in Table 2 that whether the Pearson coefficient or the Kendell coefficient is used for analysis, the capacitances of the four batteries are highly correlated with the health factors extracted in this paper, which can be used as health factors.
In order to test the superiority of the proposed method, the 18,650 lithium cobaltate battery aging data set provided by NASA is used for experimental verification and compared with BP, DELM, LSTM, and SVR methods. Due to the partial lack of B0018 battery data, this paper uses the first 60 cycles of B0005, B0006, and B0007 batteries and the first 45 cycles of B0018 batteries (the first 60 cycles of experimental batteries), the first 80 cycles of B0005, B0006, B0007 batteries and the first 60 cycles of B0018 batteries (the first 80 cycles of experimental batteries) as the training set for model training, and uses the remaining data as the test set for prediction. Since the capacitance data of the B0007 battery does not decrease to 70% (1.4 A·h) of the rated capacitance (Xu et al., 2021), 1.44 A·h is used as the failure threshold for four lithium batteries in this paper.
In order to comprehensively evaluate these five prediction methods, root mean square error (RMSE), mean absolute percentage error (MAPE), and mean absolute error (MAE) were used as evaluation indexes.
MAPE is defined as
MAE is defined as
This paper implements all algorithms on a 64-bit Windows 10 computer using MATLAB R2018b. The performance of the algorithm is compared to the mean value obtained by 50 independent runs. The parameter settings for the algorithm used are shown in Table 3.
The prediction results of the first 60 cycles of the experimental battery as the training set are shown in Figure 8. The prediction results of CGWO-DELM and the other four methods are shown in Table 4. The evaluation indexes are shown in Table 5. “−” indicates that the prediction method does not reach the failure threshold, and the predicted value and absolute error of lithium-ion RUL cannot be calculated.
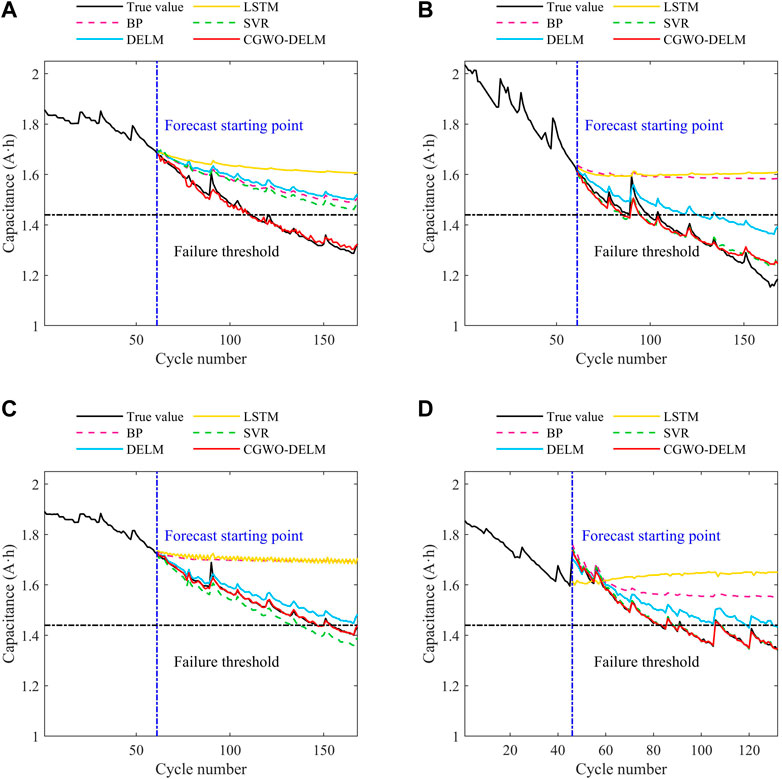
FIGURE 8. RUL prediction results of lithium-ion battery by CGWO-DELM and four other prediction methods (the first 60 cycles of data are used as the training set). (A) Battery B0005. (B) Battery B0006. (C) Battery B0007. (D) Battery B0018.
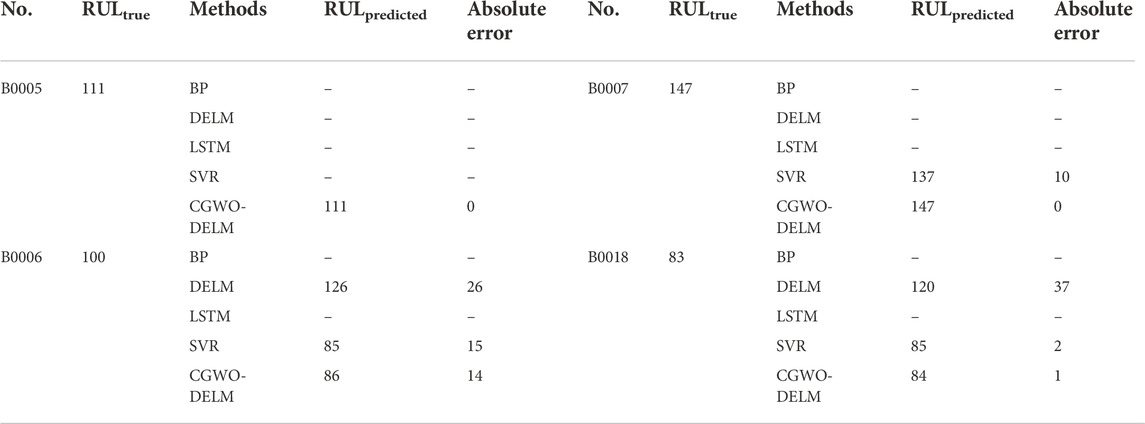
TABLE 4. Comparison of prediction results (the first 60 cycles of data are used as the training set).
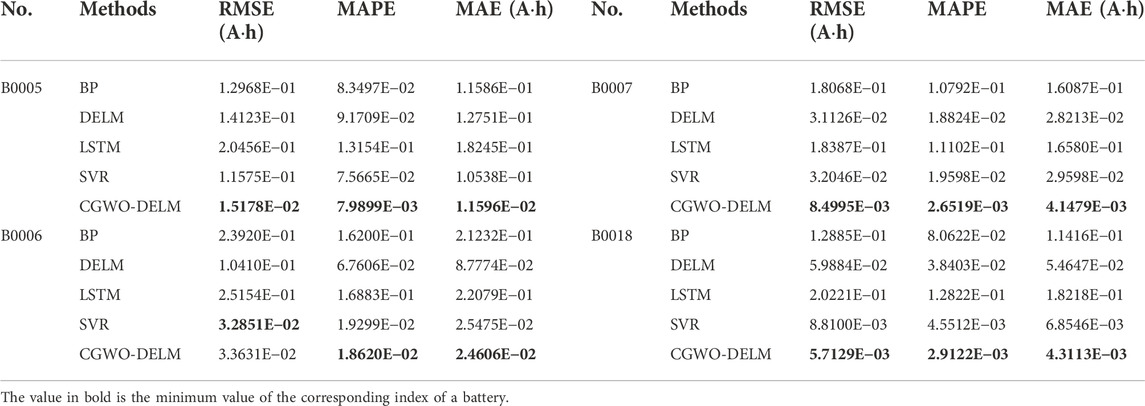
TABLE 5. Comparison of evaluation indexes (the first 60 cycles of data are used as the training set).
It can be seen from Table 4 that for the B0005 lithium-ion battery, the absolute error of CGWO-DELM prediction is 0, while other prediction methods do not reach the failure threshold. For the B0006 lithium-ion battery, BP and LSTM do not reach the failure threshold, and CGWO-DELM has the smallest absolute error. For B0007 lithium-ion batteries, BP, DELM, and LSTM do not reach the failure threshold, the absolute error of CGWO-DELM prediction is 0, and the absolute error of SVR prediction is 10. For the B0018 lithium-ion battery, BP and LSTM do not reach the failure threshold, and the absolute error predicted by CGWO-DELM is the smallest.
Table 5 shows that the MSE, MAPE, and MAE of CGWO-DELM on B0005, B0007, and B0018 lithium-ion batteries are the smallest, and the MAPE and MAE of CGWO-DELM on B0006 lithium-ion batteries are the smallest. The MSE of SVR on the B0006 lithium-ion battery was the smallest, 3.2851E−02, followed by CGWO-DELM, 3.3631E-02. Therefore, the prediction error of CGWO-DELM is smaller.
The prediction results of the first 80 cycles of the experimental battery as the training set are shown in Figure 9. The prediction results of CGWO-DELM and the other four methods are shown in Table 6, and the evaluation indexes are shown in Table 7. “−” indicates that the prediction method does not reach the failure threshold, and the predicted value and absolute error of lithium-ion RUL cannot be calculated.
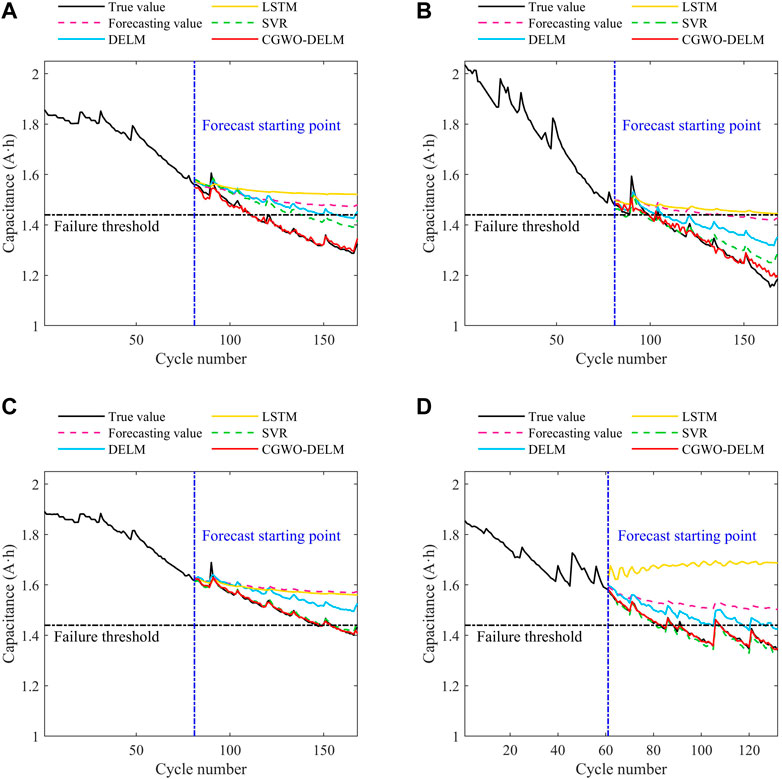
FIGURE 9. RUL prediction results of lithium-ion battery by CGWO-DELM and four other prediction methods (the first 80 cycles of data are used as the training set). (A) Battery B0005. (B) Battery B0006. (C) Battery B0007. (D) Battery B0018.
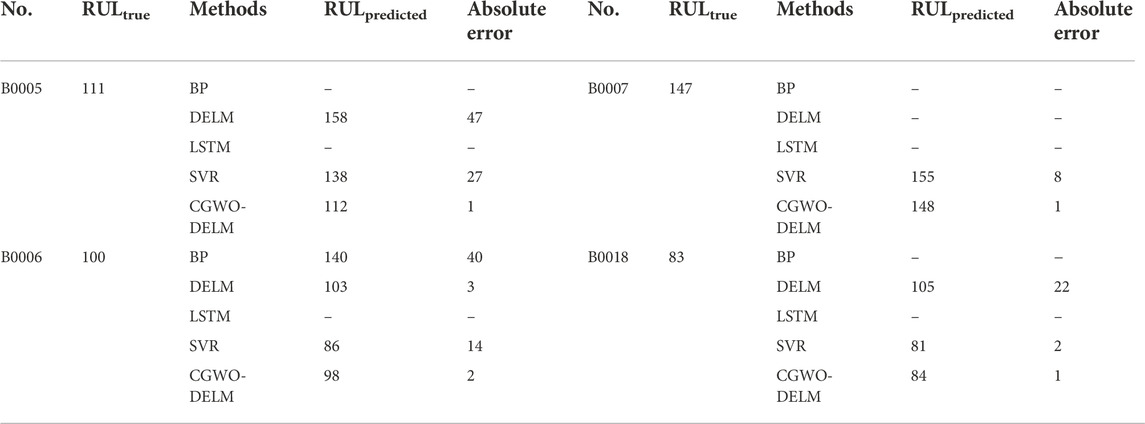
TABLE 6. Comparison of prediction results (the first 80 cycles of data are used as the training set).
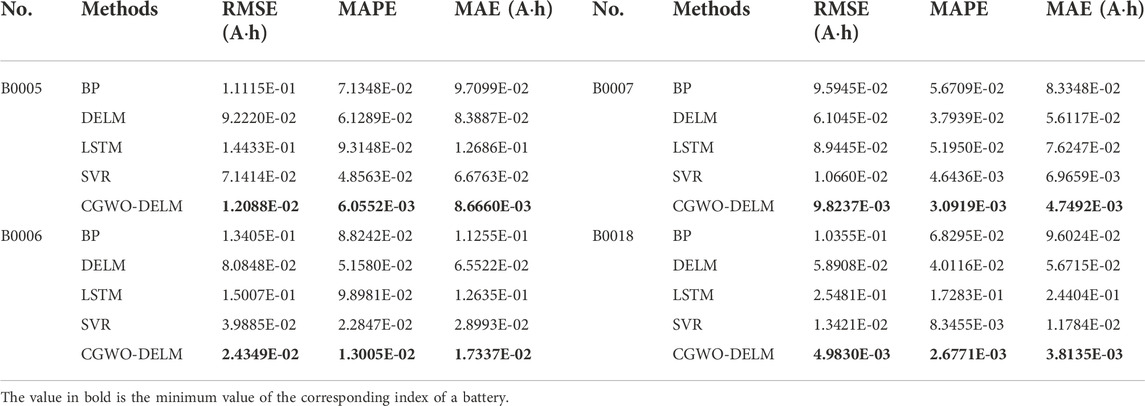
TABLE 7. Comparison of evaluation indexes (the first 80 cycles of data are used as the training set).
Table 6 shows that for the B0005 lithium-ion battery, BP and LSTM do not reach the failure threshold, the absolute error predicted by CGWO-DELM is 1, and the absolute error predicted by DELM and SVR is 47 and 27, respectively. For the B0006 lithium-ion battery, LSTM did not reach the failure threshold, and CGWO-DELM had the smallest absolute error. For the B0007 lithium-ion battery, BP, DELM, and LSTM do not reach the failure threshold. The absolute error of CGWO-DELM prediction is 1, while that of SVR prediction is 8. For the B0018 lithium-ion battery, BP and LSTM do not reach the failure threshold, and the absolute error predicted by CGWO-DELM is the smallest.
It can be seen from Table 7 that the MSE, MAPE, and MAE of CGWO-DELM on four lithium-ion batteries are the smallest. Thus, the prediction results obtained by CGWO-DELM are more accurate.
In order to further verify the performance of the proposed prediction method, CGWO-DELM is compared with the existing literature. When the first 80 cycles of the B0005, B0006, and B0007 battery and the first 60 cycles of the B0018 battery are used as training sets, the comparison results between CGWO-DELM and other prediction methods (Li et al., 2019; Xu et al., 2021; Ding et al., 2022; Gao et al., 2022; Huang et al., 2022) are shown in Table 8.
CGWO-DELM outperforms other open prediction methods in RMSE and MAE of all batteries under the same prediction starting point. Therefore, the CGWO-DELM method can obtain higher prediction accuracy.
Lithium-ion batteries are widely used in various problems, such as electric vehicles, due to their superior performance. It is essential to predict the remaining useful life of lithium-ion batteries accurately. In order to solve the problem of inaccurate prediction of the remaining useful life of lithium-ion batteries, three new health factors are proposed, and the correlation between the proposed health factors and the battery capacity is verified using the Pearson coefficient and Kendall coefficient. Besides, an improved grey wolf optimizer is proposed to optimize the prediction method of the deep extreme learning machine (CGWO-DELM), and the performance of CGWO-DELM is verified using the NASA battery degradation dataset. Finally, CGWO-DELM is compared with BP, DELM, SVR, and LSTM prediction methods, and the excellent performance of CGWO-DELM is verified by comparative analysis with publicly available prediction data. The results show that the proposed CGWO-DELM prediction method can provide higher prediction accuracy for the remaining useful life of lithium-ion batteries.
In future work, this study will improve on the prediction method proposed in this paper and investigate the data processing to extract the external characteristic parameters with strong correlation to achieve a more accurate online prediction of the remaining service life of lithium-ion batteries.
The data analyzed in this study is subject to the following licenses/restrictions: NASA-supplied 18650 battery aging dataset. Requests to access these datasets should be directed to YG, gaoyuansheng2021@163.com.
YG: Conceptualization, Methodology, Software, Validation, Investigation, Data curation, Writing—original draft, Writing—review and editing, Visualization, Supervision, Project administration. CL: Software, Formal analysis, Data curation, Writing—original draft, Visualization. LH: Writing—original draft, Writing—review and editing, Visualization.
This work was supported in part by the 2022 Liaoning College Students' Innovative Entrepreneurial Training Plan Program (Project Number: S202210147033).
The authors declare that the research was conducted in the absence of any commercial or financial relationships that could be construed as a potential conflict of interest.
All claims expressed in this article are solely those of the authors and do not necessarily represent those of their affiliated organizations, or those of the publisher, the editors and the reviewers. Any product that may be evaluated in this article, or claim that may be made by its manufacturer, is not guaranteed or endorsed by the publisher.
Ali, M. U., Zafar, A., Masood, H., Kallu, K. D., Khan, M. A., Tariq, U., et al. (2022). A hybrid data-driven approach for multistep ahead prediction of state of health and remaining useful life of lithium-ion batteries. Comput. Intell. Neurosci. 2022, 1–14. doi:10.1155/2022/1575303
An, G., Chen, L., Tan, J., Jiang, Z., Li, Z., and Sun, H. (2022). Ultra-short-term wind power prediction based on PVMD-ESMA-DELM. Energy Rep. 8, 8574–8588. doi:10.1016/j.egyr.2022.06.079
Chen, D., Hong, W., and Zhou, X. (2022). Transformer network for remaining useful life prediction of lithium-ion batteries. IEEE Access 10, 19621–19628. doi:10.1109/access.2022.3151975
Chen, Z., Shi, N., Ji, Y., Niu, M., and Wang, Y. (2021). Lithium-ion batteries remaining useful life prediction based on BLS-RVM. Energy 234, 121269. doi:10.1016/j.energy.2021.121269
Ding, H., Huang, K., and Tian, H. J. (2022). Prediction of remaining service life of lithium-ion battery based on VMD and ISSA-ELM. J. Power Supply, 1–11.
Driscoll, L., de la Torre, S., and Gomez-Ruiz, J. A. (2022). Feature-based lithium-ion battery state of health estimation with artificial neural networks. J. Energy Storage 50, 104584. doi:10.1016/j.est.2022.104584
Fang, X., He, Y., Fan, X., Zhang, D., and Hu, H. (2021). Modeling and simulation in capacity degradation and control of all-solid-state lithium battery based on time-aging polymer electrolyte. Polymers 13 (8), 1206. doi:10.3390/polym13081206
Feng, H., and Shi, G. (2021). SOH and RUL prediction of Li-ion batteries based on improved Gaussian process regression. J. Power Electron. 21 (12), 1845–1854. doi:10.1007/s43236-021-00318-5
Feng, X., Weng, C., He, X., Han, X., Lu, L., Ren, D., et al. (2019). Online state-of-health estimation for Li-ion battery using partial charging segment based on support vector machine. IEEE Trans. Veh. Technol. 68 (9), 8583–8592. doi:10.1109/tvt.2019.2927120
Gao, D., Liu, X., and Yang, Q. (2022). Remaining useful life prediction of lithium-ion battery based on CNN and BiLSTM fusion. Inf. Control 51 (3), 318–329.
Hu, X., Xu, L., Lin, X., and Pecht, M. (2020). Battery lifetime prognostics. Joule 4 (2), 310–346. doi:10.1016/j.joule.2019.11.018
Huang, K., Ding, H., Guo, Y., and Tian, H. (2022). Prediction of remaining useful life of lithium-ion battery based on adaptive data preprocessing and long short-term memory network. T China Electrotech. Soc. 37 (7), 57–70.
Ji, Y., Chen, Z., Shen, Y., Yang, K., Wang, Y., and Cui, J. (2021). An RUL prediction approach for lithium-ion battery based on SADE-MESN. Appl. Soft Comput. 104, 107195. doi:10.1016/j.asoc.2021.107195
Jiang, B., Dai, H., Wei, X., and Jiang, Z. (2021). Multi-kernel relevance vector machine with parameter optimization for cycling aging prediction of lithium-ion batteries. IEEE J. Emerg. Sel. Top. Power Electron., 1. doi:10.1109/jestpe.2021.3133697
Kim, S., Choi, Y. Y., Kim, K. J., and Choi, J. I. (2021). Forecasting state-of-health of lithium-ion batteries using variational long short-term memory with transfer learning. J. Energy Storage 41, 102893. doi:10.1016/j.est.2021.102893
Kim, T. K., and Moon, S. C. (2021). Novel practical life cycle prediction method by entropy estimation of Li-ion battery. Electronics 10 (4), 487. doi:10.3390/electronics10040487
Li, L. L., Liu, Z. F., Tseng, M. L., and Chiu, A. S. (2019). Enhancing the Lithium-ion battery life predictability using a hybrid method. Appl. Soft Comput. 74, 110–121. doi:10.1016/j.asoc.2018.10.014
Li, P., Zhang, Z., Xiong, Q., Ding, B., Hou, J., Luo, D., et al. (2020). State-of-health estimation and remaining useful life prediction for the lithium-ion battery based on a variant long short term memory neural network. J. power sources 459, 228069. doi:10.1016/j.jpowsour.2020.228069
Li, X., Zhang, L., Wang, Z., and Dong, P. (2019). Remaining useful life prediction for lithium-ion batteries based on a hybrid model combining the long short-term memory and Elman neural networks. J. Energy Storage 21, 510–518. doi:10.1016/j.est.2018.12.011
Lyu, Z., Wang, G., and Gao, R. (2022). Synchronous state of health estimation and remaining useful lifetime prediction of Li-Ion battery through optimized relevance vector machine framework. Energy 251, 123852. doi:10.1016/j.energy.2022.123852
Mirjalili, S., Mirjalili, S. M., and Lewis, A. (2014). Grey wolf optimizer. Adv. Eng. Softw. 69, 46–61. doi:10.1016/j.advengsoft.2013.12.007
Pugalenthi, K., Park, H., Hussain, S., and Raghavan, N. (2022). Remaining useful life prediction of lithium-ion batteries using neural networks with adaptive bayesian learning. Sensors 22 (10), 3803. doi:10.3390/s22103803
Qin, W., Lv, H., Liu, C., Nirmalya, D., and Jahanshahi, P. (2019). Remaining useful life prediction for lithium-ion batteries using particle filter and artificial neural network. Industrial Manag. Data Syst. 120, 312–328. doi:10.1108/imds-03-2019-0195
Rouhi Ardeshiri, R., and Ma, C. (2021). Multivariate gated recurrent unit for battery remaining useful life prediction: A deep learning approach. Int. J. Energy Res. 45 (11), 16633–16648. doi:10.1002/er.6910
Samal, S., and Dash, R. (2021). A hybrid fruit fly ELM framework for stock index price movement prediction. In 2021 International Conference in Advances in Power, Signal, and Information Technology (APSIT) (pp. 1–5). 08-10 October 2021. Bhubaneswar, India. IEEE
Tang, T., and Yuan, H. (2021). The capacity prediction of Li-ion batteries based on a new feature extraction technique and an improved extreme learning machine algorithm. J. Power Sources 514, 230572. doi:10.1016/j.jpowsour.2021.230572
Varini, M., Campana, P. E., and Lindbergh, G. (2019). A semi-empirical, electrochemistry-based model for Li-ion battery performance prediction over lifetime. J. Energy Storage 25, 100819. doi:10.1016/j.est.2019.100819
Venugopal, P., and T., V. (2019). State-of-Health estimation of li-ion batteries in electric vehicle using IndRNN under variable load condition. Energies 12 (22), 4338. doi:10.3390/en12224338
Wang, C., Ding, Y., Yan, N., Ma, L., Ma, J., Lu, C., et al. (2022). A novel Long-term degradation trends predicting method for Multi-Formulation Li-ion batteries based on deep reinforcement learning. Adv. Eng. Inf. 53, 101665. doi:10.1016/j.aei.2022.101665
Wang, F. K., Amogne, Z. E., Chou, J. H., and Tseng, C. (2022). Online remaining useful life prediction of lithium-ion batteries using bidirectional long short-term memory with attention mechanism. Energy 254, 124344. doi:10.1016/j.energy.2022.124344
Xu, J., Ni, Y., and Zhu, C. (2021). Remaining useful life prediction for lithium-ion batteries based on improved support vector regression. Trans. China Electrotech. Soc. 36 (17), 3693–3704.
Zhang, C., He, Y., Yuan, L., Xiang, S., and Wang, J. (2015). Prognostics of lithium-ion batteries based on wavelet denoising and DE-RVM. Comput. Intell. Neurosci. 2015, 1–8. doi:10.1155/2015/918305
Zhang, K., Peng, Z. H. A. O., Canfei, S. U. N., Youren, W. A. N. G., and Zewang, C. H. E. N. (2020). Remaining useful life prediction of aircraft lithium-ion batteries based on F-distribution particle filter and kernel smoothing algorithm. Chin. J. Aeronautics 33 (5), 1517–1531. doi:10.1016/j.cja.2020.01.007
Zhang, T., Rao, S., and Zhang, S. (2021). Grey wolf optimizer based on adaptive normal cloud model. Control Decis. 36 (10), 2562–2568.
Keywords: lithium-ion battery, remaining useful life, data-driven forecasting method, deep extreme learning machine, grey wolf optimization algorithm based on the adaptive normal cloud model
Citation: Gao Y, Li C and Huang L (2022) An improved deep extreme learning machine to predict the remaining useful life of lithium-ion battery. Front. Energy Res. 10:1032660. doi: 10.3389/fenrg.2022.1032660
Received: 31 August 2022; Accepted: 21 October 2022;
Published: 02 November 2022.
Edited by:
Shunli Wang, Southwest University of Science and Technology, ChinaReviewed by:
Leijiao Ge, Tianjin University, ChinaCopyright © 2022 Gao, Li and Huang. This is an open-access article distributed under the terms of the Creative Commons Attribution License (CC BY). The use, distribution or reproduction in other forums is permitted, provided the original author(s) and the copyright owner(s) are credited and that the original publication in this journal is cited, in accordance with accepted academic practice. No use, distribution or reproduction is permitted which does not comply with these terms.
*Correspondence: Yuansheng Gao, Z2FveXVhbnNoZW5nMjAyMUAxNjMuY29t
Disclaimer: All claims expressed in this article are solely those of the authors and do not necessarily represent those of their affiliated organizations, or those of the publisher, the editors and the reviewers. Any product that may be evaluated in this article or claim that may be made by its manufacturer is not guaranteed or endorsed by the publisher.
Research integrity at Frontiers

Learn more about the work of our research integrity team to safeguard the quality of each article we publish.