 Xiaodi Wang
 Yunche Su
 Shuai Zhang
- State Grid Sichuan Economic Research Institute, Chengdu, China
The fast development of renewable energy has resulted in great challenges to the power system, which urgently needs more flexible resources to maintain a system supply/demand balance. This paper established a multi-stage electricity market framework in the presence of a load aggregator (LA) including a day-ahead energy/reserve market and a real-time balanced market. To actively participate in the day-ahead energy market and reserve market, a load profile perception model for LA is proposed to evaluate in detail the response performance of consumers. Meanwhile, a market-bidding model of LA and a market-clearing model of the system operator for the day-ahead market are also established. To actively join the real-time balance market, a market-bidding model of LA for the real-time balance market based on surplus flexible resources is established. The system operator further clears the real-time balance market and dispatches the collected flexible resources according to the system supply-demand state. A modified IEEE 30 bus system is tested and shows that the proposed market framework can effectively promote consumers to respond to system regulation requirements and lowers the system supply-demand imbalance risk.
Introduction
To build a low-carbon energy system, renewable energy units, such as wind turbines (WT) and photovoltaics (PV), have quickly developed. It is expected that the total installed capacity of PV and WT in China will reach more than 1.2 billion kW by 2030 (Yang et al., 2018). As the proportion of renewable energy in the power system exceeds a certain threshold, the system operation mode will go through great change. Additionally, the issue of insufficient flexible resources will become a key bottleneck for the future development of renewable energy.
Current flexible resources provided by traditional thermal units are far from enough to support the regulation demand of the power system. To protect system reliability and safety, a good solution is to encourage consumers to change their load patterns in response to system operation requests (Youbo et al., 2019). Demand response (DR) includes types of programs, which focus on modifying the load profiles of consumers to maintain system generation and a consumption balance (Liang et al., 2021). One way is to fully exploit DR resources of the demand side, whose controllable devices can be directly dispatched by the system operator and can be a complementary solution to maintain a system supply-demand balance. Another way is to modify the electricity market framework. Reasonable market competition and incentive mechanisms can help coordinate distributed flexible resources on the demand side so that consumers together with the power system are able to all benefit from adjusting their power patterns.
The information and control technology (ICT) of the smart grid provides a foundation to support the integration of flexible demand resources. However, due to the stochastic response behaviors of distributed consumers, the system operator can hardly control large-scale distributed consumers (Du et al., 2021). At this stage, the interaction framework for the system operator and small consumers has not been fully formed. Regarding load scheduling and aggregation as a critical issue, middleman, such as the load aggregator (LA), retailers, and virtual power plants (VPP), can provide good way for small-scale consumers to participate in the electricity market (Youbo et al., 2018). Also, the liberalization of electricity markets helps incentive consumers to join the dispatching schedule of system operators. In terms of the market-bidding strategy, Vivekananthan et al. (2014) constructed a robust optimization strategy for LA to participate in bidding in the energy market based on controllable load resources. Bruninx et al. (2020) established multi-LA market-bidding and a scheduling model for frequency control service. Hu et al. (2017) proposed the regulation framework to LA to schedule the thermal (Fang et al., 2016) load such as air conditioning and water heaters. Li et al. (2018) provided a way for VPP to participate in the energy market and ancillary market by dispatching electric vehicles (EV) and WT. Pandžić et al. (2013) and Chen et al. (2018) established a VPP optimal bidding model that considers the uncertainties of multi-market prices including the long-term and day-ahead market. In terms of the load control method, Shao et al. (2013) found that retailers can determine the real-time electricity prices of customers to manage their demand portfolios. Liang et al. (2018) proposed a robust optimization algorithm for LA to find the optimal real-time electricity prices offered to consumers considering the uncertainties of market prices. Baharlouei et al. (2013) and the California Independent System Operator (2016) studied the integration of incentive DR programs for LA considering power flow constraints. Hu et al. (2017) and Sumaiti et al. (2020) provided a game theory-based structure for retailers and consumers to decide on incentive prices. Despite these studies in the field of DR, several research gaps still need to be filled. First, bidding strategies and load control methods of a middleman are highly dependent on the accurate evaluation and integration of response capacity of distributed consumers. Most studies ignore the process of perceiving the real-time response capacity of consumers. Second, in the studies mentioned, the middleman focuses on engaging in a single market. This is an urgent issue to reasonably arrange consumers’ schedules and efficiently participate in a multi-stage market to meet the profit demands of LA and consumers.
With this in mind, this paper proposes a multi-stage electricity market framework for a real-time balanced market, day-ahead energy and a reserve market. By constructing a load state perception model, the real-time flexible resources of consumers can be perceived. In the day-ahead energy and reserve market, a bidding model for LA based on the consumers’ flexible resources is proposed. The system operator is in charge of market clearing according to the bidding strategy of market players, and thus, the dispatching scheme of day-ahead units can be decided. In the real-time balancing market, day-ahead clearing results are considered. All LAs bid in the real-time balancing market based on the surplus of flexible resources of their signed consumers. Then, system operators clear real-time balancing resources and dispatch the spare flexible resources according to the actual system balance demand. A modified IEEE 30 bus system was tested to verify the proposed framework. The results show that the proposed model can stimulate consumers to effectively respond to system regulation demand to promote the consumption of renewable energy.
Market framework
Referring to the market framework of the Nordic electricity market, the market setting of this paper can be described as follows:
1) Market framework and market participants: The multi-stage market here includes the day-ahead energy market, day-ahead ancillary market and real-time balance market. The market operation framework is shown in Figure 1. Market participants include load aggregators, thermal units and the system operator. LA and thermal units take part in a centralized bidding transaction. The system operator clears the market and conducts a day-ahead schedule of units after the bidding of market participants.
2) Bidding in day-ahead energy and the day-ahead reserve market: LA will bid in the day-ahead energy market (24 points a day) and day-ahead reserve market (including upper and lower reserve capacity) based on predicted load profiles of signed consumers. These two markets shall be independently organized and jointly settled according to the uniform market-clearing price.
3) Bidding in the real-time balance market: Generally, not many balancing service varieties exist in Northern Europe, and part of balance regulation resources can be obtained through the real-time balancing market. The real-time balancing market will be carried out 1 h in advance. Market participants will bid to provide the up or down-regulation service in the real-time balancing market based on day-ahead market-clearing results. Bidding information includes aspects such as a market participation period, up-regulation capacity, and down-regulation capacity.
4) Market settling method: We adopt the market structure “main energy market + ancillary market + balanced market” multi-stage market operation process and different service varieties settle separately.
5) Load regulation and deviation assessment: LA optimizes the load profiles of signed distributed consumers according to multi-stage market-clearing results to avoid a market deviation check.
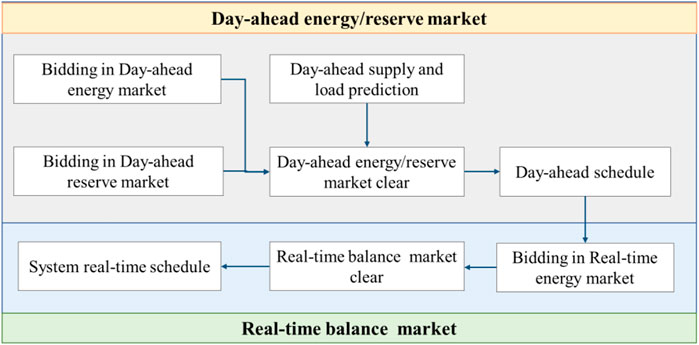
FIGURE 1. The trading framework of muti-stage markets.
LA bid strategy
Load profiles perception model
1) Optimal control strategy for LA to regulate signed consumers
Before bidding in the markets, LAs need to accurately evaluate the load profiles and flexible resources of signed consumers whose controllable devices include washing machines or EVs. By regulating the controllable devices of its signed consumers, LA aims to minimize the total energy cost of consumers as long as the aggregation resources can satisfy LA’s regulation demand. For scenario
where
2) The initial load profile prediction of LA signed consumers
The initial load profiles of LA signed consumers will be evaluated and predicted, which can be expressed as follows:
where
3) Flexible DR resource evaluation
In the typical scenario
where
Bidding model of LA in the day-ahead energy market and reserve market
After evaluating the load profiles of signed consumers, LA
where
The bidding curve of LA in the day-ahead energy market and reserve market can be expressed as a piecewise decreasing function
where the bidding curve includes the C segment
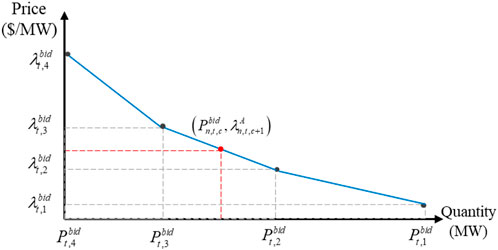
FIGURE 2. The bidding curve of the load aggregator for the day-ahead energy market. The bidding model of LA in the real-time balance market.
After evaluating the load profile of the signed consumers, LA
After the day-head energy market and reserve market are cleared, LA can participate in the real-time balance market to provide an up or down power regulation service based on its abundant flexible resources of signed consumers. LA’s objective function can be expressed as follows:
where
Electricity market model
Day-ahead energy market and reserve market model
After each market participant completes the bidding in the day-ahead market, the system operator will jointly clear the day-ahead energy market and the day-ahead reserve market, which aims at minimizing the system operation cost (including the total cost of generation and the cost of the system ancillary service). Thus, the day-ahead scheduling plan for thermal units can be obtained as follows:
where we have
1) System balance constraint:
where
2) Thermal unit constraint:
where
3) Reserve capacity constraint:
where Constraints 26, 27 ensure that the system up/down reserve capacity can satisfy the basic reserve demand.
4) System operation constraint:
The system operation constraints include the voltage constraint (29) and line capacity constraint (30) as follows:
where
Real-time balance market model
In the real-time balance market and to eliminate the net deviation caused by renewable energy, the system operator dispatches the up/down flexible resources provided by the day-ahead reserve market and real-time balance market. Thus, the real-time balance market can be modeled as follows:
where
The bidding process of LAs and the clearing process of the system operator in the multi-stage market is shown in Figure 3.
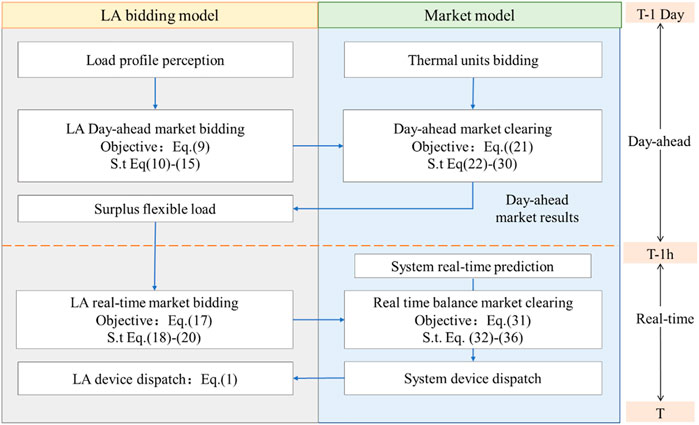
FIGURE 3. The flowchart for market-bidding and clearing.
Case study
Basic data
A modified IEEE 30 bus system is used to verify the proposed framework as shown in Figure 4. We have three LAs = {LA1, LA2, LA3} in charge of load at the corresponding bus, where each LA will aggregate 1,000 consumers with flexible resources. The system has 3 thermal units G = {G1, G2, G3} and 3 renewable energy generators, i.e., WT. Renewable energy generators are not considered participators in the market. The detailed parameters of LAs, thermal units and WT are shown in Table A1, Table A2 and Table A3 in the Appendix. Suppose that the real-time balance market will be open 1 h in advance, then the predicted load profile of day-ahead data and the predicted electricity prices of day-ahead and real-time data are shown in Figure 5. Other price parameters are shown in Table 1. In this paper, we assume that the reserve rates for renewable energy and the load are
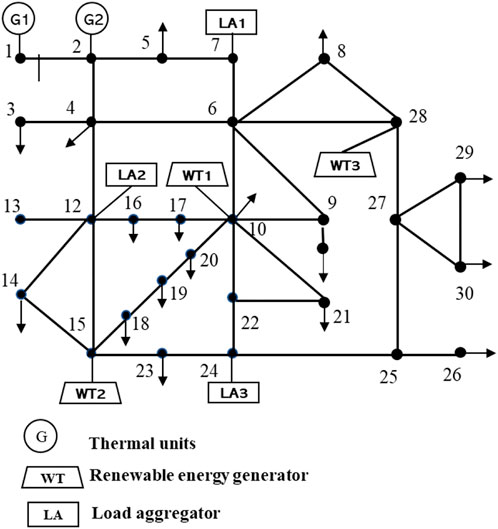
FIGURE 4. The modified IEEE 30 bus system.
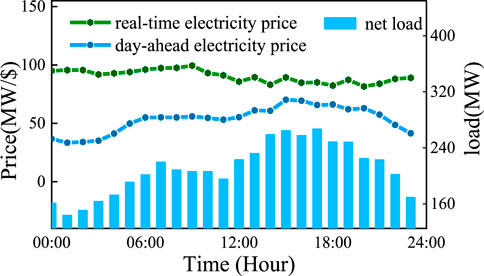
FIGURE 5. Day-ahead prediction for the net load and electricity price.
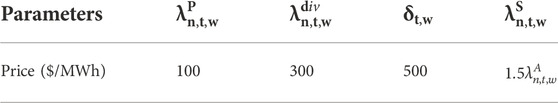
TABLE 1. Parameter setting of prices.
Considering the scenario below:
Scenario one: the real-time renewable energy generation is much more than the day-ahead prediction as shown in Figure 6A. Scenario two: the real-time load is much more than the day-ahead prediction as shown in Figure 6B.
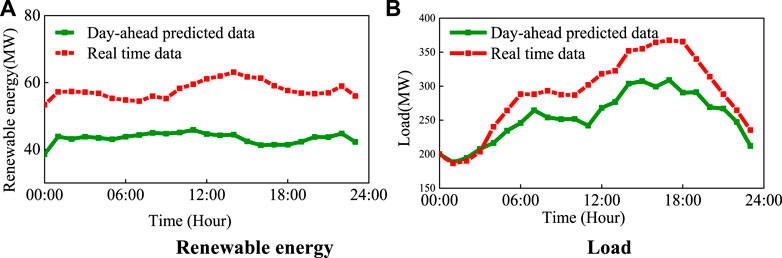
FIGURE 6. Transaction process of the slot-ahead ancillary market for peak-regulation. (A) Renewable energy and (B) load.
Market-bidding results
1) Day-ahead market-clearing result
The bidding results of LAs and thermal units in the day-ahead energy market and reserve market are shown in Figure 7. In the day-ahead energy market and due to the differential bidding strategies, LAs and thermal units have different bidding quantity.
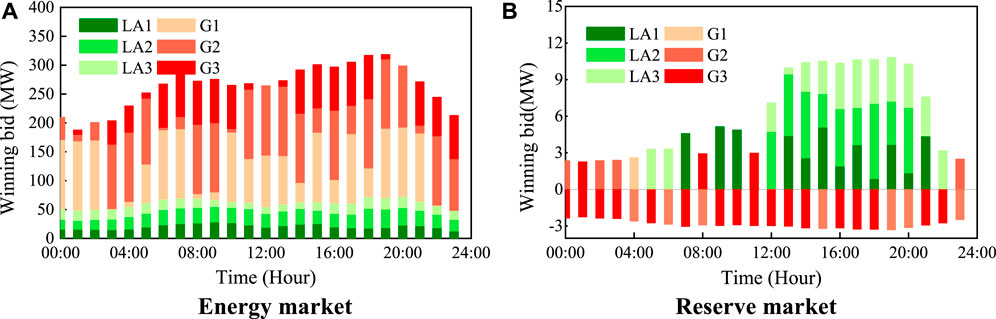
FIGURE 7. The market-clearing results for the day-ahead energy market. (A) Energy market and (B) reserve market.
In the day-ahead reserve market, peak load and peak electricity prices usually appear during the afternoon and night, and thus, consumers are more inclined to take part in the DR program. LA can aggregate a more price-sensitive load to join the reserve market as shown in Figure 7B.
2) Real-time balance market-clearing result
Once the day-ahead dispatching schedule for thermal units is decided, more flexible regulation resources may be required from the real-time market to balance the system supply-demand status under certain extreme scenarios.
The system has a different regulation demand under different scenarios. For example, under scenario one where the real-time renewable energy output is much more than the day-ahead predicted output, to consume more renewable energy, the system operator needs to dispatch the up-regulation resources of LA from the real-time balance market and day-ahead reserve market, and the down-regulation resource of thermal units from day-ahead reserve market is dispatched. Thus, all LAs only win up-regulation resources from the real-time balance market without winning down-regulation resources as shown in Figure 8A.
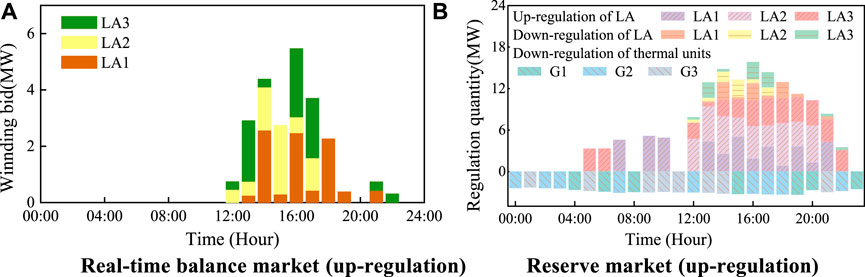
FIGURE 8. The regulation status for balance and reserve resources under scenario one. (A) Real-time balance market (up-regulation) and (B) reserve market (up-regulation).
Moreover, under scenario two where real-time load is much more than the day-ahead predicted load, to provide more power, the system operator needs to dispatch the down-regulation resources of LA from the real-time balance market and day-ahead reserve market, and to up-regulation resource of thermal units from day-ahead reserve market are dispatched. Thus, all LAs only win down-regulation resources from the real-time balance market without winning up-regulation resources as shown in Figure 9B.
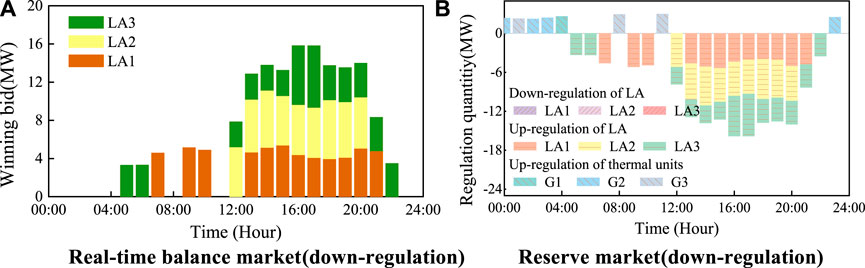
FIGURE 9. The regulation status for balance and reserve resources under scenario two. (A) Real-time balance market (down-regulation) and (B) reserve market (down-regulation).
Market participants’ revenue
The benefits and costs of three LAs and their signed consumers are shown in Table 2. According to Table 2, the economic benefits of each LA with their signed consumers have been greatly improved after participating in the market. Under scenario one, the benefits of LAs have increased by 3.0%, 6.5% and 11.9% and the costs of signed consumers of each LA are reduced by 10.6%, 2.6% and 4.7%. Under scenario two, the benefits of LAs have increased by 16.5%, 13.4% and 25.1% and the costs of signed consumers of each LA are reduced by 12.7%, 4.5% and 7.6%.
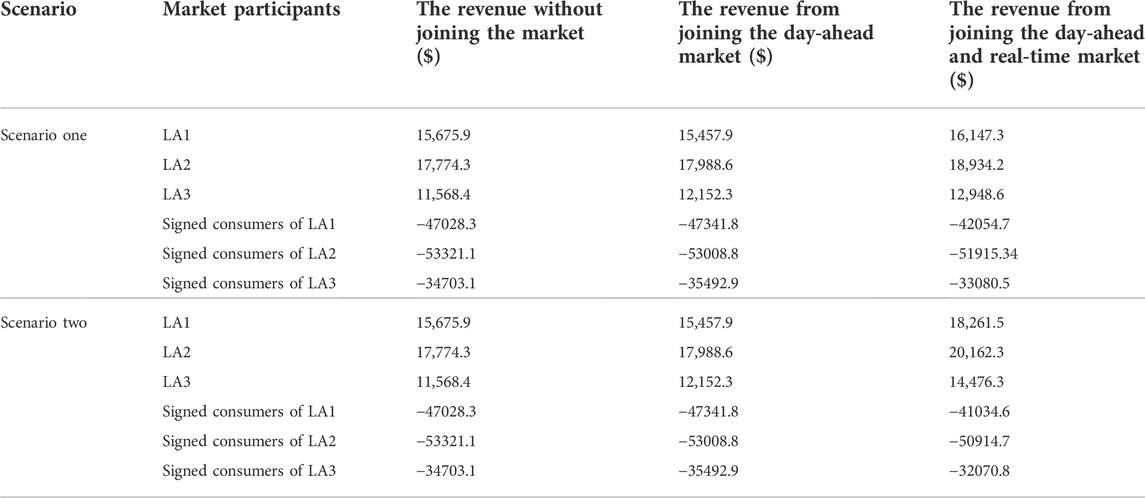
TABLE 2. Revenue of market participants.
The system operation result is shown in Table 3. The operation of the real-time balance market can effectively aggregate surplus flexible resources of LAs to participate in market regulation, which is helpful in reducing renewable/load curtailment and system operating cost. Under scenario one, the power curtailment of renewable energy is reduced by 15.3% and the system operating cost is reduced by 6.2% with the operation of real-time balance market. Under scenario two, the load curtailment is reduced by 11.0% and the system operating cost is reduced by 19.3% with the operation of the real-time balance market.
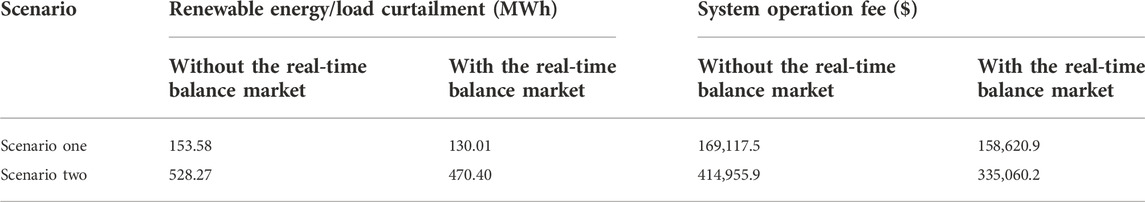
TABLE 3. System operation results.
According to Tables 2 and 3, the proposed multi-stage market framework can provide a win-win market platform for LAs, consumers and the system operator, which helps to guarantee the economic benefits of each market participant and reduces the operating cost of the system.
LA dispatch results
Under scenario two, the device dispatch scheme of typical signed consumers of each LA is shown in Figure 10. Figure 7 shows that the winning bid of LAs in the day-ahead reserve market is up-regulation capacity without down-regulation capacity. As shown in Figure 9, the winning bid of LAs in the real-time balance market is the down-regulation capacity, who will reduce their power usage in the afternoon and night. Each LA will dispatch the controllable devices of their signed consumers in response to system regulation demand. Type one of controllable device is the washing machine and type two is the EV. All controllable devices are forbidden from being used during the peak load period and are to be used during other periods as shown in Figure 10.
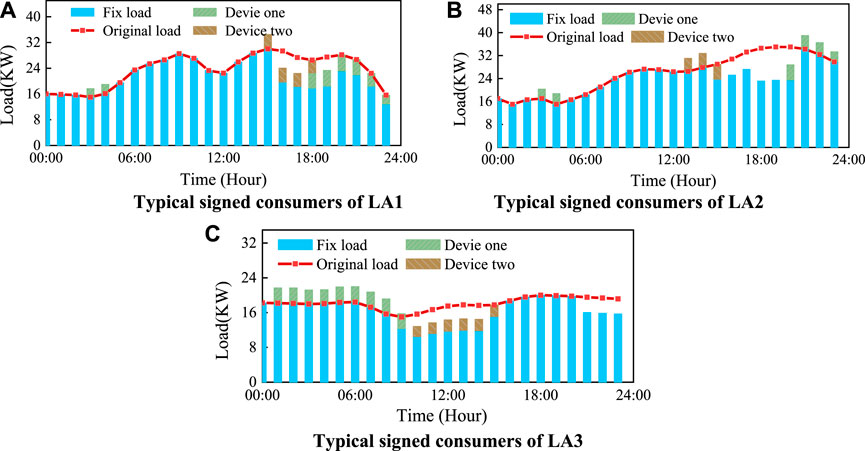
FIGURE 10. The control scheme for end-users’ devices. (A) Typical signed consumers of LA1, (B) typical signed consumers of LA2, and (C) typical signed consumers of LA3.
Conclusion
This paper establishes a multi-stage electricity market-bidding and clearing framework including the day-ahead energy market, the day-ahead reserve market and the real-time balance market. A modified IEEE 30 bus system is utilized to verify the effectiveness of the proposed market framework, and the simulation results show that a win-win market trading platform for LAs, consumers and the system operator is proposed, which can effectively coordinate the interests of multiple market participants.
1) A load profile perception model for LA is established to achieve accurate load prediction and optimal device control. Moreover, the bidding strategies for LAs are also proposed to assist LA to participate efficiently in markets.
2) By establishing a real-time balance market, LAs can effectively aggregate flexible resources based on signed consumers, and encourage signed consumers to adjust load profiles of controllable devices to respond to system regulation demand. As system renewable energy is abundant, consumers can provide more up-regulation capacity to consume renewable energy, whereas when the system is short of power, consumers can provide more down-regulation capacity to maintain the system supply-demand balance.
Data availability statement
The original contributions presented in the study are included in the article/Supplementary Material, and further inquiries can be directed to the corresponding author.
Author contributions
XW: methodology, software, writing—original draft. YS and WX: conceptualization, validation, investigation, data curation. SZ: validation, writing—review and editing. YZ: validation, visualization.
Conflict of interest
The authors declare that the research was conducted in the absence of any commercial or financial relationships that could be construed as a potential conflict of interest.
Publisher’s note
All claims expressed in this article are solely those of the authors and do not necessarily represent those of their affiliated organizations, or those of the publisher, the editors and the reviewers. Any product that may be evaluated in this article, or claim that may be made by its manufacturer, is not guaranteed or endorsed by the publisher.
References
Baharlouei, Z., Hashemi, M., Narimani, H., and Mohsenian-Rad, H. (2013). Achieving optimality and fairness in autonomous demand response:Benchmarks and billing mechanisms. IEEE Trans. Smart Grid 4 (2), 968–975. doi:10.1109/tsg.2012.2228241
Bruninx, K., Pandžić, H., Le Cadre, H., and Delarue, E. (2020). On the interaction between aggregators, electricity markets and residential demand response providers. IEEE Trans. Power Syst. 35 (2), 840–853. doi:10.1109/tpwrs.2019.2943670
California Independent System Operator (2016). Addendum-draft final technical appendix-flexible ramping product. Report.
Chen, S., Chen, Q., and Xu, Y. (2018). Strategic bidding and compensation mechanism for a load aggregator with direct thermostat control capabilities. IEEE Trans. Smart Grid 9 (3), 2327–2336. doi:10.1109/TSG.2016.2611611
Du, Y., Lu, F., and Zandi, H. (2021). Approximating Nash equilibrium in day-ahead electricity market bidding with multi-agent deep reinforcement learning. Mod. Power Syst. Clean Energy 9 (3), 534–544.
Fang, X., Hu, Q., Li, F., Wang, B., and Li, Y. (2016). Coupon-based demand response considering wind power uncertainty: A strategic bidding model for load serving entities. IEEE Trans. Power Syst. 31 (2), 1025–1037. doi:10.1109/tpwrs.2015.2431271
Hu, J., Cao, J., Guerrero, J. M., Yong, T., and Yu, J. (2017). Improving frequency stability based on distributed control of multiple load aggregators[J]. IEEE Trans. Smart Grid 8 (4), 1553–1567. doi:10.1109/tsg.2015.2491340
Li, Z., Wang, S., Zheng, X., de Leon, F., and Hong, T. (2018). Dynamic demand response using customer coupons considering multiple load aggregators to simultaneously achieve efficiency and fairness. IEEE Trans. Smart Grid 9 (4), 3112–3121. doi:10.1109/tsg.2016.2627140
Liang, B., Yang, J., Hou, B., and He, Z. (2021). A pricing method for distribution system Aggregators considering differentiated load types and price uncertainty. IEEE Trans. Power Syst. 36 (3), 1973–1983. doi:10.1109/tpwrs.2020.3032593
Liang, B., Yang, J., Hou, B., and He, Z. (2018). A Pricing Method for Distribution System Aggregators Considering Differentiated Load Types and Price Uncertainty. IEEE Trans. Power Syst 36 (3), 1973–1983.
Pandžić, H., Kuzle, I., and Capuder, T. (2013). Virtual power plant mid-term dispatch optimization, Appl. Energy 101, 134–141. doi:10.1016/j.apenergy.2012.05.039
Shao, S., Pipattanasomporn, M., and Rahman, S. (2013). Development of physical-based demand response-enabled residential load models. IEEE Trans. Power Syst. 28 (2), 607–614. doi:10.1109/tpwrs.2012.2208232
Sumaiti, A., Konda, S. R., Panwar, L., Gupta, V., Kumar, R., and Panigrahi, B. K. (2020). Aggregated demand response scheduling in competitive market considering load behavior through fuzzy intelligence. IEEE Trans. Ind. Appl. 56 (4), 1–4247. doi:10.1109/tia.2020.2988853
Vivekananthan, C., Mishra, Y., Ledwich, G., and Li, F. (2014). Demand response for residential appliances via customer reward scheme. IEEE Trans. Smart Grid 5 (2), 809–820. doi:10.1109/tsg.2014.2298514
Yang, H., Zhang, S., Qiu, D., Zhao, J., Lai, M., Dong, Z. Y., et al. (2018). Distributionally robust optimal bidding of controllable load aggregators in the electricity market. IEEE Trans. Power Syst. 33 (1), 1089–1091. doi:10.1109/tpwrs.2017.2701650
Youbo, L., Junbo, Z., Lixiong, X., Liu, T., Qiu, G., and Liu, J. (2019). Online TTC Estimation using nonparametric analytics considering wind power integration. IEEE Trans. Power Syst. 34 (1), 494–505. doi:10.1109/tpwrs.2018.2867953
Appendix
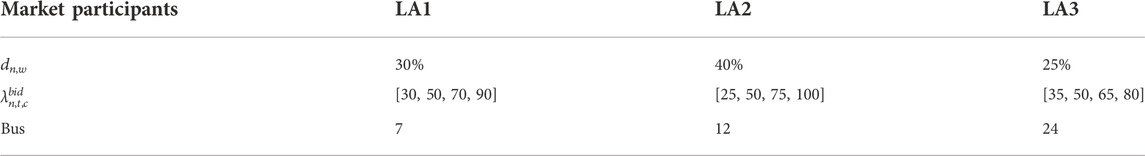
TABLE A1. Parameter settings of load aggregators.
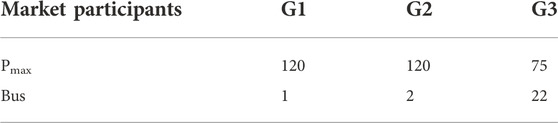
TABLE A2. Parameter settings of thermal units.
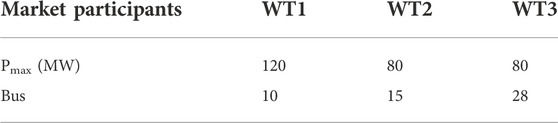
TABLE A3. Parameter settings of wind turbine.
Keywords: demand Response, load aggregator, market strategy, electricity market, flexible load
Citation: Wang X, Su Y, Xu W, Zhang S and Zhang Y (2023) A market decision-making model for load aggregators with flexible load. Front. Energy Res. 10:1030076. doi: 10.3389/fenrg.2022.1030076
Received: 28 August 2022; Accepted: 20 September 2022;
Published: 06 January 2023.
Edited by:
Youbo Liu, Sichuan University, ChinaReviewed by:
Jia Liu, Hangzhou Dianzi University, ChinaWei Yang, Southwest Petroleum University, China
Lu Nan, Sichuan University, China
Copyright © 2023 Wang, Su, Xu, Zhang and Zhang. This is an open-access article distributed under the terms of the Creative Commons Attribution License (CC BY). The use, distribution or reproduction in other forums is permitted, provided the original author(s) and the copyright owner(s) are credited and that the original publication in this journal is cited, in accordance with accepted academic practice. No use, distribution or reproduction is permitted which does not comply with these terms.
*Correspondence: Xiaodi Wang, MTgyODA0MDk2NjdAMTYzLmNvbQ==