 Wu Tian
 Zhu Hesheng1
94% of researchers rate our articles as excellent or good
Learn more about the work of our research integrity team to safeguard the quality of each article we publish.
Find out more
ORIGINAL RESEARCH article
Front. Energy Res., 16 November 2022
Sec. Smart Grids
Volume 10 - 2022 | https://doi.org/10.3389/fenrg.2022.1028423
This article is part of the Research TopicExplainability in Knowledge-based Systems and Machine Learning Models for Smart GridsView all 6 articles
Obtaining the core temperature of the cable joint is vital to ensure the safe operation of the modern power system with integration. To improve the speed and accuracy of core temperature inversion, this study proposed a non-embedded cable joint temperature inversion method named uniform manifold approximation and projection (UMAP) and the improved sparrow search algorithm (ISSA) optimized the back propagation neural network (BPNN). Firstly, UMAP is used to reduce the feature dimension of sample data input and enhance the data visualization effect. After dimension reduction, the model input features are consistent with the international ampacity calculation standard, and the calculation speed and accuracy of the model are improved. To improve the optimization ability of SSA, the Tent chaotic operator is introduced, and then the ISSA is used to optimize BPNN to address the issue of unstable output and easy falling into a local minimum. At last, the optimization ability and temperature inversion effect of the improved model were compared with other competing algorithms based on the 10 kV cable joint temperature-rise test and CEC2017 benchmark function. The experimental results show that the proposed method shortens the calculation time of the model, and the mean absolute error of temperature inversion is about 0.1°C. The overall performance is the most outstanding, the training data set is unbiased, and the interpretability of the model improves, which can provide a reliable reference for line operation and maintenance personnel.
Under the constraints of the “carbon peak carbon neutral” goal, there will be a transition of electric energy structure from traditional thermal power generation into new energy generation as the main power source (Han et al., 2021; Li and Niu, 2021). With the acceleration of the urbanization process, the demand for electricity surges, but the power supply reliability needs to be enhanced with relatively low costs. Therefore, how to maximize the current carrying capacity of in-service cables within the safety margin has become one of the current research directions. The dynamic capacity of the line is limited by the cable temperature, and the cable joint has thicker insulating and protection layers than the cable, which will lead to overheating, the remaining useful life of the cable, and safety reduction of cable joint (Ghaderi et al., 2019; Enescu and Russo, 2020). Therefore, real-time and accurate temperature monitoring of cable joint core is of great significance to operation security and the economy of the power system.
At present, the classification of cable core temperature monitoring mainly includes embedded detection and non-embedded detection according to measurement methods. The embedded detection refers to the fiber and sensor integrated into the cable core. However, because fiber is brittle and prone to breakage, maintaining the temperature and measuring the element inside requires damaging the joint structure, which is challenging and expensive (Li et al., 2019), (Mikolajek et al., 2020). Due to its ease, monitoring the temperature of the cable surface for non-embedded internal core temperature detection has attracted much interest lately. Numeric methods include the thermal circuit method (Swift et al., 2001; Liang, 2016) and the finite element method (FEM) (Klimenta et al., 2011; Ghoneim et al., 2021; Zhang et al., 2022). The former was proposed by Neher (1949) since the Kennelly hypothesis (Neher and Mcgrath, 1957) was put forward. Subsequently, the International Electrotechnical Commission (IEC) successively formulated the calculation standard of conductor temperature and ampacity, which is still in use today (IEC 60287, 2006; IEC-60853, 1985). The latter gradually became popular with the development of simulation software such as Comsol and Ansys. According to many experiments and finite element simulations, Sedaghat and De Leon (2014) revised the calculation formula of the cable thermal circuit in free air in the IEC standard. Gao et al. (2016) estimated cable joint temperature through the second-order transient thermal circuit and diagnosed cable joint fault combined with parameter identification. Bragatto et al. (2017) developed a nonlinear calculation method for underground medium-voltage cables. Fu et al. (2018) proposed a rapid calculation method for temperature-rise using a transfer matrix based on FEM. However, as the model structure becomes complex, the computational efficiency of these methods is not fast enough, they are affected by various environmental factors, and their applicability still needs further improvement.
The emergence of machine learning (ML) has brought earth-shaking changes to various fields. Their accuracy and computational efficiency in regression prediction, classification, image recognition, and other aspects are very high. Many algorithms have been applied to cable temperature prediction (Cheng and Yu, 2019a; Cheng and Yu, 2019b). Ruan et al. (2018) applied a support vector machine (SVM) in temperature estimation of medium and low voltage three-core cables and verified the accuracy of the estimated result through experiment. Lei et al. (2011) used BPNN to solve the influence of cable physical parameters on temperature inversion. Wang et al. (2017) proposed an estimation algorithm for high-voltage cable joint ampacity. However, they all have some parameters that are randomly initialized, requiring multiple iterations to get to relatively optimal values.
The meta-heuristic algorithm realizes the optimal solution by simulating natural and human intelligence. Compared with the traditional optimization method, it is a more flexible optimization method, which is mainly divided into four categories. For example, the genetic algorithm (Holland, 1992) and differential evolution (DE) (Storn and Price, 1997) were developed based on the evolution idea. The gravitational search algorithm (GSA) (Rashedi et al., 2009) and sine cosine algorithm (SCA) (Mirjalili, 2016), among others, were developed based on physics and chemistry. The particle Swarm optimization (PSO) (Kennedy and Eberhart, 2002), grey wolf optimization (GWO) (Mirjalili et al., 2014), whale optimization algorithm (WOA) (Mirjalili and Lewis, 2016), butterfly optimization algorithm (BOA) (Arora and Singh, 2019), and Harris Hawks optimization (HHO) (Heidari et al., 2019), among others, were developed based on swarm intelligence. Moreover, the socio-evolution and learning optimization algorithm (SELO) (Kumar et al., 2018) was based on human behavior. All these algorithms have a common feature. They comprise two phases: exploration and exploitation. In the exploration phase, the algorithm should fully search the space domain. In the exploitation stage, the algorithm needs to search locally in the optimal solution region to find the global optimal value.
The meta-heuristic algorithm has a good performance in solving quality and convergence speed, but there is still a problem that it is easy to fall into the local optimal value. Therefore, many variants of meta-heuristic algorithms and hybrid algorithms have been proposed. Premkumar et al. (2022a) used Gaussian and Cauchy mutation-based Hunger Games Search Optimization (GCMHGSO) was used to optimize the enhanced Newton–Raphson method (NRM) to achieve accurate parameter identification of photovoltaic cells and modules. Premkumar et al. (2022b) improved a multi-objective balanced optimizer (MOEO) with the crowding distance mechanism and the non-dominated sorting strategy, which proved its computational efficiency in 33 contextual problems. Premkumar et al. (2021a) used the opposition-based learning mechanism (OBL) to improve the gradient-based optimization algorithm (GOA). A new many-objective gradient-based optimizer (MaOGBO) to calculate the optimal power flow (OPF) under multi-objective constraints was proposed by Premkumar et al. (2021b). Xavier et al. (2021) proposed the orthogonal learning-based Gray Wolf Optimizer (OLBGWO) to balance the exploration and exploitation phases properly. Fan et al. (2020) used the quasi-reflection-based learning mechanism to improve the convergence speed of HHO. Sayed and Hassanien (2018) combined Moth–Flame optimization (MFO) algorithm and simulated annealing (SA). Nadimi-Shahraki et al. (2022) used a pooling mechanism and three strategies to improve WOA and conduct effective feature selection.
SSA is a new swarm intelligence algorithm proposed by Xue and Shen (2020). Due to its excellent performance, this optimization algorithm has been applied to maximum power point tracking (MPPT), load forecasting, cost control, parameter identification, the traveling salesman problem (TSP), route planning, and other challenging engineering problems and achieved good results. To solve the problem of large-scale data regression classification. Zhang and Ding (2021) optimized the parameters of the stochastic configuration network (SCN) by using SSA enhanced by logical chaotic mapping and mutation operator. Tang et al. (2021) developed the SSA variant (CLSSA) that integrated the spiral strategy and adaptive step strategy and proved its practicability in testing functions and engineering problems. Liu et al. (2022a) used the variant of SSA to optimize BP neural network to achieve short-term stock market index prediction. Chen et al. (2022) developed a generalized neural network model optimized by SSA, which reduced the complexity of spectral data and improved the computational efficiency of the model. Liu et al. (2022b) believed that the performance of the hybrid model was stable and compared and analyzed the performances of RF-GWO, RF-SSA, and SVM-GWO, among others. Although many meta-heuristic algorithms have been used in the literature, the stable performance of SSA in the face of complex problems is the primary reason for selecting it as the optimizer in this study.
With the rapid growth of the application speed of ML, how to improve the interpretability of such “black box” models for end users is considered more important. Because ML may reflect the bias of human or physical environment when making decision judgments, as well as the weight of sample collection and selection, these may lead to unfair or completely wrong results and decisions. The black box model only maps the input and output without explaining the reason. The more complex the background sample, the greater the burden of interpretation. There are several ways to explain ML (Angelov et al., 2021; Psychoula et al., 2021): some classic transparent models, such as decision trees, Bayesian networks, and k-nearest neighbors, find an alternative to the original model to explain complex models with simple models. Input features are evaluated based on their contribution to model results by feature correlation. Some visualization means are also included. Facing the high-dimensional data training set constructed in the cable joint operation environment, the information between the input feature quantities of the model is redundant and contains much invalid information, which will lead to the slow training speed of the model and even the overfitting. Because ML is generally trained on relatively fixed and independent identically distributed data, we need to shift from pure statistical interpretation to causal interpretation or combine them. This can help end users trust temperature inversion methods and systems without understanding the working principle of ML. Uniform manifold approximation and projection (UMAP) is a popular dimensionality reduction algorithm in biology and other fields (McinnesHealy et al., 2018; Becht et al., 2019). Compared with T-distributed stochastic neighbor embedding (T-SNE) (Cheng et al., 2015) and other dimension reduction algorithms, the sample data of the UMAP do not need to satisfy Gaussian distribution, and the relative structure of high-dimensional space of original data can be well maintained, so it is of better high-dimensional data processing ability and faster calculation speed.
Based on the above literature research, this study proposes a cable joint core temperature inversion method combining UMAP data dimensionality reduction preprocessing and the improved SSA-optimized BPNN hybrid algorithm. The main contributions of this study are as follows:
1) A new SSA variant, named improved sparrow search algorithm (ISSA), is proposed by combining the Tent chaotic map and population mutation perturbation strategy with SSA. Strategy improvement increases the optimizing ability of SSA, and Tent mapping increases the population diversity and the initial population distribution uniformity to improve the global search ability of the algorithm. In the later stage of iteration, the chaotic operator perturbs the current optimal individual to help the group jump out of the local optimum and accelerate the optimization speed of SSA.
2) The dimensionality reduction effect of UMAP is verified by comparison with T-SNE. The interpretability of the inversion algorithm model is improved through the analysis of the cumulative contribution rate and dimensionality reduction of sample data
3) The performance of the ISSA algorithm is verified by comparing it with other algorithms on benchmark functions.
4) The temperature inversion effect of UMAP-ISSA-BPNN is proved by comparing it with other competitive algorithms on the cable joint temperature-rise test.
The remaining part of this study is organized as followings: The dimension reduction and visualization effect comparison between UMAP and T-SNE are introduced in Section 2. The basic principle, improvement strategy, and model framework of SSA are introduced in Section 3. Section 4 conducts the cable joint temperature-rise test to collect training data. In Section 5, the optimization ability and temperature inversion effect of the proposed model are verified by comparing six benchmark functions and the cable joint temperature-rise experiments. Section 6 provides some conclusions and future work.
UMAP is a dimension reduction algorithm based on Riemannian geometry and algebraic topology. It maps the characteristics of high-dimensional data to low-dimensional space by searching the closest equivalent fuzzy topology structure of lower-dimensional data. For points in the high-dimensional space xi and xj, pi|j denotes the conditional probability that xi is an adjacent point of xj. It can be specifically expressed as follows:
where ρi is the distance from the ith data point to its first nearest neighbor and σi is obtained by the nearest neighbor parameter and binary search.
Because the weights of the nearest neighbors between two points are not necessarily equal, it is necessary to symmetrize the high-dimensional probability:
UMAP uses curve clusters to model low-dimensional distance probability. It is similar to Student’s t-distribution and is shown as follows:
where default hyper-parameters a = 1.93, b = 0.79. The piecewise function with min-dist as the condition was fitted by the values of a and b. The smaller the min-dist is, the more intensive the similarity is after projection. On the contrary, similar points are more sparse.
UMAP uses binary cross entropy (CE) as a cost function to perform random gradient descent by adjusting the loss function. It can be expressed as follows:
Due to the requirements of urban planning, cable laying cannot be completely installed under regulations, and the operating environment is complex and changeable. With the increase in operation years, the joint quality will decline, and insulation aging and cable joint state degradation will lead to cable joint overheating and cause safety accidents. Therefore, it is necessary to consider the influence of multi-dimensional and variable factors. According to the monitoring data of a transmission line in a certain area, variables related to cable core temperature—six kinds of data, namely, load, cable surface temperature, air temperature, air humidity, wind speed, and atmospheric pressure—were visualized for dimension reduction analysis. Firstly, the contribution rate of each component was obtained by Gauss kernel KPCA, as shown in Figure 1, and the results showed that the cumulative contribution rate of the first two principal components had exceeded 90%. Then, T-SNE and UMAP were used for visual contrast analysis of dimension reduction, respectively.
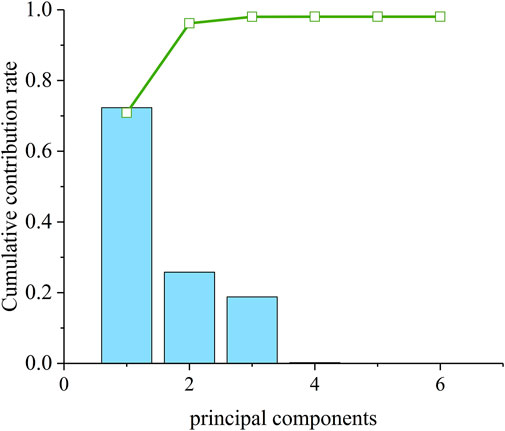
FIGURE 1. Gauss kernel KPCA contribution rate.
Figure 2 shows the scatter diagrams of the original data reduced to 2D and 3D, respectively. Each axis in the graph represents a principal component. Compared with T-SNE, data reduced to 2D using UMAP better maintain the structure in high-dimensional space, resulting in the larger spacing of original data, crowded and overlapping data become divergent, and visualization is enhanced. Through this data visualization method, the reporter and the receiver can understand and receive the results more efficiently.
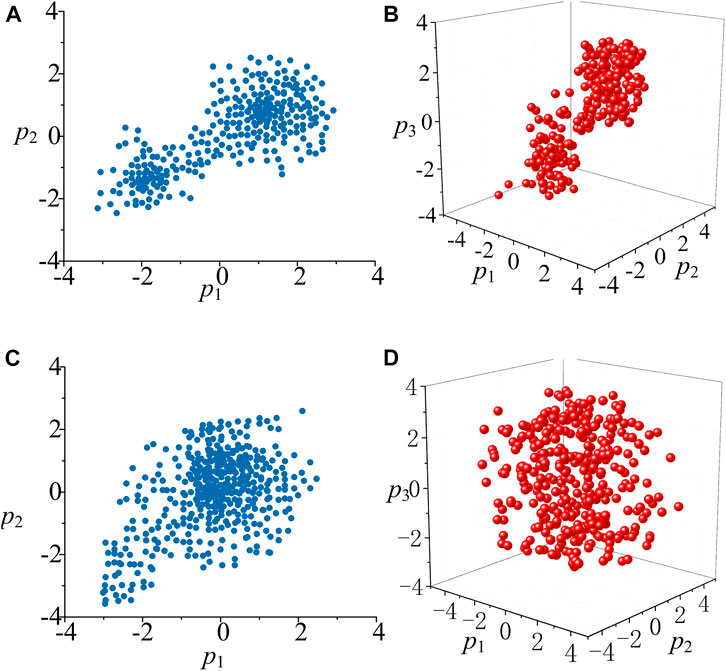
FIGURE 2. Visual effect comparison between UMAP and T-SNE dimension reduction. (A)UMAP reduced to 2D. (B) UMAP reduced to 3D. (C) T-SNE reduced to 2D. (D) T-SNE reduced to 3D.
The SSA simulated the process of individual sparrows avoiding natural enemies and getting closer to food. The population consists of three roles: producer, scrounger, and alert. Producers have a high energy reserve and a larger foraging area, which can provide foraging area and direction information for the population. Scroungers approach producers and grab food resources. The alert can give a warning signal when danger is coming, and if necessary, give up food to avoid danger. The producer location is updated as follows:
where t represents the current iteration number, i = 1, 2, … , P. Xt i,j represents the position information of the j-dimension of the ith sparrow in the iteration of t, α
The position update formula of scroungers is described as follows:
where N is the population size, Xp is the optimal position that producers occupied, Xw is the global worst position. A+= AT (AAT)−1, where A is a 1×d matrix with all elements 1 or −1.
Both producers and scroungers will have a certain proportion (10%–20%) of individuals acting as alert, and their position is updated as follows:
where Xb is the global optimal position and β is the step size, which is the random number of standard normal distribution. K
Generally, swarm intelligence algorithms randomly initialize the population. However, the uniformity of the spatial distribution of the population cannot be controlled, and the initial population distribution has a significant impact on the convergence speed and accuracy of the algorithm (Phan et al., 2020; Al-Betar et al., 2018). At the end of the iteration, SSA still has the common problem of the swarm intelligence algorithm. The population approaches the food location, the foraging space shrinks, the population diversity decreases, and the algorithm is prone to be “premature.” The randomness of chaotic mapping can enrich the population and improve the global search ability of the algorithm. Common chaos operators include logistic mapping and Tent mapping. However, the probability of logistic mapping in the interval of [0,0.1] and [0.9,1] is much higher than the probability of the middle position (Zhang and Ding, 2021). By contrast, the Tent chaos mapping in the interval of [0,1] has better ergodicity and uniformity (Wang and Wang, 2011; Liu et al., 2022c). In addition, in order to overcome the shortcomings of traditional Tent chaotic mapping and avoid chaotic particles falling into the small period and unstable period points during iteration, a random variable rand(0,1)/N is added to the original mapping formula, and the modified Tent chaotic mapping can be expressed as follows:
The chaotic value obtained in Eq. 8 is mapped to the sparrow population:
where xd,n is the new value of the chaotic sequence carrier in the population space; ub and lb are the upper and lower bounds of the sparrow position, respectively; and xd is a chaotic variable. Eq. 10 is then used to perturb the locally optimal individuals of the population and retain them preferentially:
where xn is the individual after disturbance and x is the individual to be disturbed.
The advantages of the BPNN are strong nonlinear mapping ability and flexible network structure. However, due to the high sensitivity of the network to weights and thresholds, the self-learning time will be greatly increased if the return error is large in the continuous iterative cycle. Therefore, ISSA is adopted in this study to optimize the weights and thresholds of the neural network to reduce the network training time. Figure 3 is the cable joint temperature inversion flowchart using UMAP and BPNN optimized by ISSA. The specific process is as follows:
Step 1: Sample data dimension reduction and neural network topology determination.
Step 2: Initialization of sparrow population parameters: input N, T, ST, R2, P and D.
Step 3: Tent chaos initializes the sparrow position.
Step 4: The fitness value of each sparrow was calculated and sorted.
Step 5: Update producer, scrounger, and alert positions.
Step 6: Judge whether the fitness value meets the convergence condition. If not, a chaotic disturbance update will be carried out.
Step 7: If the number of iterations reaches the maximum, the position information of the globally optimal sparrow is output; otherwise, return to step 5 to continue the cycle.
Step 8: The optimal parameters obtained by ISSA are assigned to the weights and thresholds of the neural network for temperature inversion.
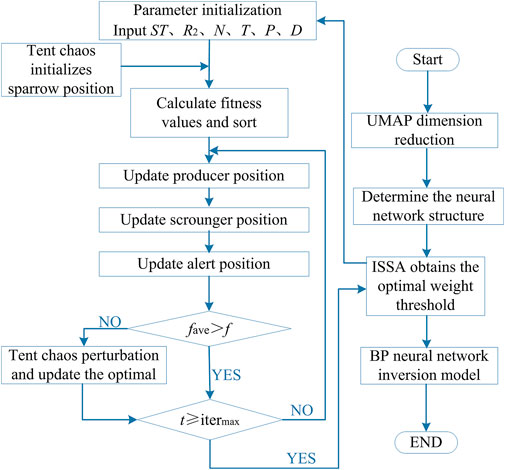
FIGURE 3. Flowchart of cable joint core temperature inversion method.
A 10 kV cable straight joint was made according to the production process of medium voltage cable joint of the power distribution network. The cable joint temperature-rise test platform installed the thermocouple temperature measuring device in the following six positions: the surface of the joint connecting pipe, cable joint connector surface, prefabricated rubber surface, cable joint armor wrap surface, cable sheath surface (1 m away from the cable joint connector), cable core conductor (axial direction 1 m away from connector), and the air (radial distance more than 1 m away from the joint). The current rising circuit uses a transformer to generate a large current, which is controlled by the output voltage regulation of the autotransformer. In order to be close to the actual situation, the specific experimental platform and temperature measuring point distribution are shown in Figure 4.
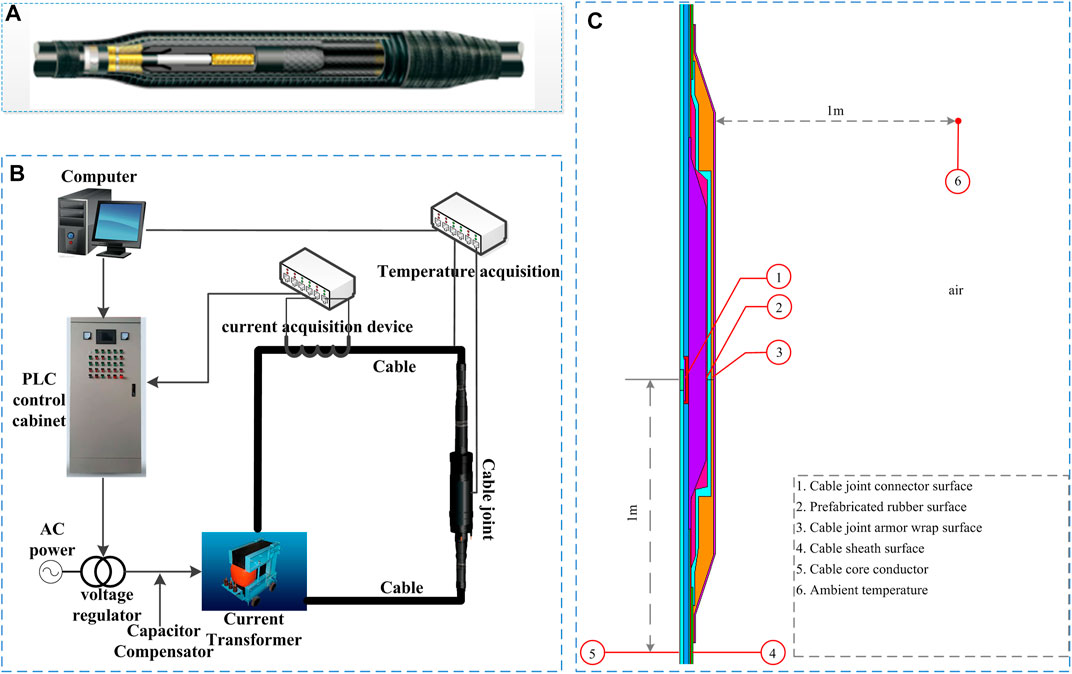
FIGURE 4. Temperature-rise test platform. (A) Cable joint. (B) Schematic diagram of the temperature-rise test platform. (C) Distribution of temperature measuring points on the quarter section of the cable joint.
The season, geography, population, and other factors will all impact the real line load, which is continuous and periodic. By considering the maximum current carrying capacity of the cable connector of this model, the experimental platform was originally loaded with a current of 250 A. After waiting for 6 h for the temperature to become somewhat stable, the current increased by 50 A each time step until reaching 750 A. This is how the multi-step equivalent current is loaded in the test. The electricity was then shut off to give the cable joint time to cool naturally. The air pressure is around 0.96 standard atmospheric pressure, the relative humidity ranges from 60% to 70%, and the wind speed ranges from 3.4 to 5.4 m/s in the experimental setting. Figure 5 displays the temperature measurement point information for each layer.
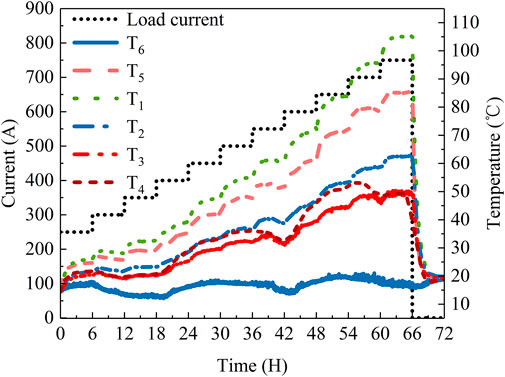
FIGURE 5. Load and temperature of each monitoring point.
Figure 5 shows that the crimping point of the cable connector has the fastest temperature-rise and maximum temperature throughout the entire experimental object. Moreover, the closer the position is to the connector, the higher the temperature is (T1 > T2 > T3). Because the copper core has large thermal conductivity, T5 is higher than the temperature of other layers. The temperature measurement data of joints and cables that are closer to the ambient air are more influenced by the environment. T3 and T4 have the most obvious effect. With the increase in loading current, the temperature continues to rise but simultaneously presents a downward trend with the decrease in ambient temperature. Particularly T4 is most impacted by changes in ambient temperature because its temperature measuring point is immediately exposed to the air. As a result, T4 is even higher than T3 in the period of 18–36 and 46–56 h. Therefore, the temperature measuring data of the cable surface contains the fluctuation rule of ambient temperature, which is in line with the conclusion of the principal component analysis. Only load and cable surface temperature measurement data are needed as the character input for the cable joint temperature estimation inversion.
In order to reflect the advantages of the strategy improvement model in this study, ISSA, PSO, WOA, and SSA are selected to test six benchmark functions. All algorithm population size is set to 50, the number of iterations is set to 300, and other parameters are set as shown in Tables 1, 2 shows the specific function information. Among them, f1–f2 is a high-dimensional unimodal function, f3–f4 is a high-dimensional multimodal function, and f5–f6 is a low-dimensional multimodal function. In order to remove errors caused by chance, 30 independent tests were conducted on six test functions, and the results are shown in Table 3.

TABLE 1. Experimental parameters for four optimization algorithms.
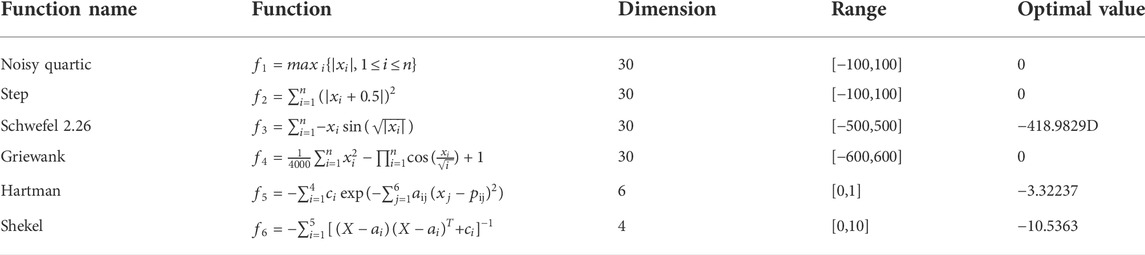
TABLE 2. Benchmark test function set.

TABLE 3. Function test results.
From the data analysis of Table 3, under the same operating environment and constraints, the ISSA algorithm performs better on the test function. For unimodal test function f1 and multimodal test function f4, SSA and ISSA have found their theoretical optimal values, which shows that SSA is superior to other swarm intelligence algorithms. On f2 and f3, although the theoretical optimal value is not found, ISSA performs better in the calculation of mean and standard deviation. On the low-dimensional test function, PSO, GWO, SSA, and ISSA can find the theoretical optimal solution, but the standard deviation of ISSA is smaller than that of other algorithms. On f6, ISSA can directly search for the optimal solution every time, indicating that the improved algorithm has better stability and optimization accuracy than other algorithms.
In order to compare the optimization speed and accuracy of the algorithm more intuitively, the convergence curve shown in Figure 6 is drawn. The peak single-extremum function can detect the local development ability of the algorithm, and the multi-extremum function can test the global search ability of the algorithm. It can be seen from the function test results of f1–f6 that PSO, GWO, and SSA are easy to fall into the local optimum in the late iteration, which greatly reduces the convergence speed. In summary, the effectiveness and superiority of ISSA are proven.
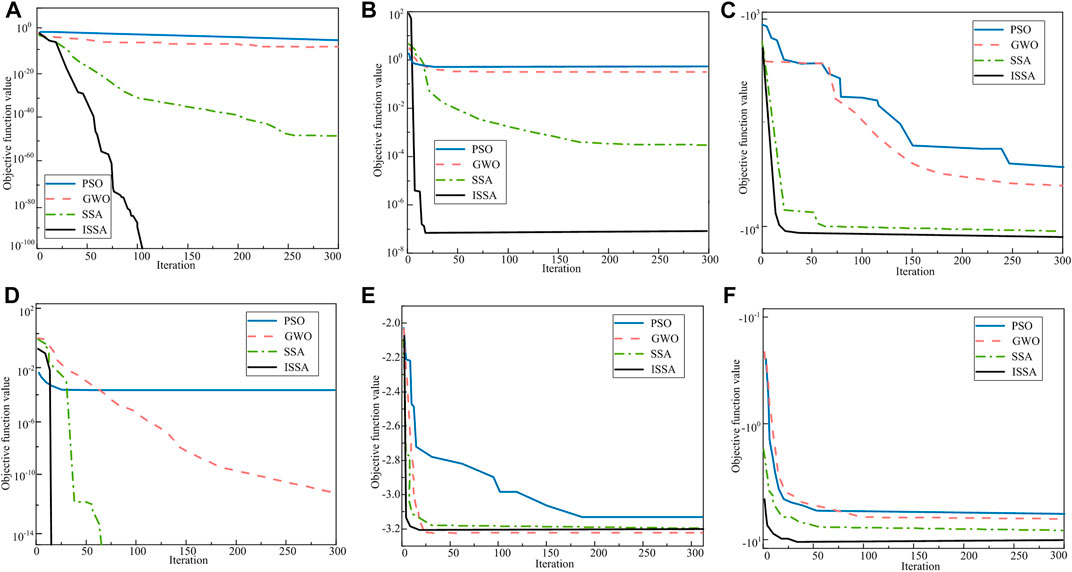
FIGURE 6. Convergence curve of fitness for four optimization algorithms on Benchmark function. (A) Convergence curve of f1. (B) Convergence curve of f2. (C) Convergence curve of f3. (D) Convergence curve of f4. (E) Convergence curve of f5. (F) Convergence curve of f6.
Temperature inversion analysis was carried out based on the temperature-rise test data of a 10 kV cable joint. The measured temperature and influencing factor data obtained from the experiment were sampled every half an hour. The sample data of the previous 48 h were used as the training set of the neural network, and the data from 48 to 72 h were used as the test set for temperature estimation. In order to ensure the fairness of the experiment, the same parameters of each algorithm should be kept consistent. The population size N = 50, and the number of iterations is set to 100. The hidden layer of the neural network is 1, the neuron is 8, and the input node is 6. The optimization process and results of each algorithm obtained by operation are shown in Figure 7.
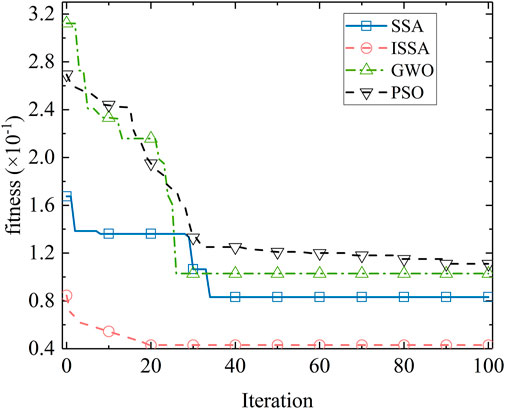
FIGURE 7. Convergence curve of fitness for four optimization algorithms.
Figure 7 shows that the minimum fitness value found by ISSA-BPNN in the 14 iterations round is 4.3 × 10⁻², and SSA-BPNN and GWO-BPNN converge to 8.16 × 10⁻² and 1.11 × 10⁻² in the 34 and 27 iterations, respectively. PSO-BPNN did not find the global optimal solution at the end of the iteration round. Moreover, the initial error value of the improved BPNN based on the SSA is also smaller than that of the other two heuristic optimization algorithms. Therefore, the ISSA can effectively improve the inversion accuracy of BPNN.
This section conducted cable joint temperature inversion. To quantitatively evaluate the temperature inversion effect of the improved algorithm model, δMAE, δMSE, R2, and operation time were used as evaluation indexes to compare each model. R2 can reflect the degree of fitting between the estimation temperature of the algorithm and the real temperature. δMAE and δMSE can reflect the degree of difference between the estimation value and the real value. The specific formulas are as follows:
where n is the number of estimation samples, yp is the model estimation value, yi is the actual value, and yi,ave are the average values of the actual value.
The training and test sets are divided the same as in the previous section. Figure 8 shows the curve of estimation results and real values. Clearly, the estimation accuracy of ISSA-BPNN is higher, which is more consistent with the actual situation.
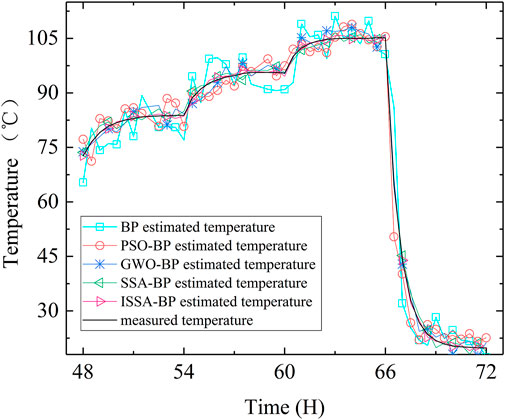
FIGURE 8. The comparison of inversion temperature and test temperature of BPNN improved by swarm intelligence algorithm.
Combined with Table 4, compared with BPNN, BPNN optimized by swarm intelligence optimization algorithm performs better. The temperature inversion effect of ISSA-BPNN is significantly better than the other four algorithms. The highest R2 of ISSA-BPNN is 91.34%, which is 5.22% higher than SSA-BPNN, 8.89% higher than GWO-BPNN, and 13% higher than PSO-BPNN, the R2 of BPNN is the lowest, only 59.45%. δMAE and δMSE of ISSA-BPNN are lower than the other four algorithms too. In addition, the operation time of ISSA-BPNN is also low, only 0.2 s more than the original BPNN, but 6.23, 7.82, and 1.82 s faster than the other three improved algorithms, respectively. Therefore, it can be concluded that the convergence speed and accuracy of the ISSA-BPNN model improved by mixed strategy in this study have been significantly improved, and it has an excellent performance in the application of cable joint temperature estimation.
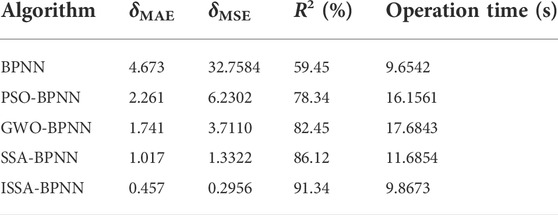
TABLE 4. Comparison results of inversion performance for BPNN and improved models.
Various factors affecting cable joint temperature were processed by dimension reduction using UMAP and T-SNE. Then, new two-dimensional data were obtained to construct a new training set. The dimension reduction data of the previous 48 h were used as the training set to train the neural network, where the number of network input nodes was 2, the number of hidden layer nodes was 10, and the number of output layers was 1.
Figure 9 demonstrates that the inversion result of the hybrid model trained by the data after dimension reduction has been significantly improved, and the R2 of cable joint temperature inversion has become higher, as seen in Table 5. After UMAP dimension reduction, ISSA-BPNN calculates approximately 3.4 s more quickly than that after T-SNE, and the inversion accuracy of cable joint core temperature is better improved. Although the dimensional reduction approach adds to the time complexity, it also reduces the dimension of the input characteristics and speeds up neural network training. As a result, compared with ISSA-BPNN, the operation time of UMAP-ISSA-BPNN is not considerably longer, but the inversion accuracy is noticeably better, and δMAE is only 0.103°C, a decrease of about 77.5%. As it is not always feasible or difficult to fully explain everything in the model in terms of short-term rapid prediction, we have a good balance between model interpretability and time consumption. The cable ampacity calculation method based on the IEC60287 equivalent thermal circuit model uses the ambient temperature and current as independent variables to obtain the cable temperature distribution. The data trained by the model in this study cover different working conditions of cable joints in the range of 250–750 A. It includes the maximum current carrying capacity range of the normal operation of the cable. The input of the model after UMAP processing is current and cable surface temperature. The experimental analysis also shows that the temperature measurement data of the cable surface hides the change law of the ambient temperature. Therefore, by comparison, the selection of the input characteristics of the model helps construct a more reasonable and unbiased data set, which conforms to some basic physical laws such as the Fourier heat transfer law and obtains more accurate temperature inversion results. It can help industry experts and other live working personnel to better understand and accept the results of the model.
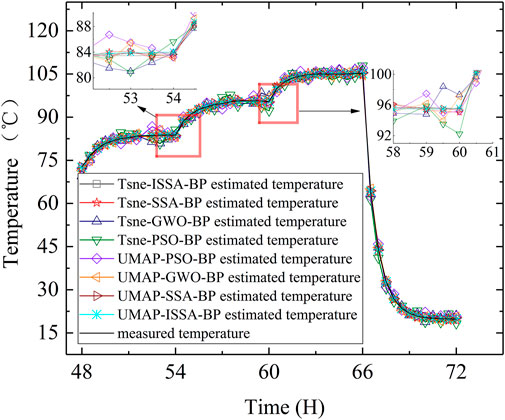
FIGURE 9. The comparison of inversion temperature and test temperature of BPNN improved by swarm intelligence algorithm after dimension reduction.

TABLE 5. Cable joint core temperature inversion performance after dimension reduction.
In this study, the UMAP-ISSA-BPNN model was introduced into the non-destructive testing of cable joint core temperature. The main work and conclusions are summarized as follows:
1) The UMAP algorithm is used to visualize the multi-dimensional variables that can characterize the cable joint temperature compared with T-SNE. The results show that UMAP can retain more information about the original data. Two inputs, the current and the cable surface temperature, are selected in such a way that they are highly consistent with the variables calculated for thermal circuits in international standards and satisfy the basic heat transfer laws.
2) The SSA is improved by combining the strategy, and the optimization performance is compared with PSO, GWO, and the original SSA by the CEC2017 test function. The results show that ISSA has good stability, strong optimizing ability, and short running time.
3) The temperature inversion effect of the hybrid model is verified by thermal cycle test data. The results show that the mean absolute error, mean square error, and running time of ISSA-BPNN are small, and the inversion effect is the best. UMAP extracts effective information, simplifies the input data, and improves the inversion accuracy and the explainability of the improved model, but the overall time-consuming growth is not large.
In the more complex electromagnetic and thermal environments, such as multi-loop cluster laying, it is necessary to further verify the temperature inversion effect of this research model.
The original contributions presented in the study are included in the article/Supplementary Material. Further inquiries can be directed to the corresponding author.
ZQ conducted the experiments, WN revised the paper and collected data, ZH and WT provided paper ideas, summarized all the data, and wrote the paper. All authors read and approved the final manuscript.
The authors declare that the research was conducted in the absence of any commercial or financial relationships that could be construed as a potential conflict of interest.
All claims expressed in this article are solely those of the authors and do not necessarily represent those of their affiliated organizations or those of the publisher, the editors, and the reviewers. Any product that may be evaluated in this article, or claim that may be made by its manufacturer, is not guaranteed or endorsed by the publisher.
KPCA, kernel principal component analysis; 2D, two-dimension; 3D: three-dimension; T-SNE, T-distribution stochastic neighbor embedding; δMAE, mean absolute error; δMSE, mean square error; R2, goodness of fit; pi|j, pi|j, conditional probability in high-dimensional space; pij, joint probability in high-dimensional space; qij, joint probability in low-dimensional space; d(xi,xj), the distance between sample points xi and xi; P, number of producers; D, number of scroungers; SD, number of alerts.
Al-Betar, M. A., Awadallah, M. A., Faris, H., Aljarah, I., and Hammouri, A. I. (2018). Natural selection methods for Grey Wolf optimizer. Expert Syst. Appl. 113, 481–498. doi:10.1016/j.eswa.2018.07.022
Angelov, P. P., Soares, E. A., Jiang, R., Arnold, N. I., and Atkinson, P. M. (2021). Explainable artificial intelligence: An analytical review. Wiley Interdiscip. Rev. Data Min. Knowl. Discov. 115 (5), e1424.
Arora, S., and Singh, S. (2019). Butterfly optimization algorithm: A novel approach for global optimization. Soft Comput. 23 (3), 715–734. doi:10.1007/s00500-018-3102-4
Becht, E., McInnes, L., Healy, J., Dutertre, C. A., Kwok, I. W., Ng, L. G., et al. (2019). Dimensionality reduction for visualizing single-cell data using UMAP. Nat. Biotechnol. 37 (1), 38–44. doi:10.1038/nbt.4314
Bragatto, T., Cresta, M., Gatta, F. M., Geri, A., Maccioni, M., and Paulucci, M. (2017). Underground mv power cable joints: A nonlinear thermal circuit model and its experimental validation. Electr. Power Syst. Res. 149, 190–197. doi:10.1016/j.epsr.2017.04.030
Chen, Y., Duan, W., Yang, Y., Liu, Z., Zhang, Y., Liu, J., et al. (2022). Rapid in measurements of Brown tide algae cell concentrations using fluorescence spectrometry and generalized regression neural network. Spectrochimica Acta Part A Mol. Biomol. Spectrosc. 272, 120967. doi:10.1016/j.saa.2022.120967
Cheng, J., Liu, H., Wang, F., Li, H., and Zhu, C. (2015). Silhouette analysis for human action recognition based on supervised temporal t-SNE and incremental learning. IEEE Trans. Image Process. 24 (10), 3203–3217. doi:10.1109/tip.2015.2441634
Cheng, L. F., and Yu, T. (2019). A new generation of ai: A review and perspective on machine learning technologies applied to smart energy and electric power systems. Int. J. Energy Res. 43 (6), 1928–1973, Apr. doi:10.1002/er.4333
Cheng, L. F., and Yu, T. (2019). Smart dispatching for energy internet with complex cyber-physical-social systems: A parallel dispatch perspective. Int. J. Energy Res. 43 (8), 3080–3133, Jun. doi:10.1002/er.4384
Enescu, P. Colella, and Russo, A. (2020). Thermal assessment of power cables and impacts on cable current rating: An overview. Energies 13 (20), 5319. doi:10.3390/en13205319
Fan, Q., Chen, Z., and Xia, Z. (2020). A novel quasi-reflected Harris hawks optimization algorithm for global optimization problems. Soft Comput. 24 (19), 14825–14843. doi:10.1007/s00500-020-04834-7
Fu, C., Si, W., Zhu, L., Li, H., Yao, Z., and Wang, Y. (2018). Research on the fast calculation model for transient temperature rise of soil directly buried cable group. High. Volt. Appar. 54 (2), 158–165.
Gao, Y., Tan, T., Liu, K., and Ruan, J. (2016). Research on temperature retrieval and fault diagnosis of cable joints. High. Volt. Appar. 42 (2), 535–542.
Ghaderi, A., Mingotti, A., Lama, F., Peretto, L., and Tinarelli, R. (2019). Effects of temperature on MV cable joints tan delta measurements. IEEE Trans. Instrum. Meas. 68 (10), 3892–3898. doi:10.1109/tim.2019.2900131
Ghoneim, S. S. M., Ahmed, M., and Sabiha, N. A. (2021). Transient thermal performance of power cable ascertained using finite element analysis. Processes 9 (3), 438. doi:10.3390/pr9030438
Han, X., Li, T., Zhang, D., and Zhou, X. (2021). New issues and key technologies of new power system planning under double carbon goals. High. Volt. Eng. 47 (9), 3036–3046.
Heidari, A. A., Mirjalili, S., Faris, H., Aljarah, I., Mafarja, M., and Chen, H. (2019). Harris hawks optimization: Algorithm and applications. Future Gener. Comput. Syst. 97, 849–872. doi:10.1016/j.future.2019.02.028
Holland, J. H. (1992). Genetic algorithms. Sci. Am. 267 (1), 66–72. doi:10.1038/scientificamerican0792-66
IEC 60287 (2006). IEC 60287-1-1 Electric cables-calculation of the current rating, part 1: current rating equations (100% load factor) and calculation of losses, 1. general.section
IEC-60853 (1985). IEC-60853-1 calculation of the cyclic and emergency current rating of cables, part 1: Cyclic rating factor for cables up to and including 18/30 (36) kV.
Kennedy, J., and Eberhart, R. (2002). Particle swarm optimization [C]. Proceedings of 1995 IEEE International Conference on Neural Networks. Piscataway, NJ: IEEE Press, 1942–1948.
Klimenta, D., Radosavljevic, J., Jevtic, M., Raicevic, V., Tasic, D., and Pajkovic, B. (2011). An improved non-adiabatic FEM model of a line-to-earth fault in buried power cables. Int. J. Heat. Mass Transf. 54 (15-16), 3514–3522. doi:10.1016/j.ijheatmasstransfer.2011.03.034
Kumar, M., Kulkarni, A. J., and Satapathy, S. C. (2018). Socio evolution & learning optimization algorithm: A socio-inspired optimization methodology. Future Gener. Comput. Syst. 81, 252–272. doi:10.1016/j.future.2017.10.052
Lei, C., Liu, G., and Li, Q. (2011). Dynamic calculation of conductor temperature of single-cable using neural network. High. Volt. Eng. 37 (1), 184–189.
Li, J., Zhang, Q., Yu, T., Zhang, M., Zhang, J., Qiao, L., et al. (2019). R-DTS with heat transfer functional model for perceiving the surrounding temperature. IEEE Sens. J. 20 (2), 816–822. doi:10.1109/jsen.2019.2944269
Li, X., and Niu, S. (2021). Study on multi-layer evaluation system of source-grid-load under carbon-neutral goal. Proc. CSEE 41 (S1), 178–184.
Liang, Y. (2016). Technological development in evaluating the temperature and ampacity of power cables. High. Volt. Eng. 42 (4), 1142–1150.
Liu, L., Wei, Z., and Xiang, H. (2022). A novel image encryption algorithm based on compound-coupled logistic chaotic map,” Multimedia Tools and Applications, 1–21.
Liu, R., Li, G., Wei, L., Xu, Y., Gou, X., Luo, S., et al. (2022). Spatial prediction of groundwater potentiality using machine learning methods with Grey Wolf and Sparrow Search Algorithms. J. Hydrology 610, 127977. doi:10.1016/j.jhydrol.2022.127977
Liu, X., Guo, J., Wang, H., and Zhang, F. (2022). Prediction of stock market index based on ISSA-BP neural network. Expert Syst. Appl. 204, 117604. doi:10.1016/j.eswa.2022.117604
McInnes, L., Healy, J., Saul, N., and GroBberger, L. (2018). UMAP: Uniform manifold approximation and projection. J. Open Source Softw. 3 (29), 861. doi:10.21105/joss.00861
Mikolajek, M., Martinek, R., Koziorek, J., Hejduk, S., Vitasek, J., Vanderka, A., et al. (2020). Temperature measurement using optical fiber methods: Overview and evaluation. J. Sensors 2020, 1–25. doi:10.1155/2020/8831332
Mirjalili, S., and Lewis, A. (2016). The whale optimization algorithm. Adv. Eng. Softw. 95 (5), 51–67. doi:10.1016/j.advengsoft.2016.01.008
Mirjalili, S., Mirjalili, S. M., and Lewis, A. (2014). Grey Wolf optimizer. Adv. Eng. Softw. 69 (3), 46–61. doi:10.1016/j.advengsoft.2013.12.007
Mirjalili, S. (2016). Sca: A sine cosine algorithm for solving optimization problems. Knowledge-based Syst. 96, 120–133. doi:10.1016/j.knosys.2015.12.022
Nadimi-Shahraki, M. H., Zamani, H., and Mirjalili, S. (2022). Enhanced whale optimization algorithm for medical feature selection: A COVID-19 case study. Comput. Biol. Med. 148, 105858. doi:10.1016/j.compbiomed.2022.105858
Neher, J. H., and Mcgrath, M. H. (1957). The calculation of the temperature rise and load capability of cable systems. RATIO 50 (2).
Neher, J. H. (1949). The temperature rise of buried cables and pipes. Trans. Am. Inst. Electr. Eng. 68 (1), 9–21. doi:10.1109/t-aiee.1949.5059897
Phan, H. D., Ellis, K., Barca, J. C., and Dorin, A. (2020). A survey of dynamic parameter setting methods for nature-inspired swarm intelligence algorithms. Neural comput. Appl. 32 (2), 567–588. doi:10.1007/s00521-019-04229-2
Premkumar, M., Jangir, P., Elavarasan, R. M., and Sowmya, R. (2021). Opposition decided gradient-based optimizer with balance analysis and diversity maintenance for parameter identification of solar photovoltaic models. J. Ambient. Intell. Humaniz. Comput., 1–23. doi:10.1007/s12652-021-03564-4
Premkumar, M., Jangir, P., Kumar, C., Sundarsingh Jebaseelan, S. D. T., Alhelou, H. H., Madurai Elavarasan, R., et al. (2022). Constraint estimation in three‐diode solar photovoltaic model using Gaussian and Cauchy mutation‐based hunger games search optimizer and enhanced Newton–Raphson method. IET Renew. Power Gen. 16 (8), 1733–1772. doi:10.1049/rpg2.12475
Premkumar, M., Jangir, P., Sowmya, R., Alhelou, H. H., Mirjalili, S., and Kumar, B. S. (2022). Multi-objective equilibrium optimizer: Framework and development for solving multi-objective optimization problems. J. Comput. Des. Eng. 9 (1), 24–50. doi:10.1093/jcde/qwab065
Premkumar, M., Jangir, P., Sowmya, R., and Elavarasan, R. M. (2021). Many-objective gradient-based optimizer to solve optimal power flow problems: Analysis and validations. Eng. Appl. Artif. Intell. 106, 104479. doi:10.1016/j.engappai.2021.104479
Psychoula, Ismini, Gutmann, A., Mainali, P., Lee, S. H., Dunphy, P., and Petitcolas, F. (2021). Explainable machine learning for fraud detection. Computer 5410, 49–59. doi:10.1109/mc.2021.3081249
Rashedi, E., Nezamabadi-Pour, H., and Saryazdi, S. (2009). Gsa: A gravitational search algorithm. Inf. Sci. 179 (13), 2232–2248. doi:10.1016/j.ins.2009.03.004
Ruan, J., Zhan, Q., Tang, L., and Tang, K. (2018). Real-time temperature estimation of three-core medium-voltage cable joint based on support vector regression. Energies 11 (6), 1405. doi:10.3390/en11061405
Sayed, G. I., and Hassanien, A. E. (2018). A hybrid SA-MFO algorithm for function optimization and engineering design problems. Complex Intell. Syst. 4 (3), 195–212. doi:10.1007/s40747-018-0066-z
Sedaghat, A., and De Leon, F. (2014). Thermal analysis of power cables in free air: Evaluation and improvement of the IEC standard ampacity calculations. IEEE Trans. Power Deliv. 29 (5), 2306–2314. doi:10.1109/tpwrd.2013.2296912
Storn, R., and Price, K. (1997). Differential evolution–a simple and efficient heuristic for global optimization over continuous spaces. J. Glob. Optim. 11 (4), 341–359. doi:10.1023/a:1008202821328
Swift, G., Molinski, T. S., and Lehn, W. (2001). A fundamental approach to transformer thermal modeling. I. Theory and equivalent circuit. IEEE Trans. Power Deliv. 16 (2), 171–175. doi:10.1109/61.915478
Tang, A., Zhou, H., Han, T., and Xie, L. (2021). A chaos sparrow search algorithm with logarithmic spiral and adaptive step for engineering problems. Henderson, NV, United States: CMES-COMPUTER MODELING IN ENGINEERING & SCIENCES.
Wang, P., Liu, G., Ma, H., Liu, Y., and Xu, T. (2017). Investigation of the ampacity of a prefabricated straight-through joint of high voltage cable. Energies 10 (12), 2050. doi:10.3390/en10122050
Wang, X., and Wang, L. (2011). A new perturbation method to the Tent map and its application. Chin. Phys. B 20 (5), 050509. doi:10.1088/1674-1056/20/5/050509
Xavier, F. J., Pradeep, A., Premkumar, M., and Kumar, C. (2021). Orthogonal learning-based Gray Wolf Optimizer for identifying the uncertain parameters of various photovoltaic models. Optik 247, 167973. doi:10.1016/j.ijleo.2021.167973
Xue, J., and Shen, B. (2020). A novel swarm intelligence optimization approach: Sparrow search algorithm. Syst. Sci. Control Eng. 8 (1), 22–34. doi:10.1080/21642583.2019.1708830
Zhang, C., and Ding, S. (2021). A stochastic configuration network based on chaotic sparrow search algorithm. Knowledge-Based Syst. 220, 106924. doi:10.1016/j.knosys.2021.106924
Keywords: cable joint, temperature inversion, neural network, sparrow search algorithm, UMAP dimension reduction, non-embedded detection
Citation: Tian W, Hesheng Z, Qinghua Z and Nanji W (2022) A precise inversion method of cable joint core temperature with non-embedded detection based on UMAP and ISSA-BPNN. Front. Energy Res. 10:1028423. doi: 10.3389/fenrg.2022.1028423
Received: 26 August 2022; Accepted: 28 October 2022;
Published: 16 November 2022.
Edited by:
Gabriel Santos, Instituto Superior de Engenharia do Porto (ISEP), PortugalReviewed by:
Premkumar M., GMR Institute of Technology, IndiaCopyright © 2022 Tian, Hesheng, Qinghua and Nanji. This is an open-access article distributed under the terms of the Creative Commons Attribution License (CC BY). The use, distribution or reproduction in other forums is permitted, provided the original author(s) and the copyright owner(s) are credited and that the original publication in this journal is cited, in accordance with accepted academic practice. No use, distribution or reproduction is permitted which does not comply with these terms.
*Correspondence: Wu Tian, d3V0aWFuQGN0Z3UuZWR1LmNu
Disclaimer: All claims expressed in this article are solely those of the authors and do not necessarily represent those of their affiliated organizations, or those of the publisher, the editors and the reviewers. Any product that may be evaluated in this article or claim that may be made by its manufacturer is not guaranteed or endorsed by the publisher.
Research integrity at Frontiers
Learn more about the work of our research integrity team to safeguard the quality of each article we publish.