 Wei Yang
 Bo Huang1
 Anan Zhang
95% of researchers rate our articles as excellent or good
Learn more about the work of our research integrity team to safeguard the quality of each article we publish.
Find out more
ORIGINAL RESEARCH article
Front. Energy Res., 30 September 2022
Sec. Smart Grids
Volume 10 - 2022 | https://doi.org/10.3389/fenrg.2022.1023822
This article is part of the Research TopicPlanning, Operation and Control of Modern Power System with Large-scale Renewable Energy GenerationsView all 11 articles
As the lifeline of energy supply for various offshore projects, accurately evaluating and predicting the operation status of submarine cables are the foundation for the reliable operation of energy systems. Based on fully mining the dynamic and static characteristics of submarine cable operation and maintenance data, this paper proposes a submarine cable operation status prediction method based on a convolutional neural network—bidirectional gated recurrent unit (CNN-BiGRU) integrating attention mechanism. Firstly, the evaluation index system of the submarine cable operation status is established by considering three key influencing factors including online monitoring, routine inspection, and static test. Then, the operation condition evaluation model for submarine cable is constructed based on the cooperative game theory and the multi-level variable weight evaluation. Finally, the CNN-BiGRU combined neural network model integrating the attention mechanism is established, and the historical operation data and condition quantification results (health value) are used as input characteristic parameters to predict the evolution trend of the operation status of the submarine cable. The case study shows that the proposed method can effectively predict the operation status of submarine cables, and the root mean square error of the prediction is as low as 1.36%, which demonstrates the superior performance compared with the back propagation (BP) neural network, CNN, long short-term memory (LSTM), CNN-LSTM, and other algorithms.
In order to achieve carbon neutrality and solve the global energy crisis, the utilization of marine resources is in a stage of rapid increase, which has driven the rapid development of various offshore wind farms, offshore oil and gas platforms, and other marine projects. Submarine cables are not only the main artery between offshore wind farms and onshore power systems but also the lifeline of power and communication between offshore platforms and production systems, as well as the strategic foundation for building new offshore power systems based on distributed renewable energy (Bastien et al., 2018; Liu X.et al., 2019; Purvins et al., 2018). Until 2021, there are more than 450 submarine cables in use around the world, with a total length of over 1.2 km × 106 km (Xie et al., 2022). The reliable operation of submarine cables is essential for the normal operation of offshore projects. Due to the particularity of the environment where the submarine cable is located, it is inconvenient to carry out a routine manual inspection or UAV inspection. In recent years, thanks to the rapid development and application of optical fiber sensing technology, the relevant operating parameters of the submarine cable can be obtained in real-time (Fang et al., 2020; Antonio et al., 2021; Miguel et al., 2021; Cao et al., 2022), such as temperature, disturbance, strain, and other information of the submarine cable. These monitoring data can be used for operating condition evaluation and condition prediction (Lv et al., 2014; Xu et al., 2019), so as to understand the health status of the submarine cable, and the preventive maintenance can be carried out in a targeted manner, thereby improving the operation reliability of the offshore integrated energy system.
Condition monitoring and evaluation play an indispensable role in the electrical equipment area, many scholars have carried out related research on this issue. In terms of submarine cables, Wei et al. (2015) proposed an online monitoring method for 500 kV submarine oil-filled cable sheath insulation, and Liu Z. et al. (2019) established an evaluation model for the deterioration state of submarine cables considering factors such as morphology, chemical structure, mechanical properties, thermal properties, and dielectric properties, and the transformation of the sheath insulation current leakage ratio and the grounding loop circulating current inductance were used as the basis for sheath insulation judgment, and insulation condition of the submarine cable jacket was monitored by Zhou et al. (2018) and Nie et al. (2020). According to the requirements of field survey and data management in submarine cable inspection by remote-operated vehicle (Lei, 2021), analyzed the characteristics of submarine cable tracker and underwater video inspection data, designed reasonable system architecture, implemented real-time monitoring and data management of submarine cable inspection based on underwater navigation and positioning. Chen et al. (2021) proposed enhanced coherent optical time-domain reflectometry (E-COTDR) for monitoring submarine cable loss and vibration. Chen et al. (2020) established a temperature monitoring system based on Brillouin Optical Time Domain Analysis (BOTDA) technology, and the accuracy of the submarine cable temperature monitoring system based on optical fiber technology was verified. Jianfeng, (2019) proposed a submarine cable fault data monitoring method based on big data fusion and feature extraction. However, few studies have focused on the comprehensive evaluation and prediction of the submarine cable operating condition, which is essential for preventive maintenance.
With the rapid development of artificial intelligence, various intelligent algorithm models have been wildly used in various fields, such as load prediction and condition prediction. Pu et al. (2020) and Liu et al. (2019a) expounded on the application and development of big data in electrical equipment condition monitoring and analyzed the existing deficiencies and prospects. Xu and Jiang, (2022) developed a power load prediction method based on BiGRU-Attention-SENet, which combines the characteristics of different neural networks to improve accuracy. Tang and Yuan, (2022), Dai et al. (2018), and Song et al. (2018) used neural network models, such as CNN-BiGRU and LSTM, to predict the remaining useful life of lithium batteries and the condition of transformers. However, due to the special application scenarios and equipment properties of submarine cables, there are few studies dedicated to the evaluation and prediction of their operating condition.
Therefore, a submarine cable operation condition evaluation and prediction method based on CNN-BiGRU integrating attention mechanism is proposed in this paper. Firstly, a submarine cable status evaluation index system is established based on relative industry standards. Secondly, based on the cooperative game theory and the idea of multi-level variable weight, the comprehensive evaluation model of health status for submarine cables is developed. Thirdly, a submarine cable operation status prediction method based on CNN-BiGRU integrating attention mechanism is proposed, and the historical operation data and condition evaluation results are used as input characteristic parameters to predict the operation condition of submarine cables. Finally, the validity and feasibility of the proposed methodology are demonstrated through a submarine cable in Bohai, China. The contributions of this paper are as follows:
(1) Based on the industry guidelines and comprehensively considering the structural characteristics, operation history, maintenance and fault data of submarine cables, and the online monitoring data, a submarine cable status evaluation index system is established, which can accurately and comprehensively evaluate the operation condition of submarine cables.
(2) A multi-level variable weight submarine cable condition evaluation method is developed based on cooperative game theory, which can effectively change the evaluation weight adaptively according to different operating periods of the submarine cable, in order to obtain an appropriate comprehensive submarine cable operating condition.
(3) A CNN-BiGRU model integrating attention mechanism is proposed to predict the condition of submarine cables. CNN is used to exploit the relationship between the various feature parameters, while BiGRU is used to capture long-term decencies from time series data. The attention mechanism is introduced to give different weights to the implied conditions of BiGRU through the mapping weighting and learning parameter matrix, so as to strengthen the influence of important information and further improve the forecasting efficiency.
(4) To verify the effectiveness of the proposed model, it is compared with different models, such as BP, LSTM, GRU, CNN-LSTM, and CNN-BiGRU. The maximum percentage of prediction error σE-max, the root mean square error RMSE, and the mean absolute percentage error MAPE of different models are calculated to evaluate the performance. The results demonstrate that the forecasting accuracy of the proposed model is greatly improved.
The remainder of this paper is organized as follows: The operation condition evaluation model of submarine cable is described in Section 2, and Section 3 presents the CNN-BiGRU prediction method integrating the attention mechanism for submarine cable operation condition. Case studies are conducted and analyzed in Section 4. Finally, conclusion are drawn in Section 5.
Considering that many indicators can reflect the operating status of submarine cables, on the basis of fully considering the structural characteristics, operation history, maintenance, and fault data of submarine cables, combined with the “Operation Regulations for Submarine Power Cables (DL/T1278-2013)” issued by the National Energy Administration of China, this paper constructs an evaluation index system of submarine cable operation condition covering three aspects: online monitoring, routine inspection and static test, which integrates 21 important indicators for the submarine cable components, as shown in Figure 1.
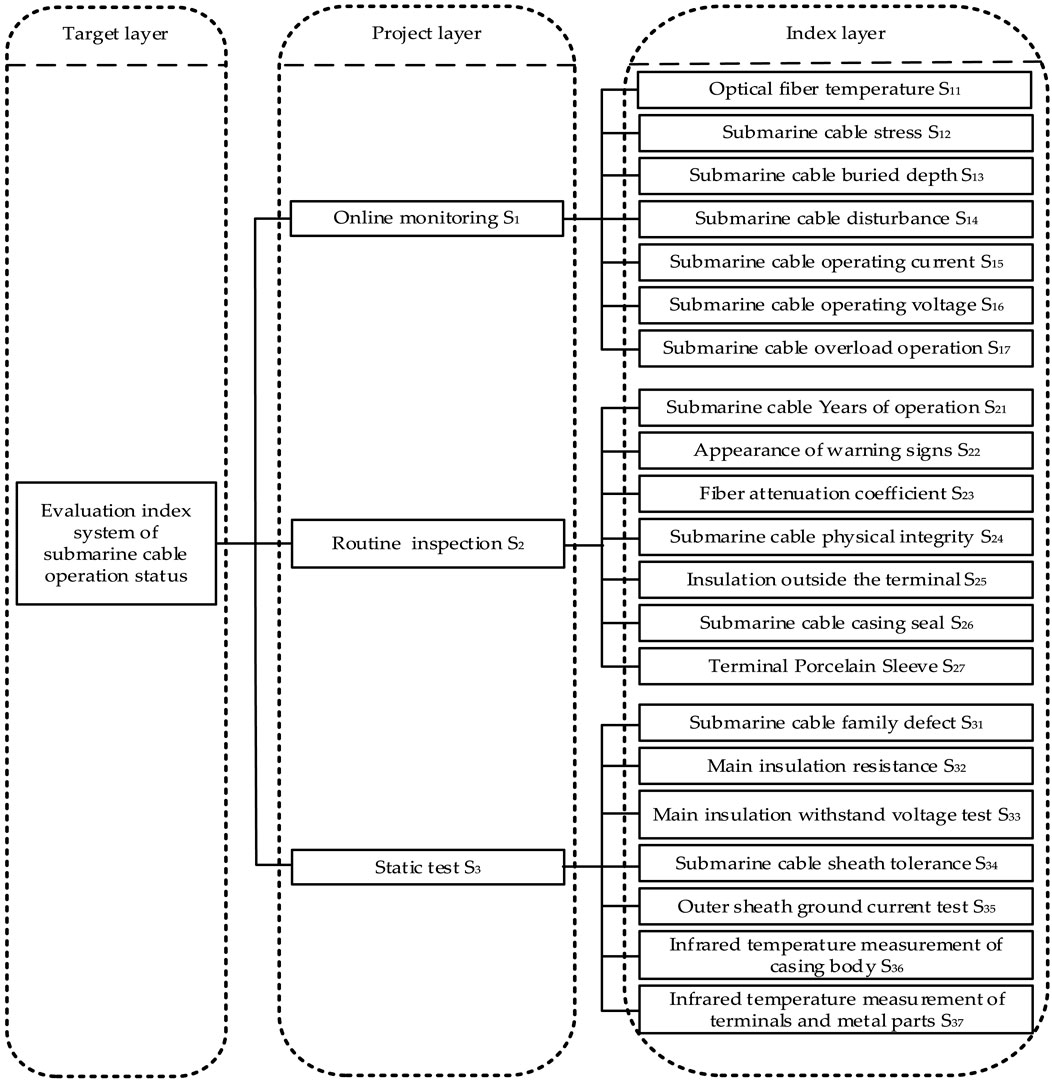
FIGURE 1. Evaluation index system of submarine cable operation condition.
AHP is the most commonly used weight determination method in the condition assessment research field. It has high practicability and simplicity, and its essence is to obtain its importance scale C (C = 1, 2, , 9) for subsequent calculation. Cause the value of C is relatively fixed, the result will deviate from the ideal expected value during the weight calculation. Besides, due to the ambiguity caused by scattered comparison, a consistency check is required (Cui et al., 2021; Ge et al., 2022). Therefore, an improved AHP method is proposed, and the process is as follows:
(1) Determine the importance of indicators.
In this paper, the score is used to replace the 1–9 scale method used by traditional AHP. First, the industry standards are comprehensively considered to obtain the importance score S of each indicator, and then the corresponding judgment matrix is obtained by comparing the importance scores of each indicator. The contrasted factor values are more accurate, and due to the certainty of the importance score, the proposed method does not need to be checked for consistency.
(2) Construct the judgment matrix.
Based on the importance value of each index obtained, a judgment matrix C1 is constructed by quantifying the comparison factor cij (i, j = 1, 2,...,n):
The mathematical expression of cij is:
where cij is the value of the i-th row and j-column of the constructed matrix, and Si is the importance score of the i-th index.
(3) Determine the subjective weights.
The row means of the constructed judgment matrix after column normalization is the weight w, and its mathematical expression is:
where cij* is the value after column normalization of the data in the i-th column and the j-th row, wj_subjective is the subjective weight of the j-th index.
Entropy is a measure for judging the degree of disorder of the system. The entropy weight measures the dispersion degree of each grass-roots index through the entropy value and then judges the degree of influence (weight) of the index on the comprehensive result (Zhu et al., 2020). The basic process is as follows: For the selected n indicators and m groups of evaluation data, the evaluation data is normalized to construct an evaluation matrix C2 (m × n):
where xij is the i-th group of data of the j-th index.
The data of C2 is normalized by the range transformation method (that is, the worst value of each attribute after processing is 0, and the optimal value is 1) to calculate the data index ratio zij, and its mathematical expression is:
where (7) and (8) are the range transformation formulas of benefits data and cost data, respectively. X*, Xmax, and Xmin are the value after range processing, the maximum value of the column, and the minimum value of the column, respectively. zij is the data index ratio of the j-th item evaluation index (when zij is 0, take lnzij = 0).
According to the normalized data, the information entropy ej of each index is obtained, and the entropy weight w of each evaluation index is finally calculated. Its mathematical expression is:
where wj_objective is the objective weight of the j-th index.
The basic idea of the cooperative game theory is to combine several different types of weight methods and use the cooperative game idea as a whole to determine the combined weight, so as to ensure the rationality and accuracy of the weight determination (Li et al., 2021). Denote the weight by method i (i = 1, 2,..., n) as W (i), and the final combined weight W. The specific steps are as follows:
(1) Consistency correlation coefficient calculation.
Denote W(m_i) as the combined weight obtained by m-1 methods other than the i-th method, and the mathematical expression of the consistency correlation coefficient L (i) is:
Where n is the number of evaluation indicators, and “—” means the average of the values.
(2) Calculate the combined weight W'(i).
(3) The combined weight is obtained recursively, that is, the number of weights is reduced by 1 after each calculation of the formula until the number of weights is 2.
(4) When the number of weights is 2, the mathematical expression of W'(i) is:
Regarding the weight coefficient of the project layer of the evaluation system is relatively fixed, due to the difficulty of inspection and testing for the submarine cable. A dynamic adaptive mechanism is used to determine the weight of the project layer: 1) when the submarine cable is in the inspection and static test stage, weights of monitoring, inspection indicators, and static tests are determined based on the guidelines and improved AHP. 2) when the inspection indicators and static tests are in a stable period, the weights of the indicators of each project layer are dynamically updated based on the expert evaluation results, so as to more accurately grasp the real-time operation status of submarine cables. Taking a certain period of submarine cable as an example, experts fully consider the historical condition and determine the importance score k (k = 0, 1, …, 5) of each project layer according to factors such as the operating period of the submarine cable, and accumulate the importance score of the project layer. The mathematical expression of value Ki is as follows:
Where Ki is the sum of the expert scores at the i-th project level, and n is the number of experts participating in the scoring as shown in Table 1.
According to scoring results of the experts, the latest weight of each project layer is calculated by using the AHP method. The construction matrix and its results are shown in Table 2. The mathematical expression of the calculation process is as follows:
where Sij∗ is the value after column normalization of the data in the i-th column and the j-th row, and wj_project is the row mean (weight).
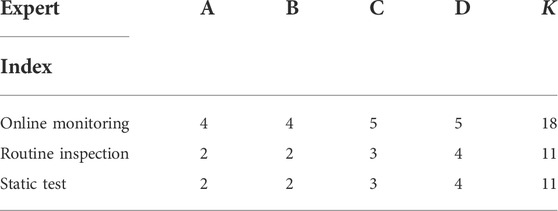
TABLE 1. Expert scoring table of project-level importance at a certain time.
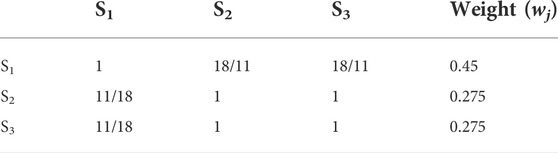
TABLE 2. AHP calculation of project layer weight.
The mathematical expression of the final health value M of the submarine cable is as follows:
where KT is the life coefficient, m is the sum of the evaluation index of the submarine cable.
The mathematical expressions of KT and m are:
where n is the number of index layers, λ is operation years, wi is the weight coefficient of each project layer, mi is the evaluation value, and the mathematical expression is:
where wij is the grass-roots index weight, Kij is the family defect coefficient, it equals 0.95 if there is a family defect, and 1 if there is no family defect. gij is the evaluation value of a single indicator and its mathematical expression is:
Where ywr, ynow, and yst are the warning value, monitoring value, and standard value of the indicator, respectively.
The obtained comprehensive health assessment value M of the submarine cable is used as the predicted output label to calibrate the operation condition of the submarine cable. The numerical segmentation of M is as follows:
The advantage of CNN is to mine the potential associations and local features of the data to improve the efficiency and accuracy of the model with higher fault tolerance. The core of its structure is the convolution layer, which obtains potential features through the convolution operation between the convolution kernel and the input data. The mathematical expression is:
where xji is the i-th feature of the output of the j-th layer, xj-1 is the output of the j-1th layer, wji is the weight matrix of the i-th convolution kernel of the j-th layer, bji is the bias term, and ∗ is the convolution operator.
The relu activation function is used for all of the models in this paper, and its mathematical expression is:
The structure diagram of CNN is shown in Figure 2 (Li et al., 2013).
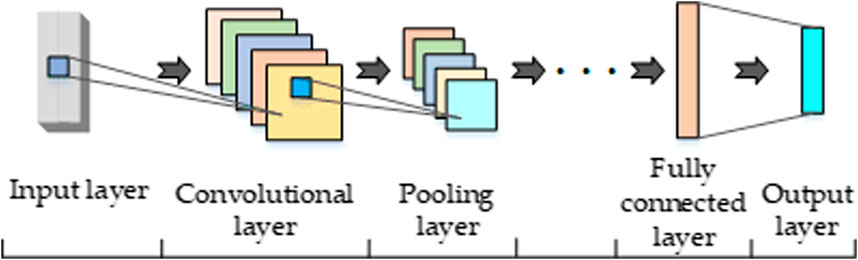
FIGURE 2. Structure diagram of CNN.
LSTM neural network is the most commonly used network model for processing sequence data. It can achieve long-term memory through a unique gating unit, and then effectively solve the gradient problem existing in traditional recurrent neural networks. Compared with LSTM, GRU has a simpler structure, fewer parameters, higher computation efficiency, and better generalization. It filters and transmits useful information through the update gate and reset gate in the unique neuron state for subsequent data processing, discards low-value information, and outputs the hidden state at each moment, so as to achieve the key information extraction and solve the gradient discrete problem. BiGRU network makes the data flow in two directions based on GRU, realizing deeper feature mining and more efficient use of data, and the mathematical expression of the GRU gating unit is as follows (Li et al., 2022; Yang et al., 2022):
where zt and rt represent the update gate and reset gate; σ is the Sigmoid function; tanh is the hyperbolic tangent function; W(z), W(r), U(z), U(r), U, W are the matrix of training parameters, ∗ represents the product of the matrix, and ht2 is the summary of the input xt and the output result of the previously hidden layer ht-1.
The BiGRU structure is shown in Figure 3 (Zhang et al., 2022).
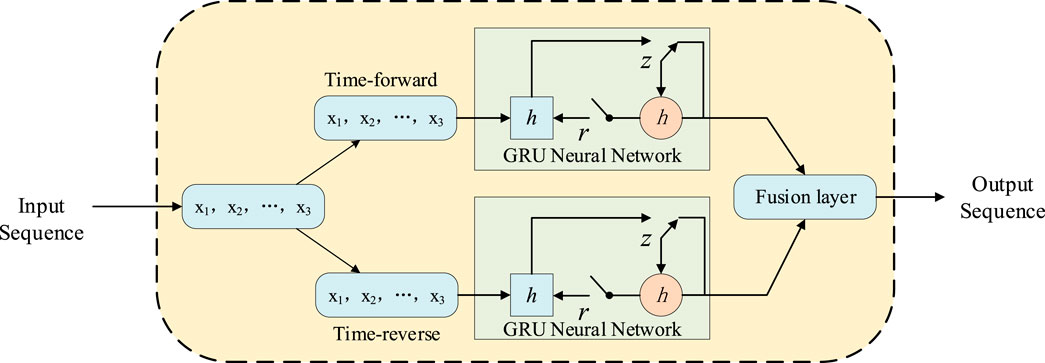
FIGURE 3. The structure of the BiGRU network.
The essence of AM is to give higher weights to key features and reduce the weights of other parts accordingly, so as to extract key information from the feature data (Niu et al., 2022; Deng et al., 2021). In this paper, the features extracted from the CNN-BiGRU combined neural network model are fused with the attention mechanism: the CNN is used to extract the static features of the data, denoted as C, and the BiGRU is used to extract the time-series features of the data, denoted as G, and the formula of its fusion is (30). The correlation between the data feature and the i-th historical feature Fi is measured by the dot product operation, and then the attention value A is obtained. As shown in Eq. 31, the weighted sum of the historical features is calculated according to the attention value, namely the final data feature FA (Lin et al., 2022). Through the fusion of feature extraction and attention mechanism performed by the CNN-BiGRU combined neural network, the model can fully extract the static and time-series features of historical data, and dynamically adjust them according to the importance of different features, so as to obtain better results.
where ba is the bias term obtained by training, F is the fused data feature, FA is the final data feature, Wa is an adaptive weight matrix obtained by training the attention mechanism.
Compared with the traditional neural network, CNN can efficiently and accurately extract the inherent features of the data set, but it cannot effectively use the time-series features existing in the data. Although a single BiGRU neural network can effectively extract and utilize the temporal features in the dataset, it is relatively inefficient for the use of correlation features in the data. When using a single CNN and BiGRU neural network to process long-term sequences or face multi-dimensional input data, problems such as insufficient data feature mining and loss of sequence or associated features will occur. Therefore, this paper complements the advantages of these methods, and a CNN-BiGRU combined neural network integrating the attention mechanism is proposed to improve the prediction performance.
The framework of the proposed model for the condition prediction of the submarine cable is shown in Figure 4. First, the historical operation data of the submarine cable and the comprehensive health value quantification are processed through the submarine cable operation condition evaluation model. Then, the historical operation data and condition quantification results are imported into the proposed combined neural network model to realize the operation condition prediction of the submarine cable.
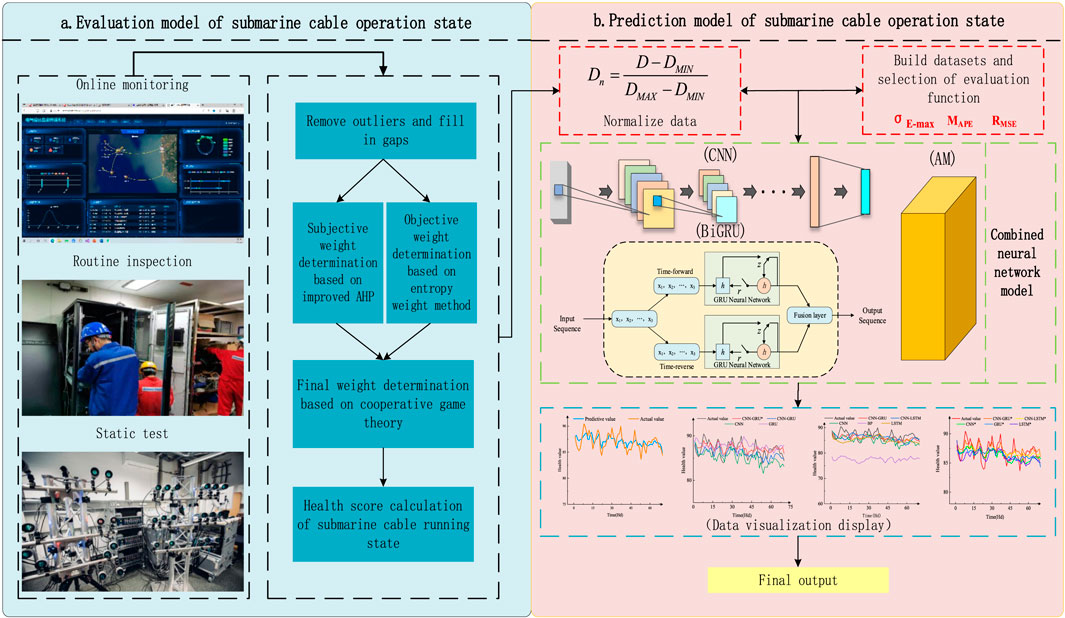
FIGURE 4. Prediction model of submarine cable operation condition considering condition evaluation.
Take each index value of the submarine cable operation status evaluation index system established in this paper as the original import data, and time step is half a day (Hd). In order to solve the problem of large error caused by abnormal data in the data set, the mean square method is adopted to process the data set, and its mathematical expression is as follows:
where N is the numbers of data of this type, and xi is the value of the i-th evaluation. If |xi - u|>3δ, it is judged that xi is an abnormal point, and the point is eliminated.
In order to solve the negative impact caused by the different dimensions and the large differences of the input data, before the model training, the maximum and minimum values of various data in the data set are used as the benchmark to normalize the data set. The formula is:
where Dn is the data obtained after normalization, D is the data before processing, DMIN and DMAX are the minimum and maximum values of this type of data, respectively.
In order to evaluate the prediction accuracy of the proposed method, the maximum percentage of prediction error σE-max, the root mean square error RMSE, and the mean absolute percentage error MAPE were selected. The mathematical expression is as follows (Liu et al., 2019b):
where yi is the actual value of the i-th sample point; ypi is the predicted value of the i-th sample point; N is the number of sample points.
It is worth noting that in order to ensure the scientificity and unity of the model training and prediction process, the RMSE and MAPE of the prediction results are the average values obtained by the models.
In this paper, the control variable method is used to optimize the structure of the proposed model. Regarding the importance of the number of BiGRU network layers, the prediction performance is tested by continuously increasing the number of BiGRU layers. The basic parameters of the CNN module and attention module remain unchanged, and the effect of the BiGRU layer on the prediction results is tested. Experiments show that when the number of BiGRU layers is 2, all of the evaluation indexes reach the optimal values, and then the error rate begins to rise, indicating that the model is over-learning. The results are shown in Table 3.
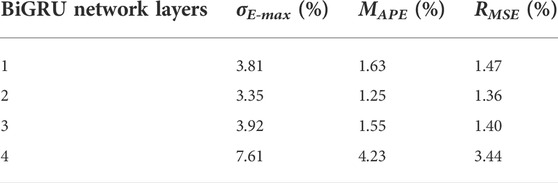
TABLE 3. Experimental results of model network layer optimization.
The number of convolution kernels of the CNN neural network is set as 10, the size of the convolution kernel is set as 2, and the step size is set as 1, the same convolution is selected for the convolution method, and valid maximum pooling is performed after continuous convolution. The BiGRU neural network adopts a sliding-window data reading mode, as shown in Figure 5, the time step is set to 10, and the batch size is set to 30 (Su et al., 2021; Jinah et al., 2022). The Adam algorithm is used to iteratively update the weights so that the weights and deviations of each neuron are continuously updated through the momentum and adaptive learning rate, so as to optimize the output value of the loss function. To deal with the possible overfitting problem, the Dropout method is used during the training. In the process of randomly discarding the network nodes from the network according to a certain probability, the attention mechanism is integrated into the training of CNN and BiGRU to improve the accuracy of the model. The mathematical expression of the loss function is:
where Floss, λact(t), λpred(t), and n are the loss function of the model, the actual and predicted health values at time t, and the number of training samples, respectively.
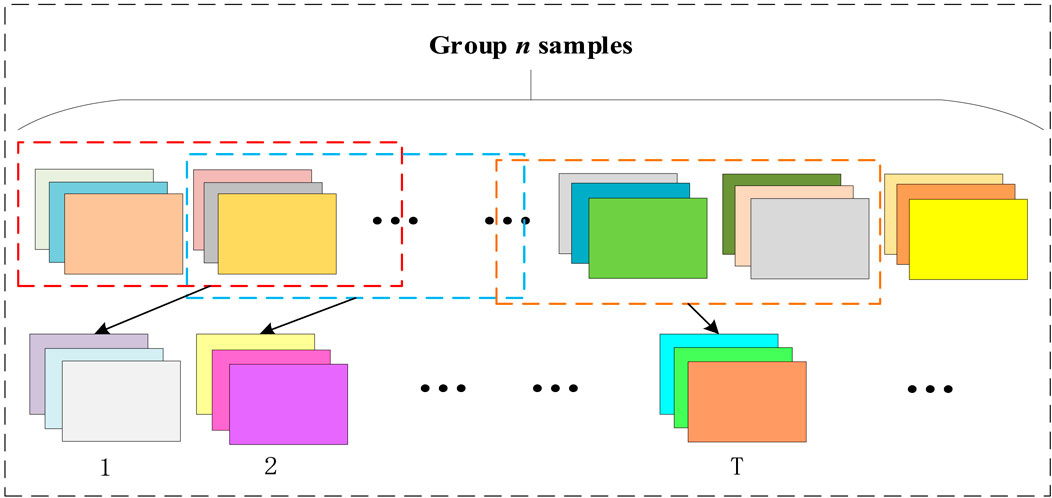
FIGURE 5. Sliding window data reading mode.
In order to verify the feasibility and accuracy of the proposed method in this paper, the HYJQF41-F 35 KV three-core submarine cable of an offshore oil and gas platform in the Bohai Sea is taken as the research object. Its structure is shown in Figure 6. From 2021 to 2022, a total of 510 groups of monitoring and routine inspection data in 255 days are used. The training set is divided according to 88%, and the rest of the data is used as a test set, and the predicted results are compared with actual values.
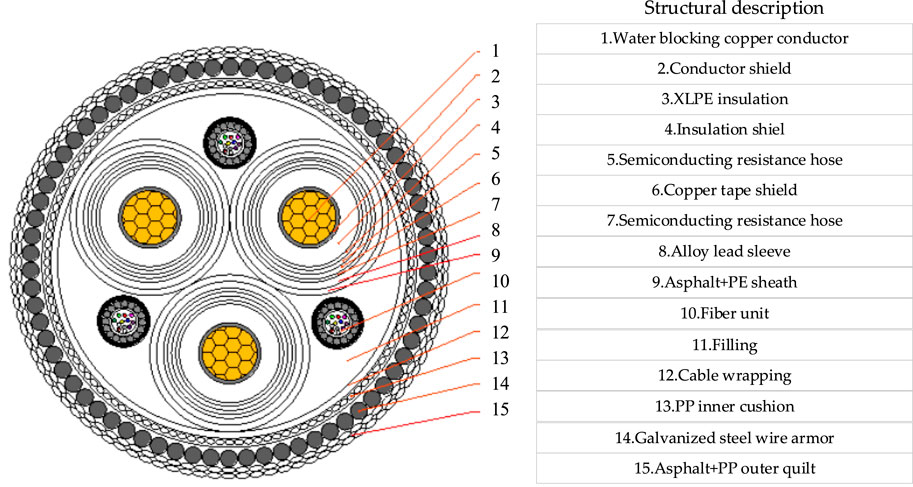
FIGURE 6. Structure diagram of HYJQF41-F 35 KV submarine cable.
Taking a certain set of data selected in this paper as an example, the single-item evaluation index data of online monitoring is shown in the Table 4. Substitute the standard value, attention value, and monitoring value of each index into Eq. 21 to obtain the single-item evaluation score, and then substitute it into Eq. 20 to obtain a single weighted score, and the cumulative health value of the online monitoring module is 95.31, and its operating condition is normal, which is consistent with the actual situation on site, as shown in Table 4.

TABLE 4. Online monitoring index and evaluation results.
The selected data set is evaluated and quantified by the evaluation model of the submarine cable operation condition proposed in this paper, and then the input feature set is formed and imported into the constructed CNN-BiGRU-AM prediction model. The prediction results are shown in Figure 7. As can be seen from Figure 7, the overall health status value of submarine cables fluctuated between 80 and 90 during this period. Due to the influence of various factors, it fluctuates within a certain range, but it is generally stable and shows a certain downward trend, which is in line with the actual condition of the submarine cable. Besides, the three evaluation indicators: the maximum percentage of prediction error σE-max, the root mean square error RMSE, and the average percentage error MAPE are 3.35%, 1.36%, and 1.25%, respectively, which illustrates its prediction accuracy, and can provide effective support for the operation decision of submarine cables.
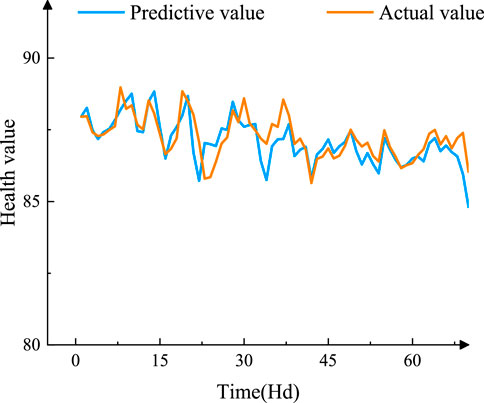
FIGURE 7. Prediction results.
In order to verify the effectiveness and superiority of the proposed model in this paper, the same data set is input into CNN, LSTM, CNN-LSTM, and other neural network models. The training time required for a single round and single step of each model are recorded, and the results are shown in Table 5. It is noted that the right column of the table indicates that the model incorporates an attention mechanism.
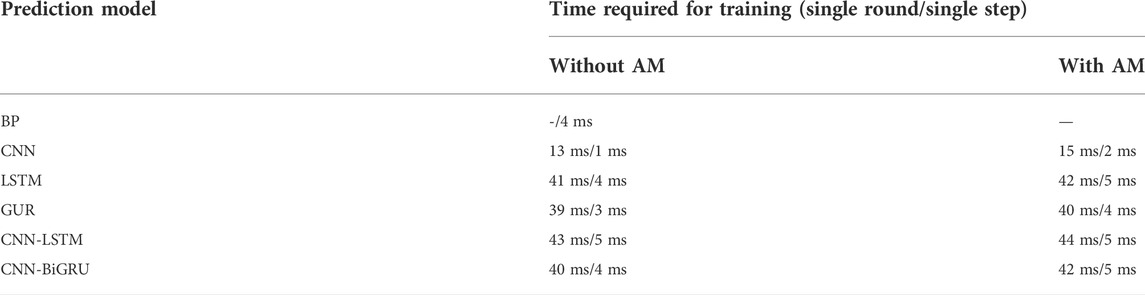
TABLE 5. Comparison of running speed of each model.
From Table 5, it can be seen that the time spent by each neural network model is prolonged after combining with each other or integrating an attention mechanism. Among them, CNN has the fastest training rate, LSTM has the longest time due to its cumbersome gate structure, and the BiGRU network has certain advantages in terms of speed.
In order to verify the validity of the prediction model proposed above, the maximum percentage of prediction error σE-max, the root mean square error RMSE, and the mean absolute percentage error MAPE are calculated respectively. The comparison results of various indicators are shown in Table 6 and Figures 8, 9.
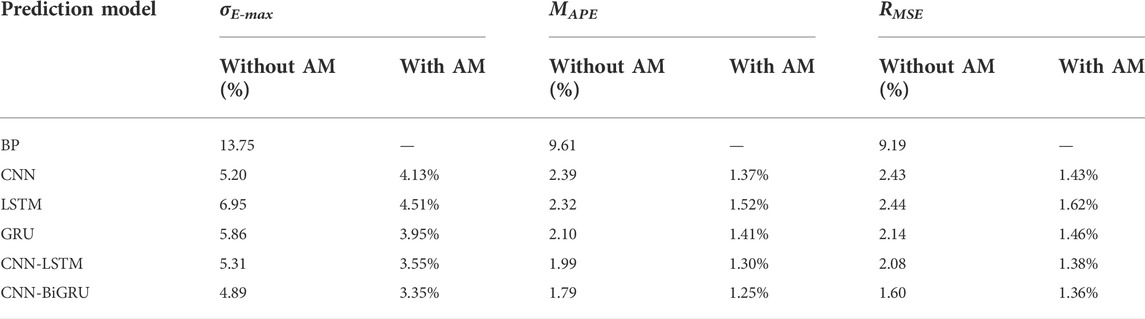
TABLE 6. Comparison of prediction results of various models.
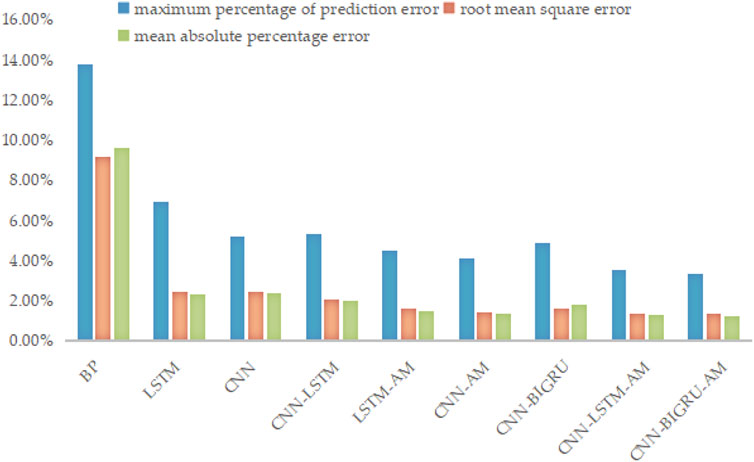
FIGURE 8. Comparison of various models.
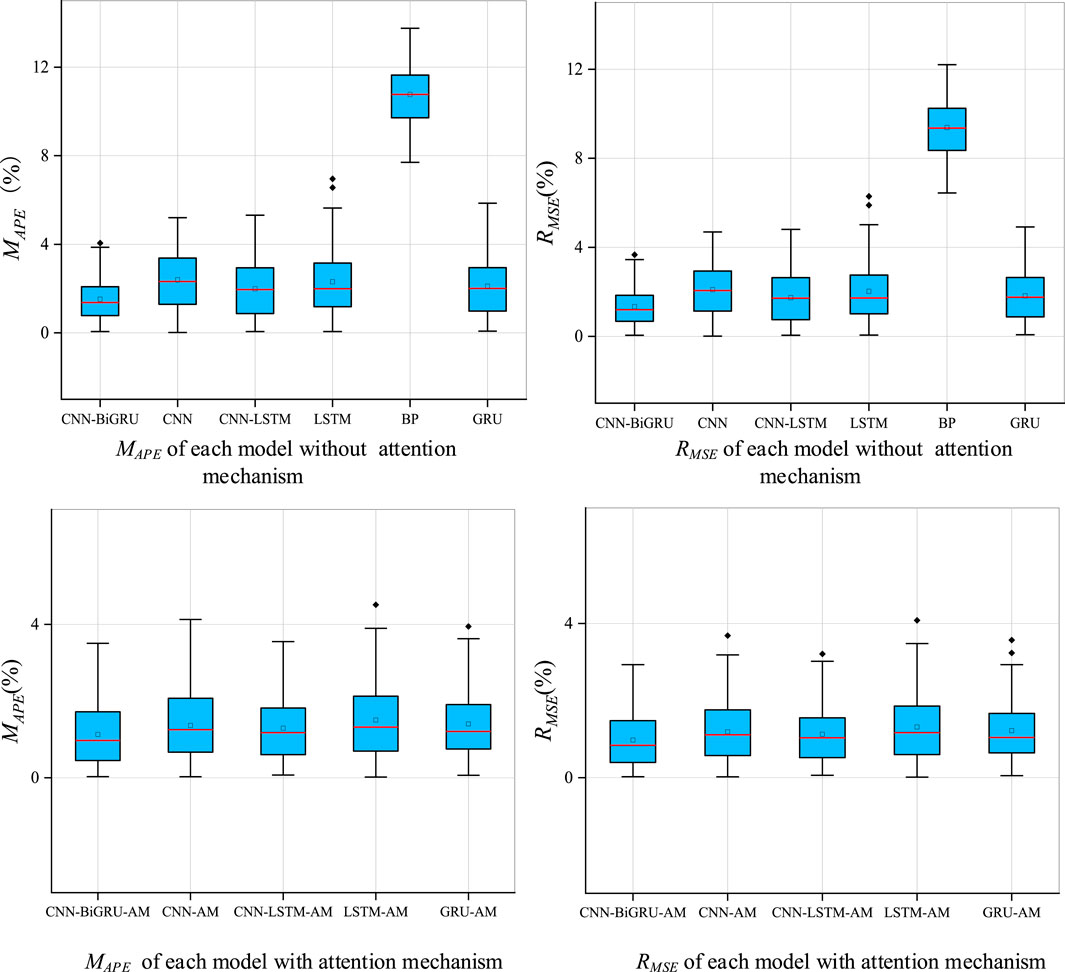
FIGURE 9. MAPE and RMSE of different models with and without attention mechanism.
According to the comparison information of different models in Table 6, compared with other similar neural network models, CNN-BiGRU-AM has the best prediction accuracy in each evaluation index, and further combined with the box plot shown in Figure 9, we can see that the average error and discrete error of the model are obviously dominant. From the perspective of whether the neural network model is combined or not, compared with the single neural network model, the maximum error percentage σE-max, the average absolute percentage MAPE and the root mean square error RMSE of the combined neural network model are improved, and the comparison results are shown in Figure 10.
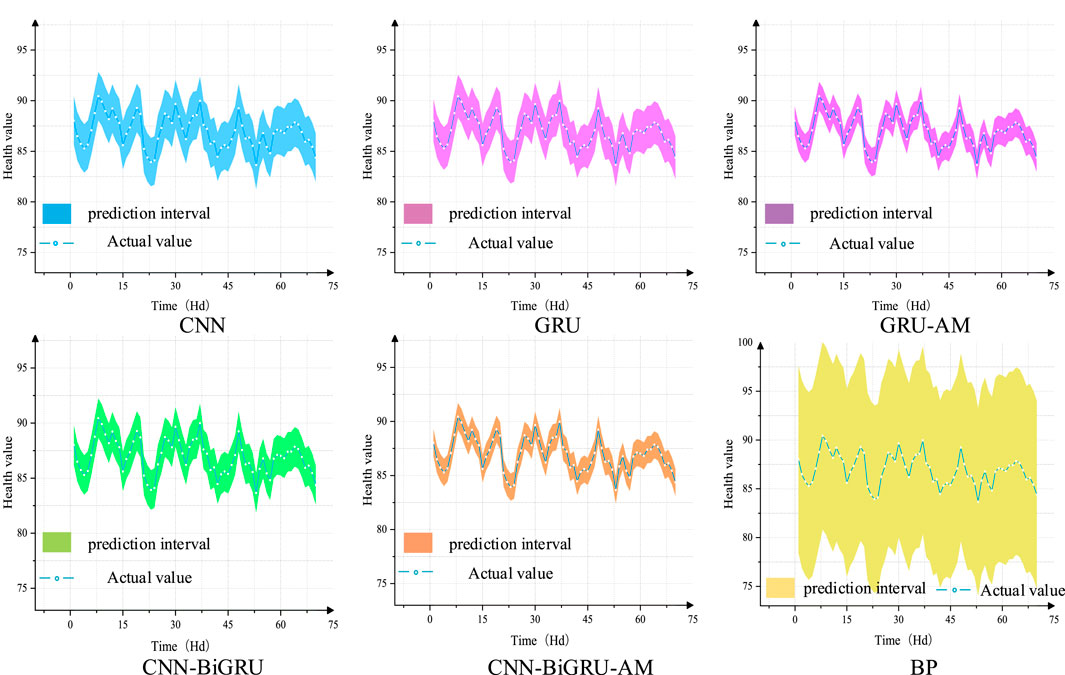
FIGURE 10. Effect comparison of important single and combined models.
The attention mechanism is an important module of the proposed model optimization and feature fusion. From the perspective of whether the model integrates the attention mechanism or not, the maximum percentage of prediction errors σE-max, the mean percentage error MAPE and root mean square error RMSE increased by 1.54%, 0.3%, and 0.26%, respectively. Compared with other similar neural network models, each evaluation index has been improved by up to 9.03%, 7.72%, and 6.81%, reaching 3.35%, 1.25%, and 1.36%, respectively. The performance of each models with and without attention mechanism are shown in Figures 11, 12.
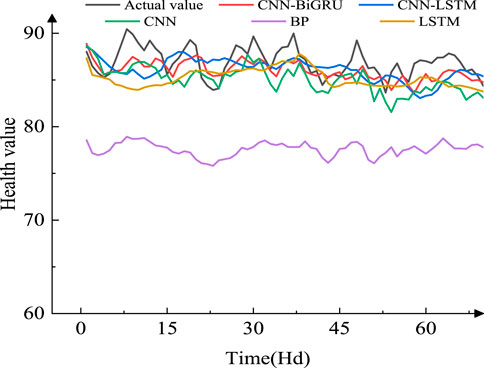
FIGURE 11. Comparison of prediction results of different models without attention of different models without attention.
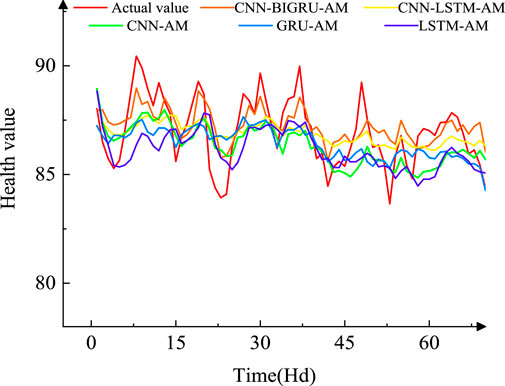
FIGURE 12. Comparison of prediction results of different models without attention of different models with attention.
It can be seen from Figure 11 that the predicted value of the BP neural network is significantly lower than the actual value, but it has a certain trend consistency, which shows that its processing capability for long-sequence multi-feature samples (such as submarine cable operation data) is relatively general. CNN prediction results have a good fluctuation fit, but due to low numerical value, the accuracy is not ideal, which may be caused by the insufficient extraction of sample time series features. LSTM network has better learning efficiency for time series data, although the maximum error value is relatively high. But due to the lack of correlation features, there is room for further optimization. CNN-LSTM is better than the above models in terms of overall fitting, and remains relatively stable when the fluctuation is small. The fluctuations and trends of the CNN-BiGRU network are similar to the CNN-LSTM network, both greater advantages and higher accuracy, but the former dominates in training efficiency (Table 5). From Figure 12, it can be found that after adding the attention mechanism, the curve fit of each neural network prediction model has been improved to varying degrees, which shows the effectiveness of the attention mechanism in neural network time series prediction. According to whether the unified network adds attention mechanism as a variable, the comparison effect is shown in Figure 13.
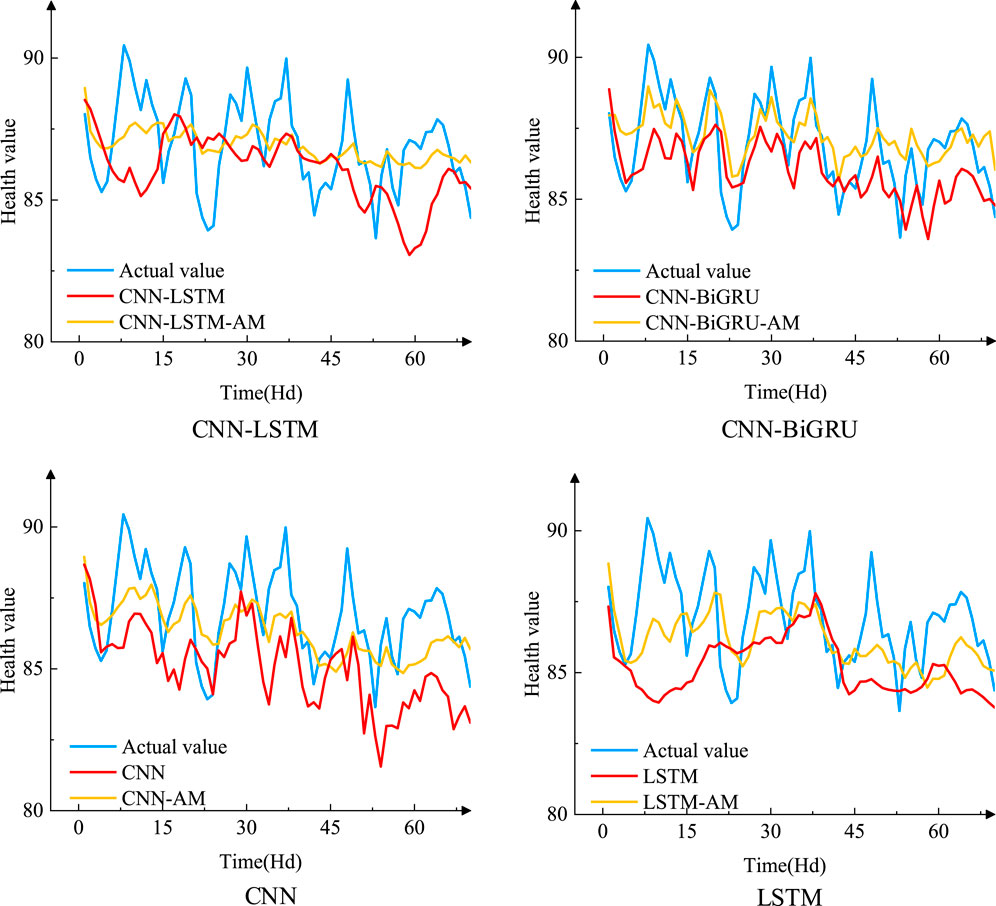
FIGURE 13. The effect of attention mechanism.
To sum up, the numerical example verifies the superiority of the model described in this paper, and the evaluation indexes (i.e. maximum error, root mean square error, and average percentage error) are better than other methods, and it can accurately predict the operation condition of submarine cables.
Aiming at the shortcomings of the existing research in the field of submarine cable operation condition evaluation and prediction, a submarine cable operation status evaluation index system is established in this paper, which includes online monitoring, routine inspection and static test. To obtain more scientific evaluation results, based on the improved AHP and cooperative game theory, a submarine cable operation condition evaluation model is constructed, and numerical quantification is carried out in combination with the guidelines and engineering practice. Besides, the CNN-BiGRU-AM combined neural network model is established by synthesizing the advantages of correlation feature extraction of CNN, the time-series feature extraction of BiGRU and the feature fusion advantages of the attention mechanism. By comparing with other neural network models, the better prediction accuracy verifies the advantages of the proposed model in processing long-sequence, multi-characteristic submarine cable operation data samples.
The original contributions presented in the study are included in the article/supplementary material, further inquiries can be directed to the corresponding author.
Conceptualization, WY, and BH; Methodology, WY, and BH; Validation, WY, and JL; Writing—original draft preparation, BH, and AZ; Writing—review and editing, BH and WY; Supervision, QL and XX.
This work was supported by the Sichuan (China) Science and Technology program (2020YFSY0037, 2022YFG0123), Central Government Funds for Guiding Local Scientific and Technological Development of China (2021ZYD0042, 2021ZYD0099).
Author XX was employed by PetroChina Dushanzi Petrochemical Company.
The remaining authors declare that the research was conducted in the absence of any commercial or financial relationships that could be construed as a potential conflict of interest.
All claims expressed in this article are solely those of the authors and do not necessarily represent those of their affiliated organizations, or those of the publisher, the editors and the reviewers. Any product that may be evaluated in this article, or claim that may be made by its manufacturer, is not guaranteed or endorsed by the publisher.
Antonio, M., Mattia, C., Jorge, C., Valey, K., Rafael, M., and Zhan, Z. (2021). Polarization sensing using submarine optical cables. Optica 8 (6), 788–795. doi:10.1364/OPTICA.424307
Bastien, T., Juan, B., Andrew, W., Gérard, T., Morgane, L., Nicolas, D., et al. (2018). A review of potential impacts of submarine power cables on the marine environment: Knowledge gaps, recommendations and future directions. Renew. Sustain. Energy Rev. 96, 380–391. doi:10.1016/j.rser.2018.07.026
Cao, C., Ge, Y., Ren, X., Peng, X., Chen, J., Lu, Z., et al. (2022). Experimental research on submarine cable monitoring method based on MEMS sensor. Micro Nano Eng. 15, 100130. doi:10.1016/j.mne.2022.100130
Chen, X., Zou, N., Liang, L., He, R., Liu, J., Zheng, Y., et al. (2021). Submarine cable monitoring system based on enhanced COTDR with simultaneous loss measurement and vibration monitoring ability. Opt. Express 29 (9), 13115–13128. doi:10.1364/OE.418920
Chen, Y., Wang, S., Hao, Y., Yao, K., Li, H., Jia, F., et al. (2020). The 500kV oil-filled submarine cable temperature monitoring system based on BOTDA distributed optical fiber sensing technology, in 2020 International Conference on Sensing, Measurement & Data Analytics in the era of Artificial Intelligence (ICSMD), 15-17 October 2020, Xi'an, China. (New Jersey, United States: IEEE).
Cui, X., Lu, F., He, Y., Ma, J., Liu, S., Xue, Q., et al. (2021). Two-dimensional evaluation model of electrical equipment based on combined weighting and rating algorithm. Energy Rep. 7, 443–448. doi:10.1016/j.egyr.2021.01.048
Dai, J., Song, H., Sheng, G., Jiang, X., Wang, J., and Chen, Y. (2018). Prediction method for power transformer running state based on LSTM network(article). High. Volt. Eng. 44 (4), 1099–1106. doi:10.13336/j.1003-6520.hve.20180329008
Deng, Y., Liu, X., Jia, R., Huang, Q., Xiao, G., and Wang, P. (2021). Sag source location and type recognition via attention-based independently recurrent neural network. J. Mod. Power Syst. Clean Energy 9, 1018–1031. doi:10.35833/MPCE.2020.000528
Fang, J., Peng, X., Liu, T., Chen, Y., Li, W., Wen, J., et al. (2020). Overview of big data development of power equipment condition monitoring. Power Syst. Prot. Control 48 (23), 176–186. doi:10.19783/j.cnki.pspc.200050
Ge, Q., Qiao, H., Li, C., Yang, Q., and Jiang, H. (2022). Real-time charging risk assessment for electric vehicles based on improved broad BP-AHP. IEEE Trans. Ind. Electron. 69 (9), 9472–9482. doi:10.1109/TIE.2021.3111591
Jianfeng, W. (2019). Monitoring method of submarine cable fault data. J. Coast. Res. 35, 735–740. doi:10.2112/SI93-102.1
Jinah, K., Minho, K., Sung-Dae, K., Jong-Seong, K., Joon-Gyu, R., and Jaeil, Kim. (2022). Spatiotemporal neural network with attention mechanism for El Niño forecasts. Sci. Rep. 12 (1), 7204–7215. doi:10.1038/s41598-022-10839-z
Lei, P. (2021). Design and implementation of ROV submarine cable inspection decision support system. IOP Conf. Ser. Earth Environ. Sci. 809, 012003. doi:10.1088/1755-1315/809/1/012003
Li, D., Sun, G., Miao, S., Gu, Y., Zhang, Y., and He, S. (2022). A short-term electric load forecast method based on improved sequence-to-sequence GRU with adaptive temporal dependence. Int. J. Electr. Power & Energy Syst. 137, 107627. doi:10.1016/j.ijepes.2021.107627
Li, L., Chen, K., Gao, J., Liu, J., Gao, Z., and Wang, M. (2021). Multiobjective optimization method and application of tolerance allocation for the steam turbine based on cooperative game theory. Shock Vib. 2021, 1–13. doi:10.1155/2021/9244389
Li, L., Zhang, D., Xie, L., Yu, B., and Lin, F. (2013). Power transformer condition assessment method using association rules comprehensive analysis and variable weight coefficients. Chin. J. Electr. Eng. 24, 152–159. doi:10.13334/j.0258-8013.pcsee.2013.24.019
Lin, J., Ma, J., Zhu, J., and Cui, Y. (2022). Short-term load forecasting based on LSTM networks considering attention mechanism. Int. J. Electr. Power & Energy Syst. 137, 107818. doi:10.1016/j.ijepes.2021.107818
Liu, X., Liu, Y., Liu, J., Xiang, Y., and Yuan, X. (2019). Optimal planning of AC-DC hybrid transmission and distributed energy resource system: Review and prospects. CSEE J. Power Energy Syst. 5 (3), 409–422. doi:10.17775/CSEEJPES.2019.00540
Liu, Y., Xu, Z., Li, G., Xia, Y., and Gao, S. (2019a). A review of the application of artificial intelligence-driven data analysis technology in power transformer condition maintenance. High. Volt. Technol. 45 (2), 337–348. doi:10.13336/j.1003-6520.hve.20190130001
Liu, Y., Zhao, J., Xu, L., Qiu, G., and Liu, J. (2019b). Online TTC estimation using nonparametric analytics considering wind power integration. IEEE Trans. Power Syst. 34 (1), 494–505. doi:10.1109/TPWRS.2018.2867953
Liu, Z., Hao, J., Liao, R., Li, J., Gao, Z., and Liang, Z. (2019). Morphological, structural, and dielectric properties of thermally aged AC 500 kV XLPE submarine cable insulation material and its deterioration condition assessment. IEEE Access 7, 165065–165075. doi:10.1109/ACCESS.2019.2953127
Lv, A., Li, Y., Li, J., and Wu, F. (2014). Strain/temperature monitoring of optical fiber composite submarine cable based on BOTDR. High. Volt. Technol. 2, 533–539. doi:10.13336/j.1003-6520.hve.2014.02.028
Miguel, Á., Bachiller-Soler, A., Cruz-Romero, P., Juan, C., and Rosendo-Macias, J. A. (2021). A thermal model for three-core armored submarine cables based on distributed temperature sensing. Energies 14 (13), 3897. doi:10.3390/en14133897
Nie, Y., Zhao, X., and Li, S. (2020). Research progress on condition monitoring and insulation diagnosis of XLPE cables. High. Volt. Technol. 46 (4), 1361–1371. doi:10.13336/j.1003-6520.hve.20200430028
Niu, D., Yu, M., Sun, L., Gao, T., and Wang, K. (2022). Short-term multi-energy load forecasting for integrated energy systems based on CNN-BiGRU optimized by attention mechanism. Appl. Energy 313, 118801. doi:10.1016/j.apenergy.2022.118801
Pu, T., Qiao, J., Han, X., Zhang, G., and Wang, X. (2020). Research and application of artificial intelligence technology in operation and maintenance of power equipment. High. Volt. Technol. 46 (2), 369–383. doi:10.1088/1755-1315/617/1/012001
Purvins, A., Sereno, L., Ardelean, M., Covrig, C., Efthimiadis, T., and Minnebo, P. (2018). Submarine power cable between europe and north America: A techno-economic analysis. J. Clean. Prod. 186, 131–145. doi:10.1016/j.jclepro.2018.03.095
Song, H., Dai, J., Luo, L., Sheng, G., and Jiang, X. (2018). Power transformer operating state prediction method based on an LSTM network. ENERGIES 11 (4), 914. doi:10.3390/en11040914
Su, T., Liu, Y., Zhao, J., and Liu, J. (2021). Probabilistic stacked denoising autoencoder for power system transient stability prediction with wind farms. IEEE Trans. Power Syst. 36 (4), 3786–3789. doi:10.1109/TPWRS.2020.3043620
Tang, T., and Yuan, H. (2022). A hybrid approach based on decomposition algorithm and neural network for remaining useful life prediction of lithium-ion battery. Reliab. Eng. Syst. Saf. 217, 108082. doi:10.1016/j.ress.2021.108082
Wei, X., Zhu, B., Pang, B., Chen, Q., Wang, S., and Li, R. (2015). Study on on-line jacket insulation monitoring for 500 kV submarine oil-filled cable. Electr. Mach. Control 19 (5), 21–29. doi:10.15938/j.emc.2015.05.004
Xie, Y., Wang, C., and Huang, J. (2022). Structure and evolution of the submarine cable network of Chinese mainland. J. Geogr. Sci. 32 (5), 932–956. doi:10.1007/s11442-022-1979-4
Xu, Y., and Jiang, X. (2022). Short-term power load forecasting based on BiGRU-Attention-SENet model. Energy Sources, Part A Recovery, Util. Environ. Eff. 44 (1), 973–985. doi:10.1080/15567036.2022.2053250
Xu, Z., Hu, Z., Zhao, L., Zhang, Y., Yang, Z., Hu, S., et al. (2019). Application of temperature field modeling in monitoring of optic-electric composite submarine cable with insulation degradation. Measurement 133, 479–494. doi:10.1016/j.measurement.2018.10.028
Yang, W., Pu, C., Yang, K., Zhang, A., and Qu, G. (2022). Transformer short-term fault prediction method based on cnn-gru combined neural network. Power Syst. Prot. control 50 (6), 107–116. doi:10.19783/j.cnki.pspc.210783
Zhang, M., Zhang, X., Mo, J., Xiang, Z., and Zheng, P. (2022). Brake uneven wear of high-speed train intelligent monitoring using an ensemble model based on multi-sensor feature fusion and deep learning. Eng. Fail. Anal. 137, 106219. doi:10.1016/j.engfailanal.2022.106219
Zhou, Z., Liu, X., Wang, S., Zhu, C., Liu, H., and Song, C. (2018). 500kV XLPE submarine cable insulation and jacket transient voltage simulation calculation. High. Volt. Technol. 44 (8), 2725–2731. doi:10.13336/j.1003-6520.hve.20180731032
Keywords: submarine cable, condition prediction, convolution neural network, bidirectional gate recurrent unit, attention mechanism, condition evaluation
Citation: Yang W, Huang B, Zhang A, Li Q, Li J and Xue X (2022) Condition prediction of submarine cable based on CNN-BiGRU integrating attention mechanism. Front. Energy Res. 10:1023822. doi: 10.3389/fenrg.2022.1023822
Received: 20 August 2022; Accepted: 02 September 2022;
Published: 30 September 2022.
Edited by:
Youbo Liu, Sichuan University, ChinaReviewed by:
Xiandong Xu, Tianjin University, ChinaCopyright © 2022 Yang, Huang, Zhang, Li, Li and Xue. This is an open-access article distributed under the terms of the Creative Commons Attribution License (CC BY). The use, distribution or reproduction in other forums is permitted, provided the original author(s) and the copyright owner(s) are credited and that the original publication in this journal is cited, in accordance with accepted academic practice. No use, distribution or reproduction is permitted which does not comply with these terms.
*Correspondence: Wei Yang, eWFuZ3dlaV9zY3VAMTI2LmNvbQ==
Disclaimer: All claims expressed in this article are solely those of the authors and do not necessarily represent those of their affiliated organizations, or those of the publisher, the editors and the reviewers. Any product that may be evaluated in this article or claim that may be made by its manufacturer is not guaranteed or endorsed by the publisher.
Research integrity at Frontiers
Learn more about the work of our research integrity team to safeguard the quality of each article we publish.