- School of Electrical Engineering, Shandong University, Jinan, China
Source-grid-load-storage has represented an interactive characteristic in the active distribution network (ADN). Moreover, power electronic devices have been widely used for source-grid-load-storage with the rapid development of power electronics technology. In this condition, the large-scale distributed source may cause voltage quality degradation, while the application of large-scale power electronics equipment may also lead to serious harmonic distortion. Power quality has become one of the most important issues in the development of ADN. In this paper, the source-grid-load-storage interactive power quality characteristic of the ADN is analyzed. Firstly, considering the source-grid-load-storage interaction in ADN, the voltage deviation and fluctuation are analyzed and the degrees are further quantified. Then, the source-load-storage harmonic models for the power electronic components are built, which is the basis for harmonic analysis. Moreover, the decoupled harmonic power flow algorithm for ADN is proposed to analyze the system harmonic distributions. Finally, considering the location and capacity of photovoltaic and energy storage, the interaction and power quality are analyzed in the IEEE 33-bus distribution system. With the access of energy storage, more than 20% of the voltage deviation and more than 6% of the voltage fluctuation caused by photovoltaics are effectively suppressed, while the harmonic distortion may be further increased.
1 Introduction
With the change of energy structure in the distribution network, the source-grid-load-storage represents an obviously interactive characteristic. Moreover, the interaction is gradually enhanced with the development of flexible load (Hungerford et al., 2019), distributed energy resource (Quadri et al., 2018), and energy storage (ES) technology (Rahman et al., 2020). When the large-scale integration of distributed photovoltaic (PV) generation and energy storage are integrated into the distribution network, the whole distribution system has gradually developed into an active distribution network (ADN) (Davarzani et al., 2021), (Yi et al., 2020), (Bastami et al., 2021), which not only results in voltage over range and fluctuation but also causes the change of system power flow and voltage distribution (Li et al., 2021).
The distribution network usually adopts the radial structure, with power flowing from the power source to the load in a single direction. However, the distributed PV feeds power into the active distribution system, increasing the bus voltage and even changing the power flow direction (Cavana et al., 2021), (Lin et al., 2021). Moreover, affected by the external environment and dispatch demand, the output of distributed energy resources presents time-varying and intermittent characteristics (Sun et al., 2021a), which can lead to bus voltage fluctuations. In this condition, the energy storage technology is developed due to the flexible power regulation ability, and it can provide an effective solution to the bus voltage over limit and fluctuation. Previous researches have done lots of beneficial studies on the coordination of distributed PV, load, and ES. A predictive power control scheme was proposed by (Shan et al., 2019) to control and coordinate the grid-connected PV systems with energy storage systems, which can maintain stable voltage and frequency and improve the power factor. In order to improve the stability of the distribution system, the coordination control strategy for residential load and distributed PV was proposed by (Cheng et al., 2020). Based on the communication framework, the distributed control strategy is developed by (Yu et al., 2021) to optimally coordinate the energy storage and regulate the system voltage.
In addition, with the rapid development of power electronics technology in different aspects of power systems (Xiao et al., 2021), (Sun et al., 2020a), power electronic devices have been widely used for the source-grid-load-storage (Kettner et al., 2021), (Ebrahimzadeh et al., 2019). In the active distribution network, the nonlinear loads represented by user appliances are emerging (Sun et al., 2020b), renewable energy generation represented by photovoltaic is gradually accessed (Gao et al., 2021), and the energy storage also needs the AC/DC conversion with power electronic equipment, which affects the system harmonic condition (Ghofrani et al., 2013). Thus, the AND harmonic distortion issue has attracted worldwide attention (Božiček et al., 2018). Severe harmonic contents will result in various problems in the AND, including power quality reduction, power loss increment, the equipment aging acceleration, etc., which affect the safe and economic operation of the power system (Kwon et al., 2016).
Based on the harmonic generation characteristics, the harmonic power flow can obtain the harmonic distributions in the distribution network (Cristaldi and Ferrero, 1995), (Šošić et al., 2015), which is one of the most effective methods to analyze harmonic distortion (Duan et al., 1996). Also, the interaction of source-grid-load-storage may change the operating state and then affect the harmonic generation (Xie et al., 2020). To date, harmonic power flow analysis mainly contains the time-domain simulation method, unified iterative method, fundamental and harmonic decoupled method, and so on. However, the time-domain simulation method has high computational complexity and cannot reflect the harmonic generation mechanism. The unified iterative method is highly susceptible to convergence difficulties in iterative solving with the Newton-Raphson method. The decoupled method has been widely used due to the easier calculation process and good accuracy (Sun et al., 2007), (Xie and Sun, 2022). The modification procedures to customize the network component models in MATPOWER were presented in (Yang and Adinda, 2021), which can be used for the harmonic power flow study. Based on the field data, a harmonic power flow method was proposed by (Xie et al., 2022), which can evaluate and mitigate the random and time-varying harmonics.
As the installed capacity of distributed PV continues to rise, the operation of the traditional distribution network has changed. In the active distribution network, the power quality problems including voltage over range and serious harmonic distortion are getting worse (Campanhol et al., 2018). With the enhanced source-grid-load-storage interaction, the power quality issues caused by the large-scale distributed PV integration cannot be ignored. Therefore, this paper investigates the generation and influence of power quality problems with source-grid-load-storage interaction. The contributions are summarized as follows.
1 The influence on voltage is analyzed considering source-grid-load-storage interaction, the voltage deviation and fluctuation are analyzed and the degrees are quantified according to the typical structure of the active distribution network.
2 The frequency-domain harmonic models for the key power electronic components in the distribution network are built based on the frequency transfer matrix, which provides the basis for harmonic power flow calculation and analysis.
3 The decoupled harmonic power flow algorithm for the distribution network is proposed to analyze the system harmonic distributions. The interaction of source-grid-load-storage is analyzed based on the proposed harmonic power flow algorithm.
In the following, Section 2 analyzes the influence on voltage deviation and fluctuation with source-grid-load-storage interaction. Section 3 builds the harmonic models for distributed source, electrical load, and energy storage. Section 4 develops the harmonic power flow algorithm based on the harmonic model. Case studies and the results to show the source-grid-load-storage interactive influence are performed in Sections 5, 6 summarizes the conclusions of the paper.
2 Source-grid-load-storage interactive voltage influence analysis
The voltage deviation and fluctuation of the distribution network may be affected by the distributed PV and ES. When these components are connected to the distribution network reasonably, it can improve the distribution grid voltage distribution to a certain extent. However, unreasonable distribution of the source, load, and energy storage will change the system power flow and lead to voltage quality deterioration. To clarify the influence of integration of distributed PV and ES, the interaction of source-grid-load-storage of the distribution network is analyzed in this section.
2.1 Voltage deviation analysis
The structure of the distribution network with one single feeder is shown in Figure 1. In the figure, Bus 1 is the generator node, and the other buses are load nodes. The total number of buses of the distribution network is N, and Un is the voltage of the nth bus. Each load node may be integrated with distributed PV generation and energy storage. pLn and QLn are respectively the active and reactive powers of electrical load connected to the nth bus, PPVn and QPVn are respectively the active and reactive powers of distributed PV generation connected to the nth bus, and PESn and QESn are respectively the active and reactive powers of ES connected to the nth bus. Rn and Xn are respectively the resistance and reactance of the nth branch.
The power flow direction to the bus is set as positive, and that from the bus is set as negative. Generally, both the distributed PV and ES will not generate reactive power. Meanwhile, in order to improve the voltage quality of the distribution network, the energy storage is charged when the output of distributed PV is relatively large.
Considering the single distributed PV and single energy storage are connected to the mth bus, the total apparent power in Bus m is given as follows,
Assuming that the nominal voltage of the distribution network is UNom, the voltage difference between Bus m-1 and Bus m can be derived as follows,
Then, the voltage difference between Bus 1 and Bus m can be obtained as follows,
where Rk + jXk is the equivalent impedance of the kth branch in the distribution network.
Meanwhile, the voltage of Bus m can be calculated as follows,
where U1 is the voltage of the generator node (Bus 1).
When there is no grid-connected PV generation, the voltage gradually decreases from the beginning of the feeder. The integration of distributed PV will increase the node voltage, and the larger the PV generation capacity, the greater the impact on the bus voltage. When the capacity of PV generation is relatively large, the voltage of the grid-connected bus will be larger than the other buses, changing the original monotonicity of the distribution network voltage distribution. The condition of monotonicity change is,
In the case of multiple distributed pVs integration, the monotonicity of the voltage distribution will not be changed when the electrical load power is larger than the grid-connected PV capacity in every bus. In the contrast, the monotonicity of the voltage distribution will change to the increasing trend when the electrical load power is smaller than the grid-connected PV capacity. In this way, active power controlling devices and reactive power compensation devices have been widely employed in the power system (Sun et al., 2021b). Moreover, the integration of ES will improve the voltage quality due to its bidirectional power flow characteristic. In this way, all voltages in each bus can be controlled in the acceptable range by adjusting the charging or discharging power.
From the above equations, it can be seen that the distributed PV generation may cause the voltage over range since the capability of PV generation is generally several times larger than the electrical load consumption. Also, the voltage deviation can be reduced by adjusting the active power of energy storage. Therefore, the voltage quality can be improved with the collaborative control of source-grid-load-storage.
2.2 Voltage fluctuation analysis
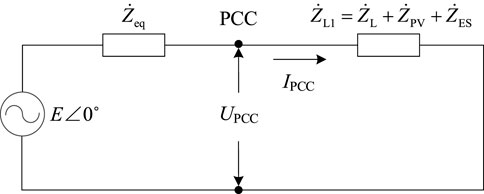
Considering the integration of distributed PV and ES, the Thevenin equivalent circuit of the active distribution network is shown in Figure 2. In this circuit, E∠0˚ represents the power supply voltage and
The voltage at the PCC may fluctuate with the integration of distributed PV generation and energy storage in the distribution network, and the fluctuation can be reflected by the current change ∆IPCC∠θ. According to the consumption characteristics of electrical load and the charging feature of energy storage, the powers of load and storage will not change frequently resulting in voltage fluctuations. However, the voltage may fluctuate due to random and intermittent characteristics of PV output. Consequently, the current change ∆IPCC∠θ can be considered to be caused by PV output fluctuation ∆SPV.
Based on the equivalent circuit, the voltage fluctuation change value ∆UPCC at the PCC can be obtained as follows,
where φ is the equivalent impedance angle of the grid side. UPCC is voltage magnitude at the PCC. Thus, the voltage fluctuation can be represented by the change value ∆UPCC. According to the equation, it can be seen that the degree of voltage fluctuation will be affected by multiple factors, including the PV output variation, the distribution network equivalent impedance, etc.
In these factors, the output variation of grid-connected PV generation has a direct impact on voltage fluctuation. When the weather changes rapidly, the system voltage will fluctuate significantly. Meanwhile, the distribution network equivalent impedance is related to the short-circuit capacity of the system. When distributed PV is integrated into the low-voltage distribution network, voltage fluctuation will be more obvious due to the relatively small short-circuit capacity of the low-voltage distribution network.
3 Source-load-storage harmonic characteristic analysis
3.1 Switching characteristic analysis
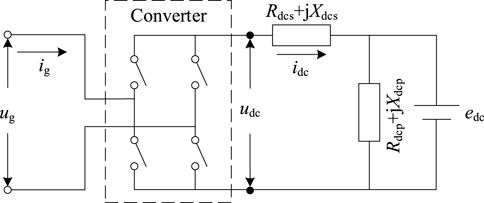
The topology of the commonly used AC/DC converter in distribution systems is shown in Figure 3. The single-phase converter is taken as an example in the paper. In this figure, ug and ig are the supply voltage and current in the grid side, respectively. Udc and idc are the DC voltage and current, respectively. Edc is the DC voltage source. Rdcs + jXdcs and Rdcp + jXdcp are respectively the equivalent DC series load and DC parallel load.
The converter switching behavior can be modeled as a frequency transfer matrix, and the matrix can be derived from the Fourier series coefficients of the switching function that describes the turn-on and turn-off states. Due to the differences in the power electronic converter devices used for source-load storage, there are differences in the form of their switching function expressions.
Distributed PV generally uses insulated gate bipolar transistor (IGBT) based converter devices with pulse width modulation (PWM) control for AC/DC conversion. The electrical loads may adopt different types of converters due to differences in the type of appliances. The diode-based three-phase uncontrolled rectifier circuit is used for AC/DC conversion, and the thyristor-based three-phase bridge rectifier circuit is employed for power regulating. Similar to the electrical load, the AC front-end of the energy storage converter generally uses the diode-based converter or the thyristor-based converter for power charging/discharging.
In the case of the diode-based uncontrolled converter, the switching function is described as,
where h is the harmonic order. ω is the angular frequency of the fundamental wave.
Different from the uncontrolled converter, the thyristor-based converter needs to consider the controlled switching angle, which is measured with respect to the peak of DC voltage. The switching function for the thyristor-controlled converter is described as,
In the case of the PWM-controlled converter, the switching function is described based on the Bessel function J (). The switching function is related to the modulation degree M, and the specific expression is as follows,
where ωC is the angular frequency of the modulator wave.
According to the switching functions, the diode-based converter and the thyristor-based converter may generate low-frequency harmonic contents. While the IGBT-based converter mainly generates the high-frequency harmonic contents, since the modulator frequency is relatively high. As a result, the harmonic models of different types of converters including DER, electrical load, and energy storage can be established respectively. Also, the converter model can clarify the coupling relationship between the harmonic voltage and harmonic current in the AC side.
3.2 Frequency-domain harmonic modeling
According to the modulation theory (Esparza et al., 2019), the current and voltage waveforms can also be represented by the current and voltage switching functions with the sine/cosine function. The DC voltage can be obtained by modulating the AC voltage through the turn-on and turn-off of the power electronic device, and the AC current can be obtained by modulating the DC current through the turn-on and turn-off of the power electronic device. The voltage and current relationship between the AC and DC sides can be expressed as,
where S(t) is the time-varying switching function. ug(t) is the time-varying grid voltage, and ig(t) is the time-varying grid current. Ideally, the voltage switching function and the current switching function are the same. Since any stable periodic signal can be expressed as the Fourier series form (Sun et al., 2022), (Sun et al., 2021c), the time-domain variables can be transformed into the frequency-domain form as follows,
where h is the harmonic order, and H is the considered highest harmonic order. Ugh and φgh represent the magnitude and phase angle of the hth harmonic voltage in the grid side. Idc is the DC current. Idch and φdch denote the magnitude and phase angle of the hth harmonic current in the DC side.
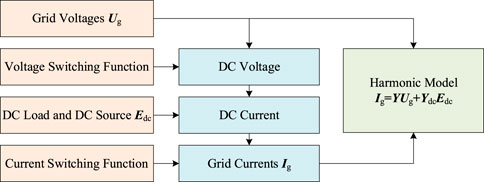
On this basis, the frequency-domain harmonic model of the converter can be established, and the derivation process of this model is provided in Figure 4. In this model, Y is the harmonic admittance matrix characterizing the relationship between voltage and current in the AC side, and Ydc is the harmonic admittance matrix representing the relationship between DC voltage and AC current.
According to the established harmonic model, it can be seen that the elements of the harmonic admittance matrix are independent of the harmonic components in the supply voltage, which can be used as the basic model for harmonic power flow calculation and accuracy improvement of harmonic analysis.
4 Source-grid-load-storage collaborative harmonic power flow
The decoupled method contains the calculation of the fundamental state and the calculation of the harmonic state. The input and output of the fundamental power flow equation are the fundamental nodal power and fundamental voltage or line flow, respectively.
4.1 Fundamental power flow analysis
The fundamental power flow of the whole distribution network can be calculated based on the Newton-Raphson method. For the Bus i in the distribution network, the fundamental power flow is based on the power differences ΔPi and ΔQi,
where Pi and Qi are the active and reactive powers of bus i, respectively. Ui and Uj are the magnitudes of voltages of Buses i and j. Gij and Bij are the conductance and susceptance of the branch between Buses i and j, respectively. θij is the phase difference of voltage between Buses i and j.
Based on the active power difference ΔP and reactive power difference ΔQ, the modified equation of Newton- Raphson method is as follows,
where U and θ are respectively the phase angle and magnitude of the voltage. Then, the value of Ui, Uj and θij can be revised based on the phase angle difference Δθ and ΔU. The above process needs to be iterated until one of the conditions in Eqs. (16), (17) is met.
where ε1 and ε2 are thresholds for iteration termination. On this basis, the fundamental power flow can be calculated for the distribution network.
4.2 Harmonic power flow analysis
Considering the harmonic voltage is far less than the fundamental voltage in a real system, the calculation of fundamental and harmonic power flows can be considered independent of each other. Thus, the decoupled harmonic power flow is employed in the paper.
From the source-load-storage harmonic analysis, all types of components in the active distribution network may generate harmonics. Thus, there may be more than one harmonic source existing at the same time, which are distributed in different buses of the power system. The harmonic model of the source-load-storage can be represented as follows,
where Ih and Uh are the hth harmonic current and voltage, respectively. Ish represents the hth harmonic of the current source. Yh,h denotes the admittance between hth harmonic voltage and hth harmonic current. Considering the self-coupling admittance is larger than the mutual-coupling admittance, the harmonic model can only consider the interaction between the harmonic voltage and current in the same order. Consequently, the hth harmonic in the source-load-storage harmonic model in the nth bus of the distribution network can be written as,
Then, the harmonic model of the whole distribution network can be expressed as,
where Ih and Uh are the matrices consisting of hth harmonic currents and voltages in each bus, respectively. Ish is the matrix consisting of hth harmonic of the current source in each bus. Yh is the matrix consisting of hth harmonic self-coupling admittance in each bus. Moreover, considering the structure of the distribution network, the matrix Ih can also be represented by,
where YBh denotes the node admittance matrix of the distribution network, which can be solved according to the system topology and branch admittances. Then, based on the Eqs. (20), (21), the matrix Uh consisting of hth harmonic voltages in each bus can be derived as,
According to the hth harmonic voltage, the corresponding harmonic current can also be obtained. Therefore, the harmonic power flow can be calculated from the above analysis.
5 Case study
5.1 Source-grid-load-storage interactive voltage characteristic
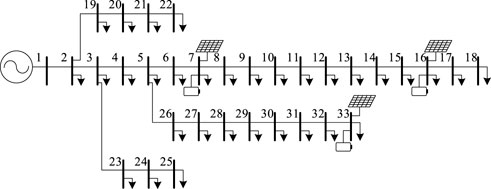
To verify the influence of location and capacity on the network voltage, the impact of distributed PV generation and energy storage are analyzed. The IEEE 33-bus distribution network proposed by (Baran and Wu, 1989) is employed to analyze the influence, and its structure is shown in Figure 5. In the IEEE 33-bus system, Bus 1 is the slack bus and the other buses are PQ nodes. Bus 7, Bus 16, and Bus 33 are selected as the PV and ES access locations.
To quantitative the voltage deviation, the definition of voltage deviation ΔU is shown as follows,
where U is the voltage amplitude of system bus.
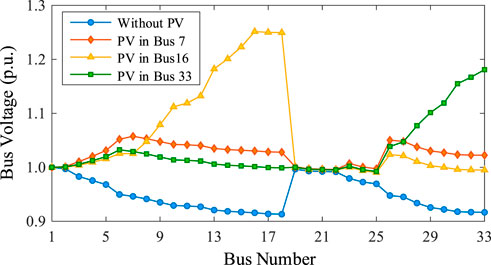
When the capability of distributed PV is 0.8 MW and there is no ES integration, the voltage distribution conditions under different PV access location is shown in Figure 6.
From the above figure, it can be seen that the integration of PV results in voltage improvement. When different buses are connected to the same photovoltaic capacity, the voltage variation trends of each bus are different. Therefore, the voltage sensitivity of each bus is different since the equivalent impedances are different in the grid side.
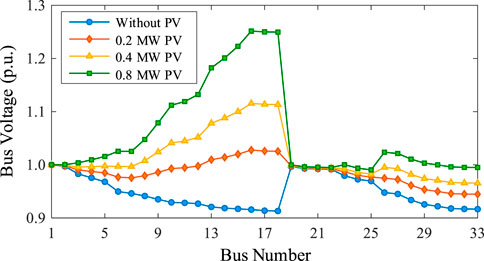
Then, the influence of distributed PV is analyzed. The comparisons of the voltage distributions without and with 0.2 MW, 0.4 MW, and 0.8 MW photovoltaic capacity integration in Bus 16 are shown in Figure 7. According to the results, the increase of distributed PV capacity has an obvious influence on the voltage, especially for the accessed location. Also, the voltage deviation may be over the limit that cannot be accepted when the PV capacity is relatively large.
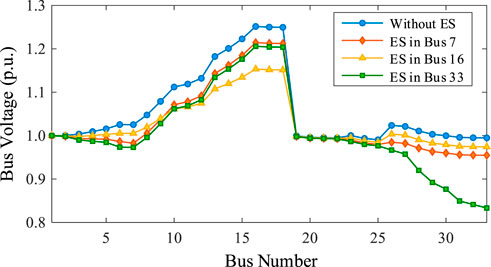
In order to analyze the influence of energy storage, the voltage distributions are calculated with different ES access locations under the condition of 0.8 MW distributed PV integration in Bus 16. Similar to the PV locations, the energy storage is connected to Bus 7, Bus 16 and Bus 33, respectively. Assuming that the ES capability is 0.3 MW, the comparisons of the voltage distributions are shown in Figure 8.
From the results in Figure 8, the voltage magnitude can be mitigated with the energy storage integration. The voltage suppression is most effective when the distributed PV and ES are connected to the same bus. Therefore, the energy storage can be connected to the node where the voltage rise is most pronounced to realize the power regulation effectively.
5.2 Source-grid-load-storage interactive dynamic characteristic
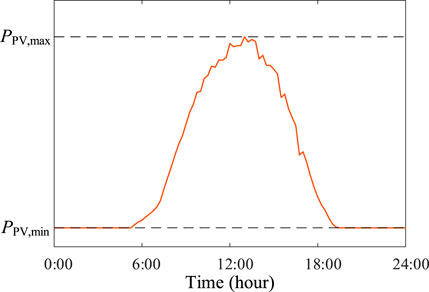
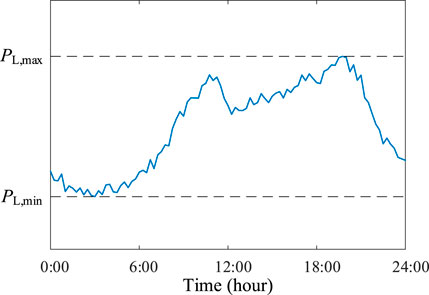
In order to analyze the source-grid-load-storage dynamic characteristic, the field-measured distributed photovoltaic and electrical load powers are employed, which are recorded every 15 min. The measured distributed PV data of the typical day is shown in Figure 9, and the typically measured load data is shown in Figure 10. In these figures, PPV,max and PL,max represent the maximum photovoltaic and load powers, respectively. PPV,min and PL,min are respectively the minimum photovoltaic and load powers, and the value of PPV,min is 0.
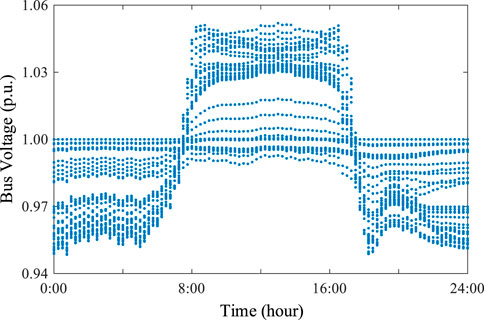
In the distribution network, the distributed PV generators with the maximum capability of 0.4 MW are connected to Bus 7, Bus 16 and Bus 33, and the PV output employs the power curve shown in Figure 9. The electrical load varies from 50% to 120%, which adopts the load power consumption curve in Figure 10. The voltage dynamic trend of each bus in the whole day can be obtained as shown in Figure 11. It can be seen that the system bus voltage exceeded the limit seriously at the time around 13:00, even up to about 1.2 p.u., due to the peak photovoltaic output. However, since the load consumption is relatively large, the bus voltage drops, and the voltage deviation increases significantly after 18:00.
The energy storage is then employed in the distribution system to suppress the voltage, the location is the same as the distribution network. The maximum energy storage power PES,max is set to 0.3 MW, and the minimum energy storage power PPV,min is 0. The ES control object is to retain the connected bus voltage within the range of 0.95 p.u. and 1.05 p.u. With the energy storage integration, the voltage dynamic trend of each bus in one day is shown in Figure 12.
From the results shown in Figure 12, it can be seen that the employment of energy storage suppresses the bus voltage in the period of large photovoltaic output. Also, the energy storage improves the voltage quality of the system in the case of heavy load. However, the voltage still maybe exceeds the control objective due to the limited capability of energy storage. Therefore, the optimization of energy storage capability also needs to be considered under source-grid-load-storage interaction.
Furthermore, the voltage fluctuations of each bus with energy storage integration are calculated as shown in Figure 13, and the voltage fluctuation is defined as follows,
where ΔUd is the voltage difference between two RMS values. From Figure 13, it can be seen that the voltage fluctuations are generally less than 2.5%, which verifies the effectiveness of energy storage to improve voltage quality.
5.3 Source-grid-load-storage interactive harmonic characteristic
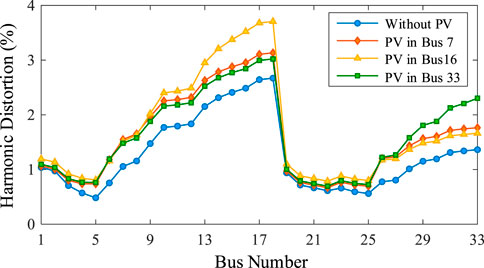
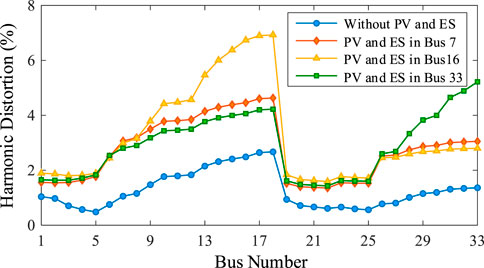
To analyze harmonic characteristics with source-grid-load-storage interaction, the 5th harmonic is taken as the example in this section. Distributed PV generator with the capability of 0.4 MW is connected to Bus 7, Bus 16 and Bus 33, respectively. Meanwhile, the energy storage with the capability of 0.3 MW is also connected to Bus 7, Bus 16 and Bus 33, respectively. In the distribution network, 60% of load capability in each bus is set as the nonlinear rectifier-based load.
According to the converter operating characteristic, the current of the 5th harmonic source is set to 22.93% of the fundamental current for the energy storage and electrical load, and the current of the 5th harmonic source is set to 0.37% for the distributed pV. The comparisons of harmonic voltage contents in each bus with and without energy storage are shown in Figures 14, 15, respectively. For quantitative analysis of the harmonic voltage, the harmonic distortion of hth harmonic voltage HDh is defined as follows,
where Uh is the amplitude of hth harmonic voltage, and U1 is the amplitude of the fundamental voltage.
As shown in these figures, it can be seen that the access locations of distributed PV and ES will affect the harmonic distributions. According to the comparison, although energy storage integration can improve the voltage quality of the distribution network, it will result in the harmonic content increasing with the source-grid-load-storage interaction. Therefore, the employment of energy storage needs to be fully considered for all kinds of power quality issues.
6 Conclusion
In terms of source-grid-load-storage interaction, the resulting voltage over limit and fluctuation issue is analyzed, and the harmonic distortion is calculated based on the proposed harmonic model. The following conclusions can be drawn as follows.
1 The influence on voltage is analyzed with source-grid-load-storage interaction, and the voltage deviation and fluctuation are qualified according to the typical structure of the active distribution network. The results show the effectiveness of energy storage on voltage suppression.
2 The frequency-domain harmonic models for key power electronics components are built based on the frequency transfer matrix, which provides the basis for harmonic power flow calculation and analysis in the active distribution network.
3 The interaction of source-grid-load-storage is analyzed based on the proposed harmonic power flow algorithm. With the integration of energy storage, the result shows that more than 20% of the voltage deviation and more than 6% of the voltage fluctuation are suppressed, while the harmonic distortion may be further increased.
Future research will focus on considering the source-load-storage uncertainties in the active distribution network. Moreover, the control strategy of distributed photovoltaic generation and energy storage is also an interesting topic with the interaction of source-grid-load-storage. With these topics, future research directions mainly include the operating state forecasting and probabilistic harmonic power flow calculation for the active distribution network (Le Nguyen, 1997).
Data availability statement
The original contributions presented in the study are included in the article/supplementary material, further inquiries can be directed to the corresponding authors.
Author contributions
YL: conceptualization, methodology, formal analysis, software, validation, and writing—review and editing. JL: conceptualization, writing—review and editing, and supervision. KS: methodology, validation, investigation, and data curation. KL: writing—review and editing, and supervision.
Conflict of interest
The authors declare that the research was conducted in the absence of any commercial or financial relationships that could be construed as a potential conflict of interest.
Publisher’s note
All claims expressed in this article are solely those of the authors and do not necessarily represent those of their affiliated organizations, or those of the publisher, the editors and the reviewers. Any product that may be evaluated in this article, or claim that may be made by its manufacturer, is not guaranteed or endorsed by the publisher.
References
Baran, M. E., and Wu, F. F. (1989). Network reconfiguration in distribution systems for loss reduction and load balancing. IEEE Trans. Power Deliv. 4 (2), 1401–1407. doi:10.1109/61.25627
Bastami, H., Shakarami, M. R., and Doostizadeh, M. (2021). A decentralized cooperative framework for multi-area active distribution network in presence of inter-area soft open points. Appl. Energy 300. doi:10.1016/j.apenergy.2021.117416doi:117416
Božiček, A., Kilter, J., Sarnet, T., Papič, I., and Blažič, B. (2018). Harmonic emissions of power electronic devices under different transmission network operating conditions. IEEE Trans. Ind. Appl. 54 (5), 5216–5226. doi:10.1109/TIA.2018.2808478
Campanhol, L. B. G., Da Silva, S. A. O., De Oliveira, A. A., and Bacon, V. D. (2018). Power flow and stability analyses of a multifunctional distributed generation system integrating a photovoltaic system with unified power quality conditioner. IEEE Trans. Power Electron. 34 (7), 6241–6256. doi:10.1109/TPEL.2018.2873503
Cavana, M., Mazza, A., Chicco, G., and Leone, P. (2021). Electrical and gas networks coupling through hydrogen blending under increasing distributed photovoltaic generation. Appl. Energy 290. doi:10.1016/j.apenergy.2021.116764doi:116764
Cheng, Z., Li, Z., Liang, J., Si, J., and Gao, J. (2020). Distributed coordination control strategy for multiple residential solar PV systems in distribution networks. Int. J. Electr. Power & Energy Syst. 117. doi:10.1016/j.ijepes.2019.105660doi:105660
Cristaldi, L., and Ferrero, A. (1995). Harmonic power flow analysis for the measurement of the electric power quality. IEEE Trans. Instrum. Meas. 44 (3), 683–685. doi:10.1109/19.387308
Davarzani, S., Pisica, I., Taylor, G. A., and Munisami, K. J. (2021). Residential demand response strategies and applications in active distribution network management. Renew. Sustain. Energy Rev. 138. doi:10.1016/j.rser.2020.110567doi:110567
Duan, B., Zhang, C., Sun, T., Zhang, G., and Guo, M. (1996). Modeling and simulation of the propagation of harmonics in electric power networks. I: Concepts, models, and simulation techniques. IEEE Trans. Power Del. 11 (1), 452–460. doi:10.1109/61.484130
Ebrahimzadeh, E., Blaabjerg, F., Wang, X., and Bak, C. L. (2019). Optimum design of power converter current controllers in large-scale power electronics based power systems. IEEE Trans. Ind. Appl. 55 (3), 2792–2799. doi:10.1109/TIA.2018.2886190
Esparza, M., Segundo, J., Gurrola-Corral, C., Visairo-Cruz, N., Bárcenas, E., and Barocio, E. (2019). Parameter estimation of a grid-connected VSC using the extended harmonic domain. IEEE Trans. Ind. Electron. 66 (8), 6044–6054. doi:10.1109/TIE.2018.2870404
Gao, B., Wang, Y., and Xu, W. (2021). Modeling voltage source converters for harmonic power flow studies. IEEE Trans. Power Deliv. 36 (6), 3426–3437. doi:10.1109/TPWRD.2020.3041844
Ghofrani, M., Arabali, A., Etezadi-Amoli, M., and Fadali, M. S. (2013). Energy storage application for performance enhancement of wind integration. IEEE Trans. Power Syst. 28 (4), 4803–4811. doi:10.1109/TPWRS.2013.2274076
Hungerford, Z., Bruce, A., and Macgill, L. (2019). The value of flexible load in power systems with high renewable energy penetration. Energy 188. doi:10.1016/j.energy.2019.115960doi:115960
Kettner, A. M., Reyes-Chamorro, L., Becker, J. K. M., Zou, Z., Liserre, M., and Paolone, M. (2021). Harmonic power-flow study of polyphase grids with converter-interfaced distributed energy resources—Part I: Modeling framework and algorithm. IEEE Trans. Smart Grid 13 (1), 458–469. doi:10.1109/TSG.2021.3120108
Kwon, J. B., Wang, X., Blaabjerg, F., Bak, C. L., Wood, A. R., and Watson, N. R. (2016). Harmonic instability analysis of a single-phase grid-connected converter using a harmonic state-space modeling method. IEEE Trans. Ind. Appl. 52 (5), 4188–4200. doi:10.1109/TIA.2016.2581154
Le Nguyen, H. (1997). Newton-Raphson method in complex form [power system load flow analysis]. IEEE Trans. Power Syst. 12 (3), 1355–1359. doi:10.1109/59.630481
Li, Y., Sun, Y., Li, K., Zhuang, J., Liang, Y., and Pang, Y. (2021). Analysis and suppression of voltage violation and fluctuation with distributed photovoltaic integration. Symmetry 13 (10), 1894. doi:10.3390/sym13101894
Lin, Q., Liu, L.-J., Yuan, M., Ge, L.-J., and Zhang, M. (2021). Choice of the distributed photovoltaic power generation operating mode for a manufacturing enterprise: Surrounding users vs a power grid. J. Clean. Prod. 293. doi:10.1016/j.jclepro.2021.126199doi:126199
Quadri, I. A., Bhowmick, S., and Joshi, D. (2018). A comprehensive technique for optimal allocation of distributed energy resources in radial distribution systems. Appl. Energy 211, 1245–1260. doi:10.1016/j.apenergy.2017.11.108
Rahman, M. M., Oni, A. O., Gemechu, E., and Kumar, A. (2020). Assessment of energy storage technologies: A review. Energy Convers. Manag. 223. doi:10.1016/j.enconman.2020.113295doi:113295
Shan, Y., Hu, J., and Guerrero, J. M. (2019). A model predictive power control method for PV and energy storage systems with voltage support capability. IEEE Trans. Smart Grid 11 (2), 1018–1029. doi:10.1109/TSG.2019.2929751
Šošić, D., Žarković, M., and Dobrić, G. (2015). Fuzzy‐based Monte Carlo simulation for harmonic load flow in distribution networks. IET Gener. Transm. &. Distrib. 9 (3), 267–275. doi:10.1049/iet-gtd.2014.0138
Sun, K., Li, K. J., Zhang, Z., Liang, Y., Liu, Z., and Lee, W. J. (2021). An integration scheme of renewable energies, hydrogen plant, and logistics center in the suburban power grid. IEEE Trans. Ind. Appl. 58 (2), 2771–2779. doi:10.1109/TIA.2021.3111842
Sun, K., Qiu, W., Dong, Y., Zhang, C., Yin, H., Yao, W., et al. (2022). WAMS-based HVDC damping control for cyber attack defense. IEEE Trans. Power Syst. 1. doi:10.1109/TPWRS.2022.3168078
Sun, K., Qiu, W., Yao, W., You, S., Yin, H., and Liu, Y. (2021). Frequency injection based HVDC attack-defense control via squeeze-excitation double CNN. IEEE Trans. Power Syst. 36 (6), 5305–5316. doi:10.1109/TPWRS.2021.3078770
Sun, K., Xiao, H., Pan, J., and Liu, Y. (2020). A station-hybrid HVDC system structure and control strategies for cross-seam power transmission. IEEE Trans. Power Syst. 36 (1), 379–388. doi:10.1109/TPWRS.2020.3002430
Sun, K., Xiao, H., Pan, J., and Liu, Y. (2021). VSC-HVDC interties for urban power grid enhancement. IEEE Trans. Power Syst. 36 (5), 4745–4753. doi:10.1109/TPWRS.2021.3067199
Sun, Y., Xie, X., Zhang, L., and Li, S. (2020). A voltage adaptive dynamic harmonic model of nonlinear home appliances. IEEE Trans. Ind. Electron. 67 (5), 3607–3617. doi:10.1109/TIE.2019.2921261
Sun, Y., Zhang, G., Xu, W., and Mayordomo, J. G. (2007). A harmonically coupled admittance matrix model for AC/DC converters. IEEE Trans. Power Syst. 22 (4), 1574–1582. doi:10.1109/TPWRS.2007.907514
Xiao, H., Sun, K., Pan, J., Li, Y., and Liu, Y. (2021). Review of hybrid HVDC systems combining line communicated converter and voltage source converter. Int. J. Electr. Power & Energy Syst. 129. doi:10.1016/j.ijepes.2020.106713doi:106713
Xie, X., Peng, F., and Zhang, Y. (2022). A data-driven probabilistic harmonic power flow approach in power distribution systems with PV generations. Appl. Energy 321. doi:10.1016/j.apenergy.2022.119331doi:119331
Xie, X., and Sun, Y. (2022). A piecewise probabilistic harmonic power flow approach in unbalanced residential distribution systems. Int. J. Electr. Power & Energy Syst. 141. doi:10.1016/j.ijepes.2022.108114doi:108114
Xie, X., Sun, Y., Wang, Q., Li, Y., Zhang, Y., and Zhang, L. (2020). A piecewise probabilistic harmonic model of aggregate residential loads. IEEE Trans. Power Deliv. 36 (2), 841–852. doi:10.1109/TPWRD.2020.2995081
Yang, N.-C., and Adinda, E. W. (2021). Matpower-based harmonic power flow analysis for power systems with passive power filters. IEEE Access 9, 167322–167331. doi:10.1109/ACCESS.2021.3135496
Yi, Z., Xu, Y., Zhou, J., Wu, W., and Sun, H. (2020). Bi-level programming for optimal operation of an active distribution network with multiple virtual power plants. IEEE Trans. Sustain. Energy 11 (4), 2855–2869. doi:10.1109/TSTE.2020.2980317
Keywords: distribution network, power quality, distributed energy resouce, energy storage, voltage analysis, harmonic modeling
Citation: Li Y, Lou J, Sun K and Li K-J (2022) Source-grid-load-storage interactive power quality characteristic of active distribution network. Front. Energy Res. 10:1023474. doi: 10.3389/fenrg.2022.1023474
Received: 19 August 2022; Accepted: 06 September 2022;
Published: 21 September 2022.
Edited by:
Siqi Bu, Hong Kong Polytechnic University, Hong Kong, SAR ChinaReviewed by:
Xiangmin Xie, Qingdao University, ChinaYuqing Dong, The University of Tennessee, Knoxville, United States
Haitao HU, Southwest Jiaotong University, China
Copyright © 2022 Li, Lou, Sun and Li. This is an open-access article distributed under the terms of the Creative Commons Attribution License (CC BY). The use, distribution or reproduction in other forums is permitted, provided the original author(s) and the copyright owner(s) are credited and that the original publication in this journal is cited, in accordance with accepted academic practice. No use, distribution or reproduction is permitted which does not comply with these terms.
*Correspondence: Jie Lou, bG91amllMDBAc2R1LmVkdS5jbg==
 Yahui Li
 Jie Lou*
 Kaiqi Sun
 Ke-Jun Li
