 Hao Kang
 Guanghui Li2
95% of researchers rate our articles as excellent or good
Learn more about the work of our research integrity team to safeguard the quality of each article we publish.
Find out more
OPINION article
Front. Energy Res. , 06 January 2023
Sec. Carbon Capture, Utilization and Storage
Volume 10 - 2022 | https://doi.org/10.3389/fenrg.2022.1023099
This article is part of the Research Topic CO2 Geological Storage and Utilization (CGSU) View all 6 articles
In the 21st century, the focus of global oil and gas development has shifted from conventional reservoirs to unconventional reservoirs. As one of the unconventional oil and gas resources, tight oil has a good development prospect. Xu et al. (2019a) established gas apparent permeability model based on flow regime in tight sandstone reservoirs by combination of molecular kinetics, gas transport mechanisms, and apparent permeability. Their study provides a quick evaluation of gas apparent permeability based on Knudsen number and pore diameter which is greatly helpful for reservoir evaluation. By analyzing the sedimentary environment and reservoir-forming conditions of the Carboniferous-Permian in North China, Kang pointed out that the Carboniferous-Permian in North China is one of the important strata for improving oil and gas reserves and production in China’s current and future tight oil and gas fields (Kang, 2020). Through molecular simulation and physical experiment, Xu et al. (2017) investigated the free gas transport in shale rocks by using the equation of state (EOS) and elastic hard-sphere (HS) model. Excellent results were obtained concerning the mechanism underlying the transport of gas in shale rock nanopores. Liao et al. (2011) discussed the petroleum exploration prospects of the tight reservoirs in the Sichuan Basin from the perspective of correlation with the Bakken Formation in the Williston Basin of the United States. The study shows that the Jurassic in central Sichuan is a typical continuous oil accumulation, and puts forward an effective way to open up a new situation of oil exploration and development in the Jurassic tight reservoirs in central Sichuan. Wang et al. (2019) considered that Dujiatai oil reservoir in the fourth member of Shahejie Formation in Leijia area is a favorable exploration area for tight-shale oil through comprehensive analysis of source-reservoir combination based on the analysis results of cast thin section and scanning electron microscope, and put forward the overall development strategy for tight-shale oil. Xu et al. (2019b) raised an better approach to study gas transport in shale rocks by combining nanoscale pore size distribution (PSD) and gas filed production. Findings of this study are validated by field test and are helpful to better understand the relation between a nanoscale PSD and field gas production.
At the same time, there are also some problems to be solved urgently in the process of tight oil development. Fang et al. (2020) systematically summarized the geological research progress of tight oil reservoir formation, and put forward five important scientific issues in the current tight oil reservoir formation research. The solution of these problems will be an important supplement to the study of tight oil geology. Cao et al. (2019) believe that reservoir study is the core and key to realize efficient exploration and development of tight oil. Based on the previous research results, taking the typical tight oil and gas reservoir as an example, through the systematic study of sedimentary diagenetic integrated facies, combined with the control factors of reservoir effectiveness, the quantitative evaluation and classification method of tight oil and gas is formed by using grey correlation analysis. Wang summarized the difficulties of tight oil study and the research conclusions at home and abroad. Three key scientific issues that should be paid attention to in the future are pointed out (Wang, 2013). In the process of solving these problems, many solutions are based on the test and evaluation of reservoir permeability. In fact, many scholars have done a lot of research on the evaluation of tight oil formation. Gu et al. (2017) took the samples of Chang 8 tight sandstone reservoir in Ordos Basin as an example, revealed the microscopic influence mechanism of tight reservoir permeability on oil recovery efficiency through imbibition simulation experiment, combined with nuclear magnetic resonance and CT scanning analysis. Yan et al. (2021) established a mathematical model for predicting permeability of tight oil reservoir after fracturing based on the principle of pressure drop test and fracturing operation curve. The calculation model can save the cost of well testing operation and is practical in the actual field. The calculation results provide a reference for fracturing effect evaluation and productivity prediction of tight oil reservoirs after fracturing.
In this study, the AutoPore IV 9,500 mercury porosimeter of Micromeritics Company was used to test the core of a tight oil reservoir in Changqing oilfield in Northwest China. The formation buried depth of the core is about 1.658 m, and the porosity of the core is 8% and the permeability is 0.873 × 10⁻³μm2 according to the conventional porosity and permeability test. This paper first introduces how to obtain the pore distribution from the original data obtained in the testing process, and then introduces the method of converting the pore distribution into the permeability distribution. The distribution data results are then analyzed thoroughly, and the permeability characteristics of the reservoir are finally obtained effectively.
Start the AutoPore IV 9,500 to begin the test, and following the instructions of operation manual. First of all, the injection volume under different injection pressures can be obtained, as shown in Table 1, which is also the basic data of this study. The mercury injection pressure in the table is in the unit of MPa, which is converted from the unit of psi, and the actual output unit of the mercury porosimeter is psi.
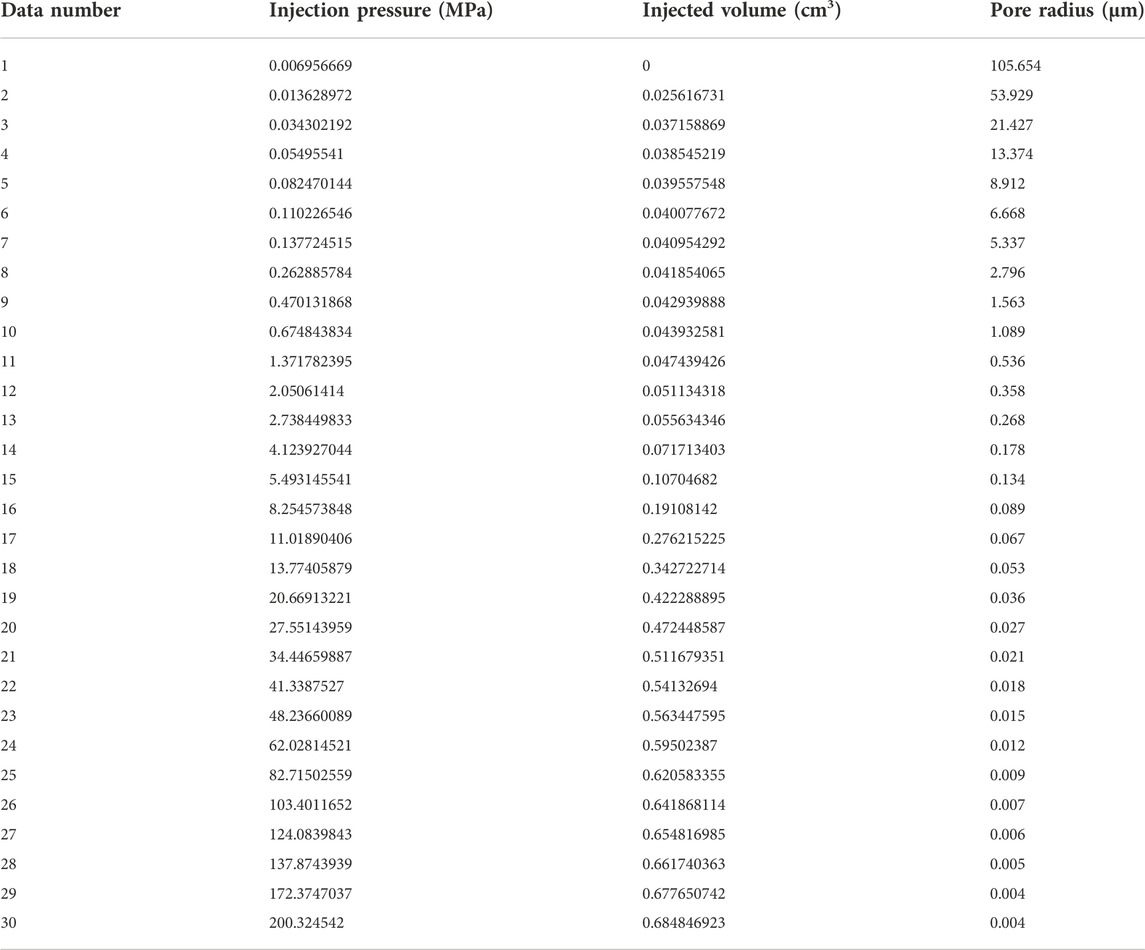
TABLE 1. Normalized pore size distribution obtained from mercury intrusion experiment.
Considering that the mercury injection process is a dynamic equilibrium process, the injection pressure is approximately equal to the capillary pressure, the corresponding capillary radius is the pore radius, and the volume of mercury entering the pore is the pore volume connected by the radius. The capillary pressure curve can be obtained by continuously changing the mercury injection pressure, and the calculation formula is:
where
The injection pressure can be converted to the pore radius by Eq. 1. Combined with the conventional test results, the injection volume can be converted into the mercury injection saturation. Furthermore, the relationship curve between pore radius and mercury injection saturation can be obtained by fitting the data points of pore radius and mercury injection saturation. In order to describe the pore radius uniformly, further data processing is generally carried out from the data points at a fixed radius on the curve. The frequency occupied by the corresponding pore radius distribution can be determined by the difference between the corresponding mercury injection saturation and the previous mercury injection saturation.
Numerous attempts have been made to relate the permeability K to more readily measurable properties, such as porosity and pore diameters. By combining Darcy’s and Poiseuille’s laws (Lowell and Shields, 1991), one approach models the flow of fluids across straight cylindrical channels and obtains that:
where
Therefore, the permeability contribution rate can be obtained by using the above relationship in combination with the pore distribution frequency.
The pore radius distribution and permeability contribution of the tight oil reservoir core are obtained through the above test and calculation process. In order to clearly characterize the core characteristics of the tight oil reservoir, the test calculation results are plotted on a same graph, as shown in Figure 1.
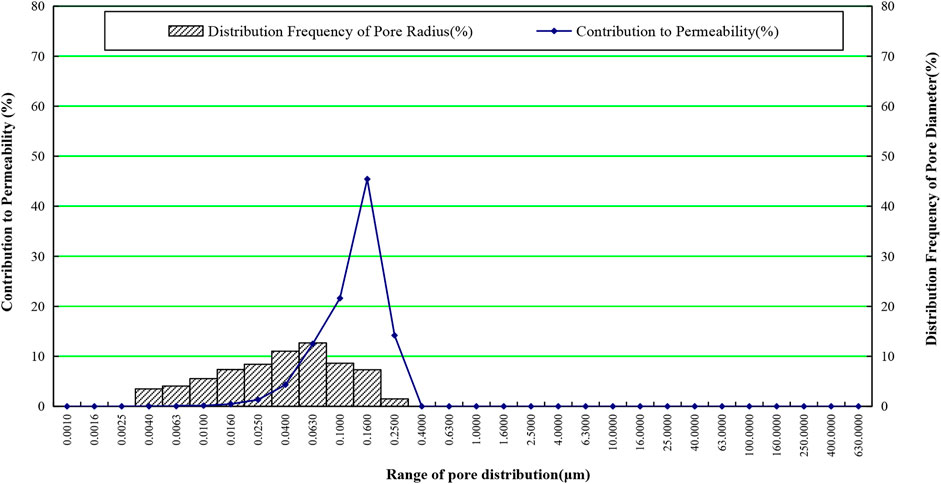
FIGURE 1. Pore diameter distribution and contribution to permeability.
It can be seen from the figure that the pore radius of the tight oil core is distributed between 0.0040 μm and 0.2500 μm, and the maximum pore diameter is only 0.2500 μm. From the aspect of pore size distribution frequency, the pore radius is roughly distributed in 10 intervals, basically in normal distribution, and the cumulative mercury saturation is 69.979%. According to the descending order of the distribution frequency, the maximum distribution frequency is 12.688%, and the corresponding pore radius is 0.0630 μm. The second is the pore with a radius of 0.0400 μm, with a distribution frequency of 11.012%.
In terms of permeability contribution, the contribution rate of different pore size ranges is roughly distributed in 10 intervals, ranging from 0.014% to 45.42%, and the maximum contribution rate can reach 45.42%. In terms of the contribution rate, except for the pores with a radius of 0.2500 μm, the contribution rate of permeability is basically positively correlated with the pore radius. For pores of radii not greater than 0.1600 μm, the contribution rate of permeability decreases with the decrease of pore radius. The distribution frequency of the pores with a radius of 0.2500 μm is only 1.495%, so its permeability contribution rate is not the largest, only 14.18%. The pore radii whose contribution rate to permeability is more than 1% are distributed from 0.0250 μm to 0.2500 μm, and their total contribution rate to permeability reaches 99.35%. The pore radius with the largest contribution rate to the permeability is concentrated between 0.0630 μm and 0.1600 μm, and the total contribution rate to the permeability reaches 79.53%. The permeability contribution rate of pores with radius of 0.1600 μm is 45.42%, reaching the maximum contribution rate. In general, the distribution of permeability contribution rate is not normal.
Moreover, the permeability contribution rate is not completely consistent with the pore radius distribution. In general, the pore radius with the largest permeability contribution rate also belongs to the range with higher distribution frequency, ranging from 7.314% to 12.688%. However, the pore with radius of 0.1600 μm has the largest contribution rate of permeability, and its distribution frequency is only 7.314%. The maximum distribution frequency of pore radius is 12.688%, corresponding to a pore radius of 0.0630 μm. Correspondingly, the pore with a radius of 0.0630 μm has a permeability contribution rate of 12.493%, which also does not provide the maximum permeability contribution rate. Therefore, although there is a certain correlation between the distribution of pore radius and the contribution rate of permeability, it is not completely consistent.
In this study, AutoPore IV 9,500 mercury porosimeter was used to test the core of a tight oil reservoir in Changqing Oilfield. Firstly, the data processing method is introduced, and the pore radius distribution and permeability contribution of the tight oil reservoir core are obtained by combining with the instrument test data. The pore radii of the tight oil cores are distributed in the range of 0.0040 μm–0.2500 μm, which is basically in normal distribution, and the cumulative mercury injection saturation is 69.979%. The maximum distribution frequency is 12.688%, and the corresponding pore radius is 0.0630 μm. In terms of permeability contribution, the permeability contribution rate is basically positively correlated with the pore radius. The permeability contribution rate decreases with the decrease of pore radius, and the distribution of permeability contribution rate is not normal. The pore radius with larger contribution rate to permeability is concentrated between 0.0630 μm and 0.1600 μm, and their total contribution rate to permeability reaches 79.53%. Among them, the permeability contribution rate of pores with radius of 0.1600 μm is 45.42%, reaching the maximum contribution rate. Moreover, there is a certain correlation between the pore radius distribution and the permeability contribution rate, but it is not completely consistent.
HK, GL, and JG contributed to the conception and design of the study. JG wrote the first draft and all authors confirmed the final version of the manuscript.
This work was supported by Open Fund of State Key Laboratory of Enhanced Oil Recovery, PetroChina (Grand No: 2022-KFKT-29), by Science and Technology Project of Hebei Education Department (Grand No: QN2018158) and by Science and Technology Fund of Hebei Normal University (Grand No: L2017B21).
The authors acknowledge the contributions of Hebei Normal University, State Key Laboratory of Enhanced Oil Recovery and Research Institute of Petroleum Exploration and Development, PetroChina that aided the efforts of the authors.
Authors GL and JG were employed by PetroChina.
The remaining author declares that the research was conducted in the absence of any commercial or financial relationships that could be construed as a potential conflict of interest.
All claims expressed in this article are solely those of the authors and do not necessarily represent those of their affiliated organizations, or those of the publisher, the editors and the reviewers. Any product that may be evaluated in this article, or claim that may be made by its manufacturer, is not guaranteed or endorsed by the publisher.
Cao, Y., Xi, K., Li, K., Liu, K., Zhu, R., and Yang, T. (2019). Several key issues related to tight oil and gas reservoir studies in lacustrine basin. J. China Univ. Petroleum(Edition Nat. Sci. 43 (5), 11–20. doi:10.3969/j.issn.1673-5005.2019.05.002
Fang, X., Guo, Y., Wang, P., Wang, P., and Guo, J. (2020). The progress of research on tight oil accumulation and several scientific issues requiring further study. Geol. China 47 (1), 43–56. doi:10.12029/gc20200104
Gu, X., Pu, C., Huang, H., Huang, F., Li, Y., Liu, Y., et al. (2017). Micro-influencing mechanism of permeability on spontaneous imbibition recovery for tight sandstone reservoirs. Petroleum Explor. Dev. 44 (6), 1003–1009. doi:10.1016/s1876-3804(17)30112-x
Kang, Y. (2020). Prospect analysis of Carboniferous-Permian tight oil and gas resources in northern China. Fault-Block Oil Gas Field 27 (6), 681–683. doi:10.6056/dkyqt202006001
Liao, Q., Hu, H., Lin, J., Lin, Z., and Mu, X. (2011). Petroleum exploration prospect of the Jurassic tight reservoirs in central Sichuan Basin. Oil Gas Geol. 32 (6), 815–822.
Lowell, S., and Shields, J. E. (1991). Powder Surface area and porosity. 3rd. Ed. London: Chapman & Hall.
Wang, Y., Wang, S., Li, J., and Zhang, Y. (2019). The hydrocarbon expulsion efficiency of medium-low mature source rocks and tight-shale oil potential in the Es4, Leijia area in West Depression, Liaohe Basin. Oil Gas Geol. 40 (4), 810–821. doi:10.11743/ogg20190411
Wang, Z. (2013). Research progress, existing problem and development trend of tight rock oil. Petroleum Geol. Exp. 35 (6), 587–595. doi:10.11781/sysydz201306587
Xu, J., Chen, Z., Wu, K., Li, R., Liu, X., and Zhan, J. (2019). “On the flow regime model for fast estimation of tight sandstone gas apparent permeability in high-pressure reservoirs,” in Energy Sources, Part A: Recovery, Utilization, and Environmental Effects. doi:10.1080/15567036.2019.1687625
Xu, J., Wu, K., Li, R., Li, Z., Jing, L., Xu, Q., et al. (2019). Nanoscale pore size distribution effects on gas production from fractal shale rocks. Fractals 27 (8), 1950142. doi:10.1142/S0218348X19501421
Xu, J., Wu, K., Yang, S., Cao, J., and Chen, Z. (2017). “Nanoscale free gas transport in shale rocks: A hard-sphere based model,” in SPE Unconventional Resources Conference, Calgary, Alberta, 15–16, February 2017. doi:10.2118/185022-MS
Keywords: permeability characterization, core analysis, mercury injection, tight oil, reservoir evaluation
Citation: Kang H, Li G and Gao J (2023) Study on permeability characteristics of tight oil reservoir through high-pressure mercury injection. Front. Energy Res. 10:1023099. doi: 10.3389/fenrg.2022.1023099
Received: 19 August 2022; Accepted: 26 September 2022;
Published: 06 January 2023.
Edited by:
Qian Sun, China University of Geosciences, ChinaReviewed by:
Jinze Xu, University of Calgary, CanadaCopyright © 2023 Kang, Li and Gao. This is an open-access article distributed under the terms of the Creative Commons Attribution License (CC BY). The use, distribution or reproduction in other forums is permitted, provided the original author(s) and the copyright owner(s) are credited and that the original publication in this journal is cited, in accordance with accepted academic practice. No use, distribution or reproduction is permitted which does not comply with these terms.
*Correspondence: Jian Gao, Z2FvamlhbmVvckAxMjYuY29t
Disclaimer: All claims expressed in this article are solely those of the authors and do not necessarily represent those of their affiliated organizations, or those of the publisher, the editors and the reviewers. Any product that may be evaluated in this article or claim that may be made by its manufacturer is not guaranteed or endorsed by the publisher.
Research integrity at Frontiers
Learn more about the work of our research integrity team to safeguard the quality of each article we publish.