 Wei Wang
 Bingyin Xu1*
- 1School of Electrical and Electronic Engineering, Shandong University of Technology, Zibo, China
- 2Electric Power Research Institute of State Grid Hubei Electric Power Co, Ltd, Wuhan, China
- 3School of Electrical Engineering, Shandong University, Jinan, China
The detection of series arc faults using fault current is difficult to overcome the influence of load types, making it difficult to establish a unified fault detection criterion. In contrast, since the arc voltage waveform of fault point is less affected by the load types and is basically a square wave shape, which provide conditions for constructing a unified fault criterion. In terms of the fault information, the fault distortion point of voltage on load-side caused by the arc voltage transition edge provides the position information of the arc voltage transition edge, and its polarity, amplitude and rate of change make it possible to distinguish from the transition edge caused by normal harmonic voltage drop, which provide the theoretical basis for fault detection using the voltage on load-side. Based on the basic analysis of arc voltage waveform features, this paper proposes an arc fault detection method based on load-side voltage sensitive feature tracking for the purpose of identifying the existence of arc voltage transition edges. The method proposed in this paper highlights the transition edge by eliminating the fundamental wave component of the voltage on load-side, the phase areas where the fault distortion points may exist are used as the sensitive area for fault detection, and the identification and tracking of the transition edge is achieved based on the same direction of voltage change, finally, the presence of arc fault voltage is characterized through the polarity, amplitude and rate of transition edge by fusion. The detection method proposed in this paper has a clear physical meaning and has the advantage of being less affected by the load types. Compared with other similar methods, the method proposed in this paper has higher detection sensitivity and stronger ability to distinguish from voltage drop distortion. The experimental results show that the average detection accuracy of the proposed method for faults detection under various loads exceeds 96%, which verifies the effectiveness of the method.
Introduction
Arc faults caused by loose terminals, insulation damage and conductor damage in low-voltage distribution lines are important causes of electrical fires, which account for more than 45% of electrical fires in residential buildings (Liu et al., 2017a; Novak et al., 2018). Nonetheless, the detection of series arc fault remains a difficult problem in the field of arc fault detection due to the features that the fault current is similar to the load current, and the waveform features are difficult to distinguish from the load current of the nonlinear loads (USFA, 2018; Liu et al., 2017b).
The detection methods for series arc faults based on electrical monitoring quantities are mainly divided into two categories: (1)detection methods based on fault current features, whose selections of fault features mainly focuses on the harmonics content of fault current (Baptiste Humbert et al., 2021; Jiang et al., 2022), high frequency components (Wang et al., 2017a; Bao et al., 2019), singularity of the zero-break (Lu et al., 2017; Pan et al., 2017) and the randomness of fault current (Zhang et al., 2016a; Wang et al., 2017b), etc. However, the feature of harmonics content is difficult to distinguish from the nonlinear loads, the feature of high-frequency components has the problem in the threshold selection, the zero-break feature is easily weakened by the influence of the inductive component in the loads. Although the randomness feature can overcome the influence of the diversity of the load current waveform itself, its detection sensitivity and uncontrollable features make it limited in application. In recent years, many scholars have carried out many researches for the purpose of multi-feature fusion (Wang et al., 2018; Gong et al., 2022), related methods mainly focus on neural network methods (Siegel et al., 2018; Wang et al., 2019), support vector machine methods (Jiang et al., 2019; Lin et al., 2020) and fuzzy recognition methods (Calderon-Mendoza et al., 2019). However, the generalization ability of such methods to different types of loads is still worthy of study, furthermore, the redundancy between features and the selection of optimal features are also worthy of study (Duc Vu et al., 2019). 2) Detection methods based on fault voltage features (Xiren et al., 2014): extracts arc fault features by using wavelet decomposition on load-side voltage (Zhang et al., 2016b) uses empirical mode decomposition to extract load-side fault features of voltage. Both of the two methods essentially use the fault distortion of load-side voltage caused by the arc-starting of arc voltage, since the features of arc voltage off-phase angle could be easily affected by load types and line parameters, it is difficult to set the detection threshold in practical application (Hongxin et al., 2019). uses wavelet packet to decompose the load-side voltage, and the prediction residual of the ELM(Extreme Learning Machine) is used to extract the fault features of arc voltage for detection, the actual detection performance of this method depends on the number of types of training loads (Shekhar et al., 2018). used the voltage drop information on the load-side for series arc fault detection in DC systems.
Compared with the current features, the arc voltage at the fault point is less affected by the load types. Therefore, it is easier to establish a unified fault detection criterion by identifying the existence of the fault arc voltage. The arc voltage at the fault point is equivalent to a fault voltage source when arc fault occurs, since the load impedance is much larger than the line impedance of the loop, the fault information of arc voltage basically acts on the load-side voltage which is the downstream of the fault point. The distributed and communication conditions of the Internet of Things technology have created conditions for low-voltage power distribution terminals and electrical equipment to be equipped with complex fault detection functions (Huang et al., 2021), which provides the application basis for the use of low-voltage power distribution terminals, smart sockets and even smart appliances to implement fault detection for its upstream lines. Therefore, the arc fault detection method based on the load-side has important theoretical significance and engineering application value.
In this paper, a mathematical description of the arc voltage is established, and the fault detection method based on sensitive feature tracking is proposed based on the analysis of the fault characterization of the arc voltage at the fault point on the load-side voltage. The method aims to identify the existence of the arc voltage transition edge in the sensitive phase region, and integrates the phase, polarity, amplitude and rate of change information of the arc voltage transition edge to characterize its existence and provide the basis for fault detection.
Analysis of arc voltage and fault features
Mathematical description of arc voltage
The arc process consists of arc-starting, arc-burning and arc-extinguishing, in which the voltages of arc-starting and arc-extinguishing stages are mainly determined by features of circuit and the arc-burning stage is determined by the volt-ampere features of arc itself. Since the equivalent impedance of load is much smaller than that of arc-starting and arc-extinguishing, the waveform features in the two stages are mainly determined by the power supply voltage in the low-voltage systems. The millimeter-level arc gap can extinguish the arc when arcing, so the voltage drop of arc column can be ignored, and the arc voltage is approximately equal to the sum of the near-anode and near-cathode voltage drops at the fault point (Slade, 2014):
where
Assuming the power supply voltage is expressed as
For resistive loads shown in Figure 1A:
where
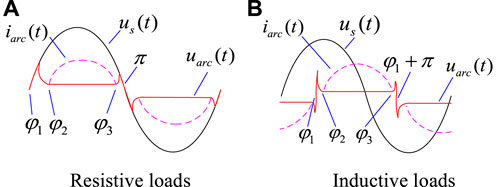
FIGURE 1. Diagram of phase relation between arc voltage and supply voltage. (A) Resistive loads (B) Inductive loads.
For inductive loads shown in Figure 1B:
where
Analysis of arc voltage waveform features
Figure 2 shows the arc voltage at the fault point and fault current waveforms of resistive, resistive-inductive and nonlinear loads. The current waveforms of different types of loads differ greatly, most of which show the features of zero-break distortion and harmonics on the basis of the load current waveform itself. However, due to the influence of the diversity features of the nonlinear load current waveforms, the detection methods using current fault features are difficult to implement.
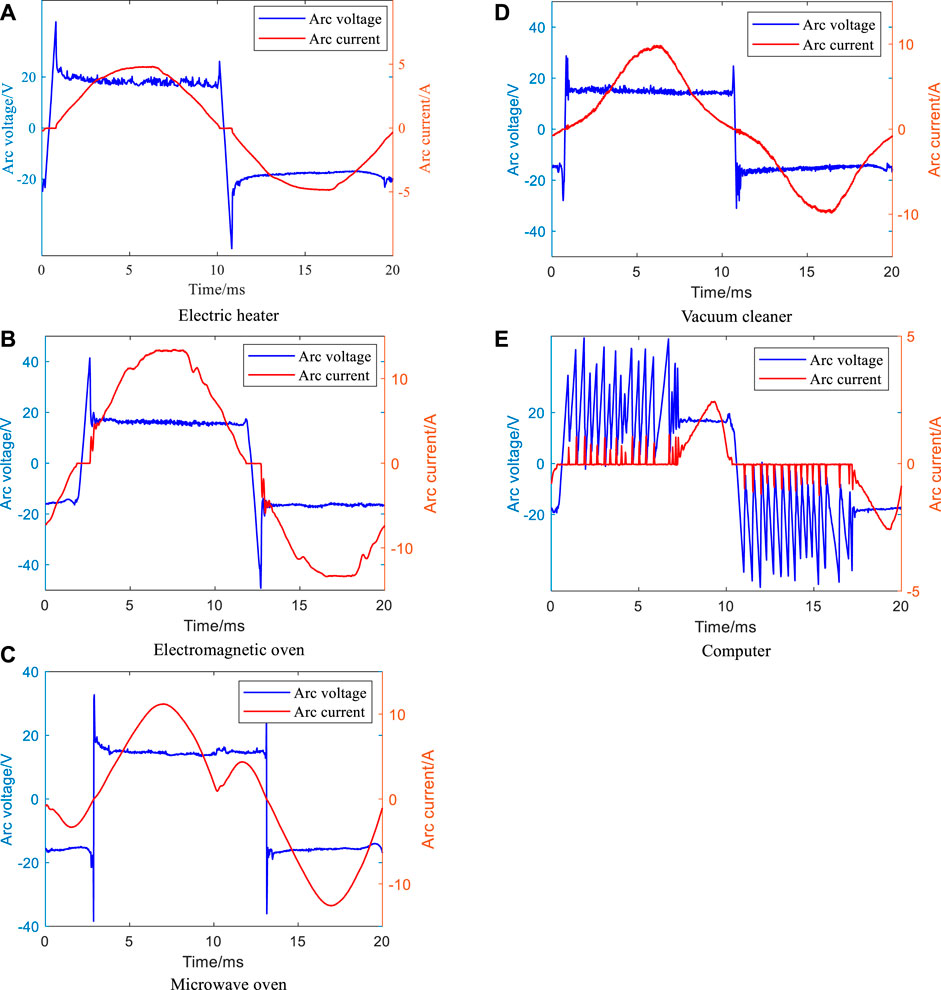
FIGURE 2. Waveforms of arc voltage and current of different types of loads (A) Electric heater (B) Electromagnetic oven (C) Microwave oven (D) Vacuum cleaner (E) Computer.
As shown in Figure 2, the high rate of change of the arc voltage in the arc-extinguishing to arc-starting stage and the approximate DC features in the arc-burning stage make it appear as an approximate square wave shape. For Figure 2E, since the computer is a switching power supply load, the long “zero-off” time of the load current makes the current in this process too small to maintain a stable arc-burning, which makes the arc voltage produce high-frequency oscillation feature at this stage. However, its low-frequency profile is still approximately a square wave.
The arc voltage can be described by the DC voltage in the arc-burning stage and the rising (falling) edge in the arc-extinguishing to arc-starting stage in terms of local features. According to formula (1), the amplitude of arc-burning is generally around 20V; the amplitude of rising (falling) edge is determined by the difference between the arc-burning and arc-extinguishing peak voltages of the positive and negative half-waves, and the peak voltage mainly depends on the breakdown time of gap in arc-starting (arc-extinguishing) stage and the types of loads. The higher the power supply voltage at the end of arc-starting (arc-extinguishing), the greater the peak voltage of arc-starting (arc-extinguishing), and the greater the amplitude of the arc voltage transition edge. In actual system, although the peak voltages of arc-starting and arc-extinguishing have randomness to a certain extent, from an overall point of view, the larger peak voltages of arc-starting and arc-extinguishing are still as the typical features (shown in Appendix A). The rate of the rising (falling) transition edge of the arc voltage usually has a high rate of change, and the load with inductive components is higher than that of the resistive load. In addition, the rate of change of arc voltage is significantly higher than that of load current near the same phase region.
Analysis of voltage fault features on load-side
As shown in Figure 3, it is equivalent to a fault voltage source
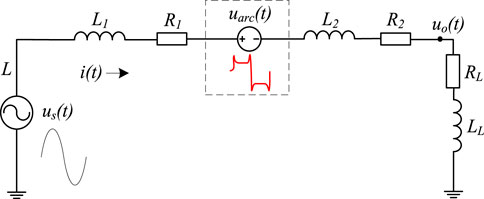
FIGURE 3. Equivalent circuit diagram of series arc fault.
Considering the arc voltage
where A represents the voltage of arc-burning,
According to the equivalent circuit in Figure 3, the load-side voltage
where
For the global harmonic features, the arc square wave voltage will additionally introduce the fault fundamental wave and odd harmonics to the load-side voltage when an arc fault occurs. According to Eq. 5, for the fundamental wave, the phase of the fault fundamental wave and the inherent fundamental wave of the load-side voltage are basically opposite, and the fault will cause the fundamental wave amplitude of the load-side voltage to decrease. For the harmonics, the inherent harmonics of the load-side voltage are generated by the harmonics of line voltage drop, although the waveform of line voltage drop is diverse due to the influence of the load current, since its waveform will not be in the shape of a reverse square wave, the inherent harmonic phase of the load-side voltage does not coincide with the fundamental phase. Besides, since the phase of the fault harmonic is opposite to the fundamental wave of the load-side voltage and the amplitude of the fault harmonic is generally higher than the inherent harmonic amplitude, the harmonic content post-fault is generally higher than the pre-fault. Since the inherent harmonic content of the load-side voltage is different due to the influence of the load types and line parameters (Brown, 2009), it is difficult to set the fault detection threshold only by using the voltage distortion rate. It is necessary to use the local features of the fault components to improve the detection sensitivity.
Since the amplitude of arc-burning is less than 20V, and the peak value of load-side voltage generally exceeds 300V, the DC voltage of arc-burning accounts for only about 5% of the total voltage on the load-side; besides, due to the influence of the inherent harmonics of the load-side voltage, the detection sensitivity based on arc-burning feature is very low, which limits the application. For the features of the rising (falling) edge, the position of the distortion generated by which on the load-side is determined by the power factor of the faulty branch, and its polarity, high amplitude and high rate of change make it distinguishable from normal line harmonic voltage drop, thus, the high detection sensitivity is achieved using this feature. In order to highlight the features of the arc voltage transition edge, an arc fault detection method is proposed by fusing and identifying the phase, polarity, amplitude and the rate of change information.
Fault detection method based on sensitive feature tracking
Principle of fault detection
The transition edge of the arc voltage is generated by the arc-extinguishing to arc-starting process which happens near the zero-crossing point of the load current. The transition edge of arc voltage has a different phase deviation
The rising (falling) edge of the arc voltage can be described using the polarity, magnitude, and rate of change. For the polarity feature, the rising edge corresponds to the distortion point near phase 0 of load-side voltage, and the falling edge corresponds to the distortion point near phase
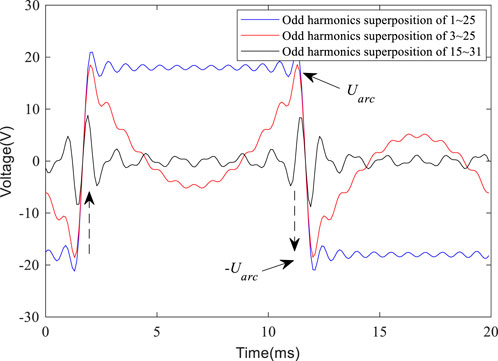
FIGURE 4. Waveforms composed of different harmonic components.
Compared with the load-side voltage, since the amplitude of the arc voltage transition edge is relatively small, the sensitivity of direct detection is low. The fundamental wave component needs to be eliminated to improve the detection sensitivity. According to formula (5),
where
Eliminating the fundamental component in Eq. 6:
According to the above analysis, even if the fundamental wave component is eliminated, the high amplitude (greater than
Fault identification method based on sensitive feature tracking
In order to identify the existence of the arc voltage rising (falling) edge in the voltage sensitive phase region of the load-side, a fault identification method based on the sensitive feature tracking in the sensitive region is proposed in this paper.
As shown in Figure 5, the voltage distortion coefficient exceeding the limit is used as the detection activation condition to reduce the complexity of monitoring equipment. The voltage waveform distortion coefficient
where
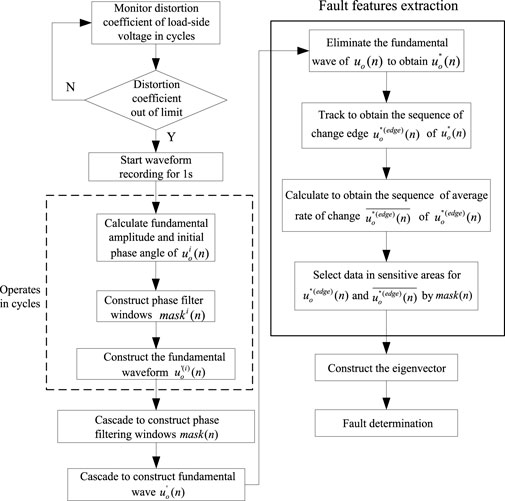
FIGURE 5. Flow chart of detection method.
Considering that the series arc fault has the features of continuous occurrence, the waveform is recorded in units of 1s after the detection algorithm is started.
Considering the influence of the phase accumulation error from data acquisition device and the fluctuation of power grid frequency, the voltage sensitive area on the load-side should be located in units of cycles. For each cycle
The sensitive phase filter windows
where
where
In order to highlight the fault features, using formula (7) to eliminate the fundamental wave component
where
Concatenating each
where
Constructing the rate sequence
Constructing cascading windows
where
Selecting the rising or falling edge as the identification target with a whole cycle as the identification unit, and the criterion is constructed as follows:
where
Experimental verification
Test principle and verification
As shown in Figure 6, using the arc fault generator to create arc faults on the line in real environment to test the method. The point-contact arc fault generator is made according to UL1699 standard, a copper electrode with a diameter of 10.0 mm is used as the moving contact, and a graphite electrode with a diameter of 8.0 mm is used as the reference static contact. The arc is generated by controlling the electrode gap, which is used to simulate the series fault arc caused by loose wiring terminals and accidental wire breakage. The load-side voltages are acquired by high-voltage differential probes (DP6150, 5 MHz bandwidth) and oscilloscopes (Tektronix MD03024). The method in this paper is tested using the loads in Table 1.
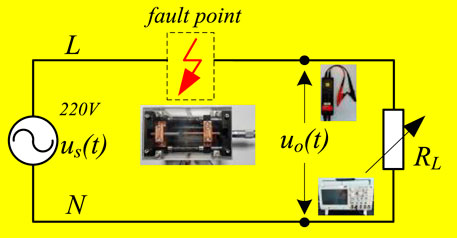
FIGURE 6. System test schematic diagram.
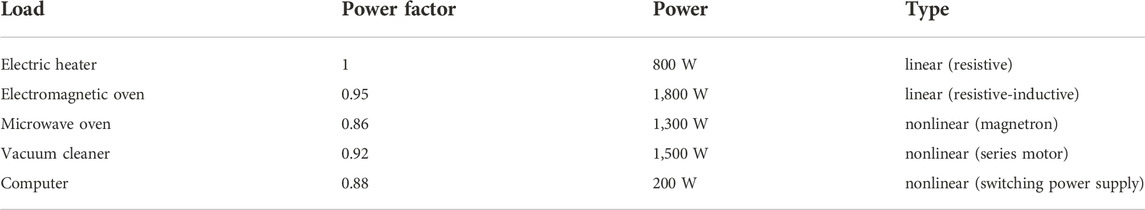
TABLE 1. Main parameters of loads for test.
Figure 7 shows the comparison of the voltage distortion coefficients on the load-side before and after the fault of different loads. The voltage distortion pre-fault is caused by the harmonic voltage drop of the branch where the load is located and the main circuit to the transformer. Affected by the difference in the harmonic content of the load current and load power, the distortion coefficients of different loads pre-fault are quite different. Under the same line parameters, the higher the harmonic content of the load current and the greater the load power, the greater the normal distortion coefficient. According to the load current waveforms shown in Figure 2 and the loads power shown in Table 1, the microwave oven has the highest distortion coefficient due to its high harmonic content and high power; the induction cooker and computer also have high distortion coefficient because of the high power and current harmonic content, respectively. Overall, the distortion coefficients pre-fault with different loads are concentrated between 2% and 4%. The distortion coefficients of each load post-fault are increased compared to that of pre-fault, and different loads show different degrees of increase. Considering the diversity of load types and the difference in the increase of the distortion coefficients before and after fault, it is difficult to use only the distortion coefficient as the detection criterion for arc faults detection. Considering the sensitivity of the algorithm and the start frequency, 3.5% should be used as the start threshold of the algorithm.

FIGURE 7. Comparison of voltage distortion coefficients of pre-fault and post-fault.
Considering the load power factor
As shown in Figure 8, the load-side voltages post-fault has obvious fault distortion points compared to the original waveforms, however, the distortion position and distortion degree of the distortion point are different affected by the types of loads. Specifically, the fault distortion points of electric heaters show zero-break features, the fault distortion features of electromagnetic ovens are relatively smooth, and the distortion features of microwave ovens and vacuum cleaners are relatively obvious, the load-side voltage of computers has multiple distortion points due to the influence of high-frequency noise of arc voltage. After eliminating the fundamental wave component, the original rising (falling) edges of the arc voltages are well highlighted, and the amplitude, rate of change and position features are effectively preserved. For the amplitude of the transition edge, although the harmonic voltage drops of transition edge reach a certain amplitude, the overall amplitude is smaller than that of the arc voltage due to the limited harmonic content. For the rate of voltage change, since the waveform of harmonic voltage drop does not have the high change rate feature as the arc voltage, its rate of voltage change is generally smaller than that of the arc voltage. Moreover, the features difference before and after the fault is much more obvious only from the amplitude and rate of change in the sensitive area of each waveform.
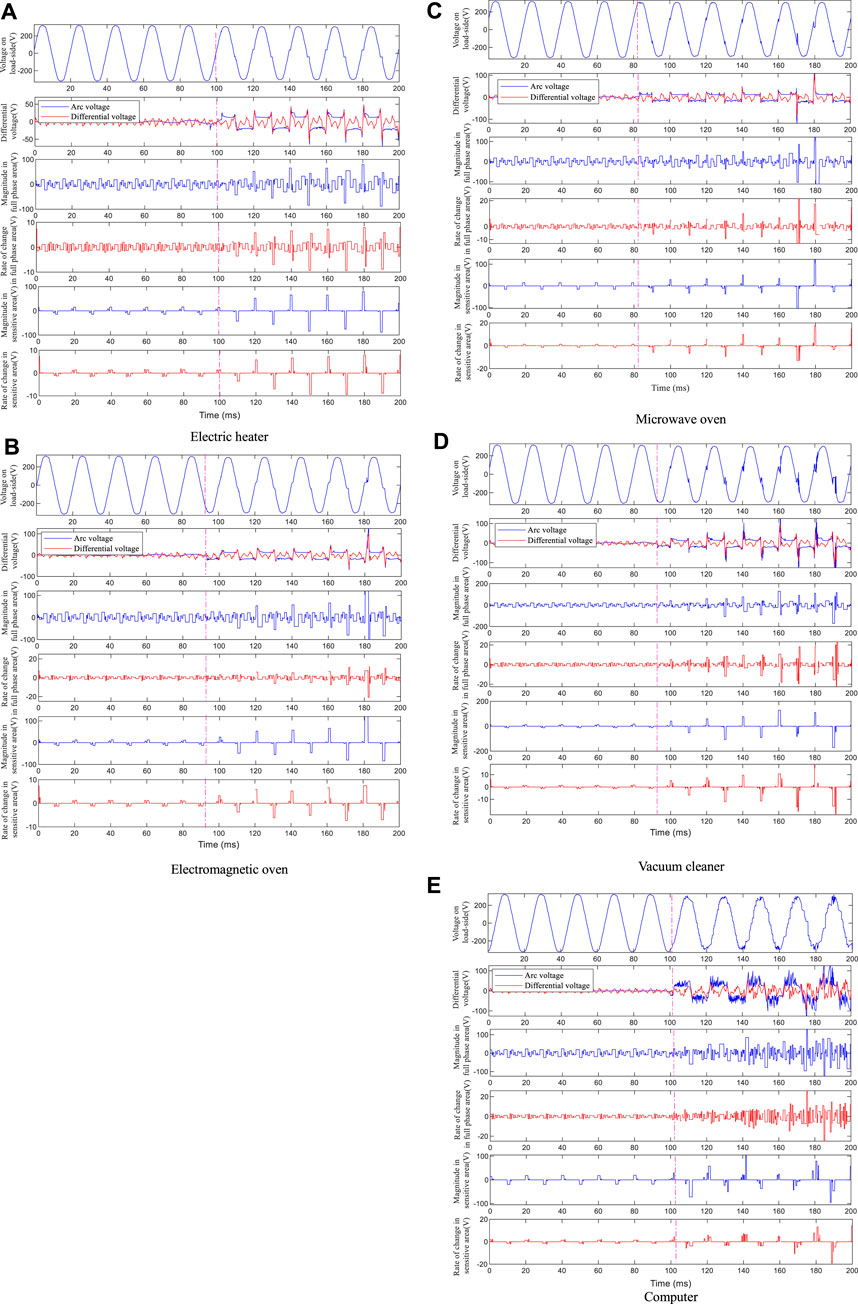
FIGURE 8. The identification results of the method (A) Electric heater (B) Electromagnetic oven (C) Microwave oven (D) Vacuum cleaner (E) Computer.
As shown in Figure 9, the feature recognition results of different loads in Figure 8 are compared simultaneously. Before the fault, the value and fluctuation of the amplitude and rate of change in the sensitive area are small; after the fault, the amplitude and rate of change of the sensitive area are significantly higher than those before the fault both in value and fluctuation. Although this feature is affected by the load types and the randomness of the arc voltage, overall, the fault features before and after the fault are significantly different. In addition, as shown in Figure 8, since the waveforms of point-contact arc fault voltage mostly has the gradual feature from small to large (shown in Appendix A), the difference between a small amount of fault data in the initial stage of the fault and the non-fault data may be small. However, due to the short duration of this process, it has no effect on the final test results.
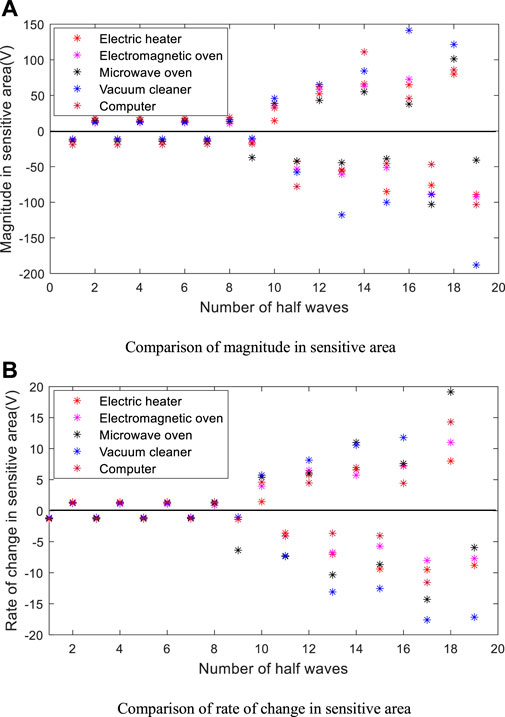
FIGURE 9. Comparison of features before and after fault of different loads (A) Comparison of magnitude in sensitive area (B) Comparison of rate of change in sensitive area.
Figure 10 shows the two-dimensional features of different loads before and after the fault on a long-term scale (50 sets of fault and non-fault waveforms respectively). The non-fault feature points are basically distributed in the area near (0,0) point; for the fault feature points, the absolute value of the amplitude of the sensitive area is greater than 40 V and the absolute value of the rate of change of the sensitive area is greater than 4V, which have obvious distance difference from non-fault feature points. Setting the detection threshold according to the principle of avoiding misjudgment, even if few fault cycles in the initial stage of the fault may be missed, since both UL1699 and IEC standards use the detection of 14 or more half-wave faults within 1s as the basis for fault confirmation, it has no effect on the final detection result. Affected by the difference in arc fault voltage waveforms, the fault feature points of different loads show different distribution features, electric heaters and electromagnetic oven have the features of relatively small absolute values and relatively concentrated distribution influenced by its low arc-starting (arc-extinguishing) peak value and slow rate of the arc voltage transition edge; the rate of change of the arc voltage of the microwave oven is higher than the former, thus, the overall rate of change of the feature points is greater than the former; vacuum cleaner and computer have the features of relatively big absolute value and relatively scattered distribution influenced by its high arc-starting (arc-extinguishing) peak value. The detection threshold
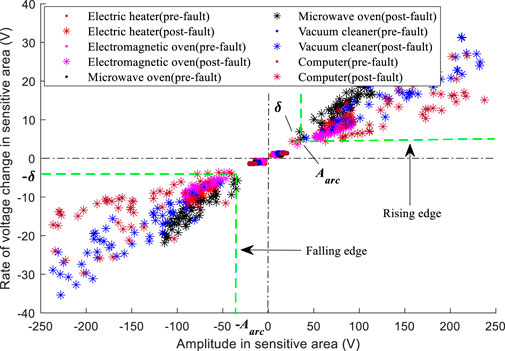
FIGURE 10. Distribution diagram of two-dimensional features.
Comparison of methods
For the purpose of identifying the transition edge of arc voltage, the fault detection can be carried out by identifying the feature of the distortion point of the voltage on the load-side, which is generally realized by use of the differential method and the wavelet analysis method.
For the fault distortion point, the differential value at the distortion point often fluctuates violently, so the difference method can be used to detect its singularity, one or more order differences can be performed to highlight fault features in practical applications. The 1-order and m-order differences are as follows:
The wavelet analysis method utilizes the feature of high frequency information of fault distortion points, characterizing the existence of the fault by analyzing the maximum value of the wavelet coefficient modulus of the feature frequency band in which the fault is located.
The test data in this paper is 200 sampling points per cycle, whose highest detection sensitivity of fault is under the 2-order difference. For the wavelet analysis method, since the transition edge of the arc voltage is approximately a pulse signal, the orthogonal quadratic spline wavelet function with biorthogonal and compactly supported features should be selected as the mother function of wavelet decomposition. The bior2.6 wavelet is selected in this paper, whose d2 wavelet coefficient (1.25 k∼2.5 kHz frequency band) has the highest detection sensitivity (the comparison of different differential orders and wavelet coefficients is shown in Appendix B).
As shown in Figure 11, taking the electromagnetic oven with relatively smooth fault distortion features and the vacuum cleaner with large singularity of distortion features as examples. The magnitude of fault features and the ability to distinguish from normal line voltage drop distortion of different methods are compared. As shown in Table 2, for the difference method and the wavelet method, the detection effect of the fault point with large singularity is better, but the effect of smooth singular point with small singularity is poor. In contrast, the method in this paper identifies the inherent waveform features of the fault point, thus, both the size of fault component itself and the ability to distinguish from normal voltage drop distortion are obviously better than the above methods. Setting the detection threshold on the principle of avoiding misjudgment, the detection accuracy of the above methods is compared (the accuracy is calculated in half-wave units), the fault and non-fault waveforms of each load are not less than 500, the average detection accuracy of each method is shown in Table 3.
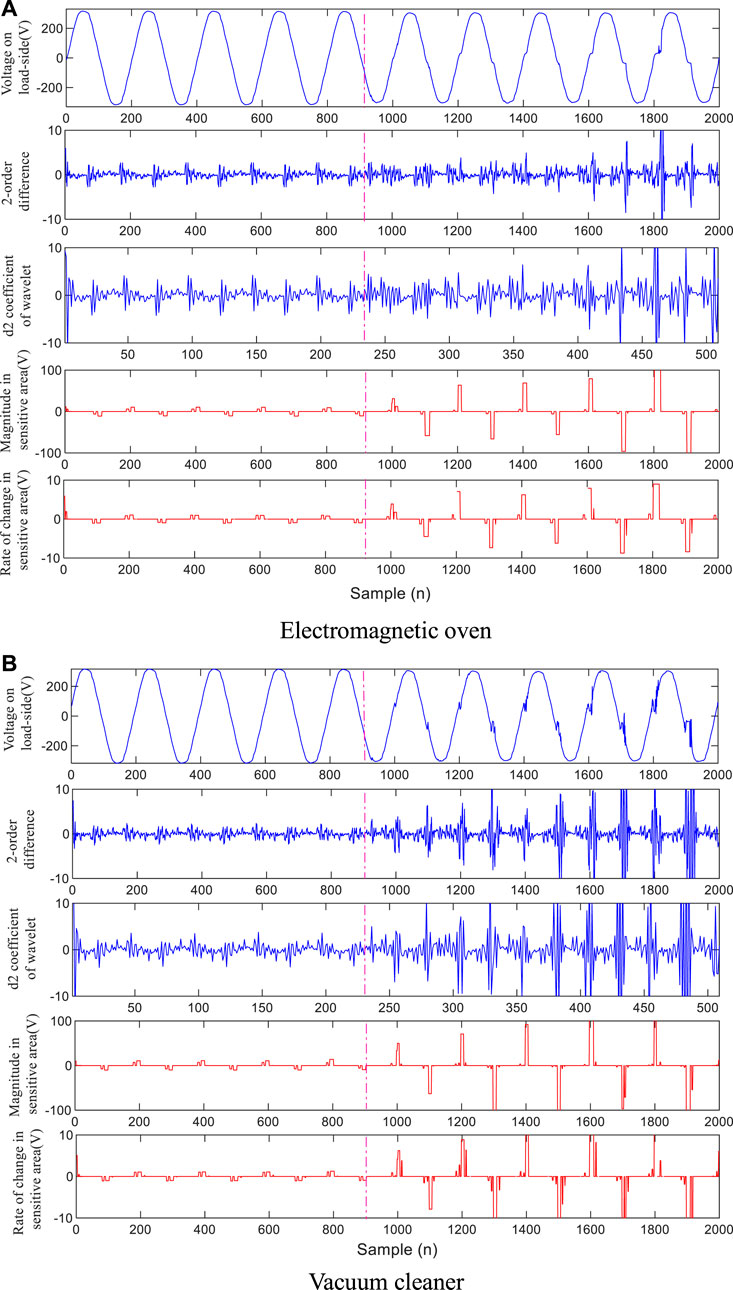
FIGURE 11. Comparison of identification effects of related methods (A) Electromagnetic oven (B) Vacuum cleaner.
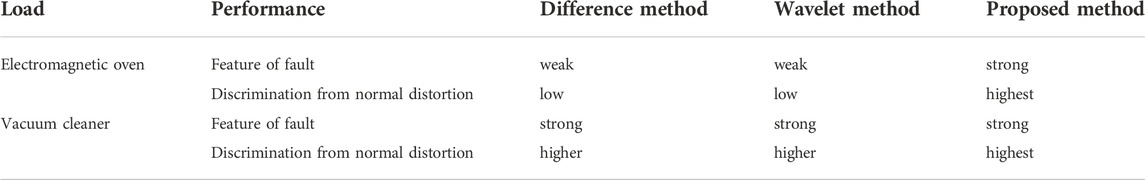
TABLE 2. Comparison of the effects of related methods.
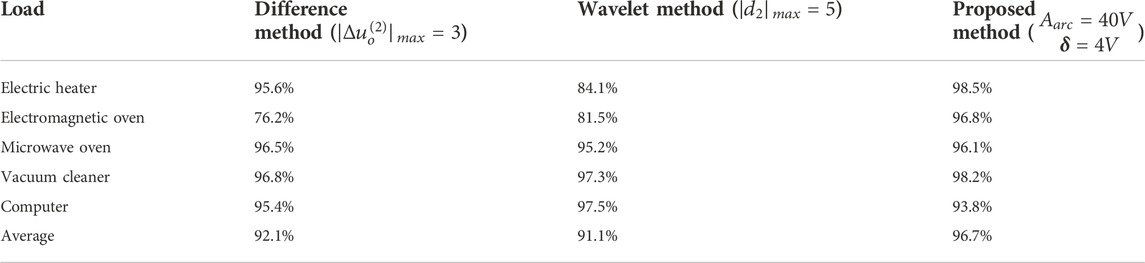
TABLE 3. Comparison of detection accuracy of related methods.
According to the results in Table 3, and observing the load-side voltage waveforms of different loads in Figure 8, on the whole, the difference method and the wavelet method have poor detection effect on smooth distortion points, and better effect on distortion points with larger singularity. In contrast, the method proposed in this paper is not affected by the above factors. Moreover, the detection methods based on transform decomposition mostly have the problem of selecting feature frequency band, while the method in this paper is based on the direct identification of the existence of arc voltage transition edge, thus have a clear threshold selection basis and physical meaning, which shows the effectiveness of the method.
Conclusion
The paper proposes a method to detect series arc faults by identifying the existence of arc voltage transition edges through the fault points on the load-side. The distortion points caused by arc voltages can be distinguished from the line voltage drop distortion through the phase, polarity, amplitude and rate of change features comprehensively. Since the arc voltage waveforms of fault points are less affected by the load types, compared with the traditional current detection methods, the method in this paper has the advantage of being less affected by the load types, and it is easy to construct a unified criterion.
The distortion points generated by transition edges of arc voltages appear in a local area of the load-side voltage centered on 0 and
The method can be used to monitor the faults of the public distribution lines in the station area with smart circuit breakers and smart meters relying on the LPWAN technology. Moreover, with the development of home Internet of Things technology, the method can also be used for fault monitoring on indoor lines relying on household appliances, smart sockets, smart circuit breakers, etc.
Data availability statement
The original contributions presented in the study are included in the article/supplementary material, further inquiries can be directed to the corresponding author.
Author contributions
WW: responsible for resources, formal analysis, program compilation, and writing original draft. BX: responsible for methodology, formal analysis, and funding acquisition. FY: responsible for investigation, writing review and editing. ZS: responsible for resources and investigation. GZ: responsible for obtaining the experimental data.
Funding
This work was supported by the National Natural Science Foundation of China (grant numbers: 52077221).
Conflict of interest
Author FY was employed by Electric Power Research Institute of State Grid Hubei Electric Power Co, Ltd.
The remaining authors declare that the research was conducted in the absence of any commercial or financial relationships that could be construed as a potential conflict of interest.
Publisher’s note
All claims expressed in this article are solely those of the authors and do not necessarily represent those of their affiliated organizations, or those of the publisher, the editors and the reviewers. Any product that may be evaluated in this article, or claim that may be made by its manufacturer, is not guaranteed or endorsed by the publisher.
References
Arrillage, J., and Watson, N. R. (2000). Power system quality assessment. Hoboken, New Jersey, United States: John Wiley & Sons.
Bao, G. H., Gao, X. Q., Jiang, R., and Huang, K. (2019). A novel differential high-frequency current transformer sensor for series arc fault detection. Sensors 19 (17), 3649. doi:10.3390/s19173649
Baptiste Humbert, J., Schweitzer, P., and Weber, S. (2021). Serial-arc detection by use of Spectral Dispersion Index (SDI) analysis in a low-voltage network (270V HVDC). Electr. Power Syst. Res. 196, 107084. doi:10.1016/j.epsr.2021.107084
Brown, R. E. (2009). Electric power distribution reliability. Boca Raton, Florida, United States: CRC Press.
Calderon-Mendoza, E., Schweitzer, P., and Weber, S. (2019). Kalman filter and a fuzzy logic processor for series arcing fault detection in a home electrical network. Electr. Power Energy Syst. 107, 251–263. doi:10.1016/j.ijepes.2018.11.002
Duc Vu, H., Calderon, D., Schweitzer, P., Weber, S., and Britsch, N. (2019). Multi criteria series arc fault detection based on supervised feature selection. Int. J. Electr. Power & Energy Syst. 113, 23–34. doi:10.1016/j.ijepes.2019.05.012
Gong, Q., Peng, K., and Wang, W. (2022). Series arc fault identification method based on multi-feature fusion. Front. Energy Res. 1, 1–14. doi:10.3389/fenrg.2021.82441
Hongxin, G. A. O., Fengyi, G. U. O., and Aixia, T. A. N. G. (2019). Series arc fault prediction by using load side voltage. J. Liaoning Tech. Univ. Sci. 38 (4), 359–365. doi:10.11956/j.issn.1008-0562.2019.04.012
Huang, Y., Yu, H., and Yin, J. (2021). Data transmission schemes of power internet of Things: Present and outlook based on 5G technology. Trans. China Electrotech. Soc. 36 (17), 3581–3593. doi:10.19595/j.cnki.1000-6753.tces.201464
Jiang, J., Wen, Z., Zhao, M. X., Bie, Y., Li, C., and Tan, M. (2019). Series arc detection and complex load recognition based on principal component analysis and support vector machine. IEEE Access 7 (12), 47221–47229. doi:10.1109/access.2019.2905358
Jiang, J., Li, W., and Li, B. (2022). Application of the hurst index of current frequency spectrum in series arc fault detection. Control Theory & Appl. 39 (3), 561–569. doi:10.7641/CTA.2021.10670
Lin, J., Wang, Y., and Li, K. (2020). Arc fault detection method based on self-organizing feature mapping network. Electr. Power Autom. Equip. 40 (8), 210–216. doi:10.16081/j.epae.202006028
Liu, G., Du, S., and Su, J. (2017a). Research on LV arc fault protection and its development trends. Power Syst. Technol. 41 (1), 305–313. doi:10.13335/j.1000-3673.pst.2016.0804
Liu, Y., Tang, H., and Jin, J. (2017b). Statistical analysis of fire causes in typical first tier cities. Fire Sci. Technol. 36 (8), 1135–1138. doi:10.3969/j.issn.1009-0029.2017.08.034
Lu, Q., Wang, T., and Li, Z. (2017). Detection method of series arcing fault based on wavelet transform and singular value decomposition. Trans. China Electrotech. Soc. 32 (17), 208–217. doi:10.19595/j.cnki.1000-6753.tces.170196
Novak, C., Keller, M., Meza, T., McKinnies, J., Espinosa, E., and Calhoun, K. (2018). Pinched cord and overdriven staple failures: Research on the causation of an electrical fire. Fire Technol. 54 (4), 921–941. doi:10.1007/s10694-018-0715-1
Pan, Q., Slavisa, J., and Jinmi, L. (2017). Discrete wavelet transform optimal parameters estimation for arc fault detection in low-voltage residential power networks. Electr. Power Syst. Res. 143, 130–139. doi:10.1016/j.epsr.2016.10.008
Shekhar, A., Ramírez-Elizondo, L., Bandyopadhyay, S., Mackay, L., and Bauera, P. (2018). Detection of series arcs using load side voltage drop for protection of low voltage DC systems. IEEE Trans. Smart Grid 9 (6), 6288–6297. doi:10.1109/tsg.2017.2707438
Siegel, J. E., Pratt, S., Sun, Y., and Sarma, S. E. (2018). Real-time deep neural networks for internet-enabled arc-fault detection. Eng. Appl. Artif. Intell. 74, 35–42. doi:10.1016/j.engappai.2018.05.009
USFA (2018). Residential Building Electrical Fires. Top. Fire Rep. Ser. 19 (8), 1–14. https://www.usfa.fema.gov/statistics/reports/fire-causes/electrical-fires-v19i8.html.
Wang, Y., Zhang, F., and Zhang, S. (2018). A new methodology for identifying arc fault by sparse representation and neural network. IEEE Trans. Instrum. Meas. 67 (11), 2526–2537. doi:10.1109/tim.2018.2826878
Wang, Y., Zhang, F., Zhang, S., and Yang, G. (2017a). A novel diagnostic algorithm for AC series arcing based on correlation analysis of high-frequency component of wavelet. COMPEL-The Int. J. Comput. Math. Electr. Electron. Eng. 36 (1), 271–288. doi:10.1108/compel-08-2015-0282
Wang, Y., Zhang, F., Zhang, X., and Zhang, S. (2019). Series AC arc fault detection method based on hybrid time and frequency analysis and fully connected neural network. IEEE Trans. Ind. Inf. 15 (12), 6210–6219. doi:10.1109/tii.2018.2885945
Wang, Y., Wei, Q., and Ge, L. (2017b). Series ac arc fault detection based on high-frequency components of arc current. Electr. Power Autom. Equip. 37 (7), 191–197. doi:10.16081/j.issn.1006-6047.2017.07.029
Xiren, M. I. A. O., Yinting, G. U. O., and Jincheng, T. A. N. G. (2014). Load side arc fault voltage detection and identification with morphological wavelet. Trans. China Electrotech. Soc. 29 (3), 237–244. doi:10.19595/j.cnki.1000-6753.tces.2014.03.030
Zhang, G., Zhang, X., and Hua, L. I. U. (2016a). Online detection method for series arcing fault in low voltage system. Trans. China Electrotech. Soc. 31 (8), 109–115. doi:10.19595/j.cnki.1000-6753.tces.2016.08.014
APPENDIX A

FIGURE A1. Waveforms of fault arc voltage on long time scale (A) Electric heater (B) Electromagnetic oven (C) Microwave oven (D) Vacuum cleaner (E) Computer.
APPENDIX B
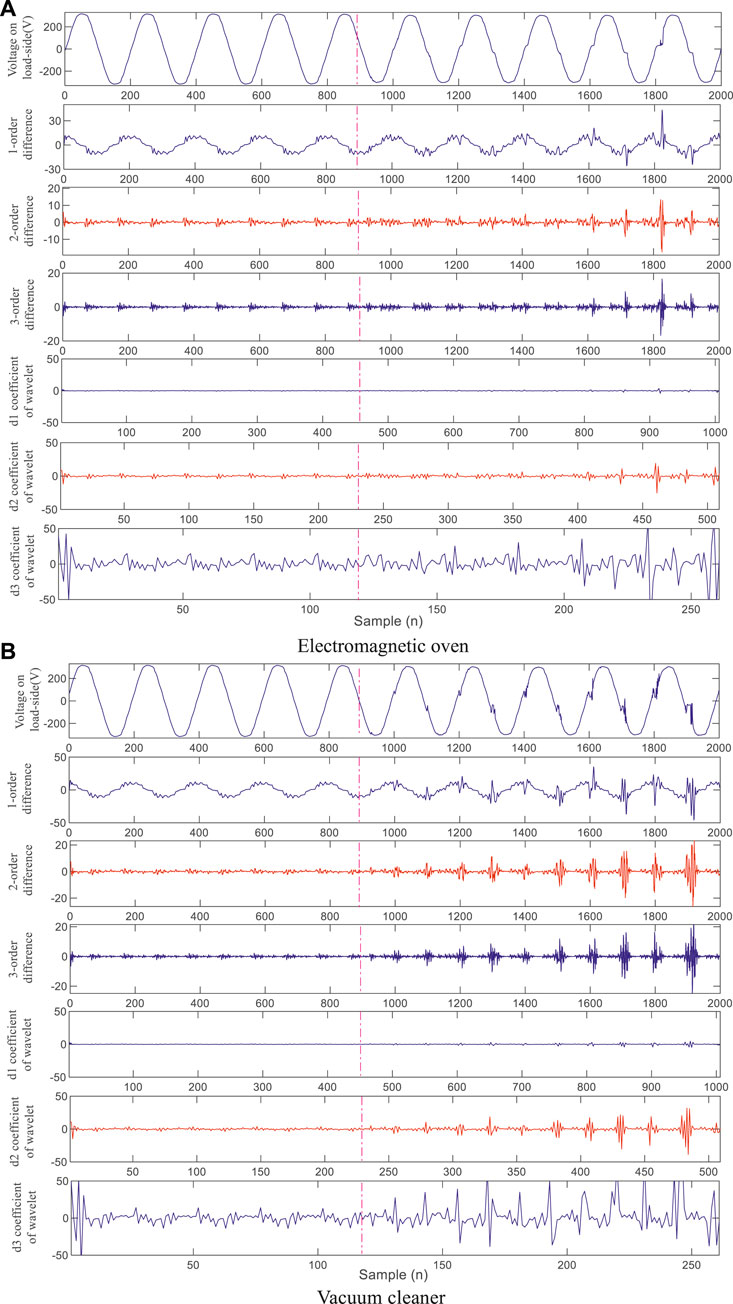
FIGURE B1. Comparison of different orders differences and wavelet coefficients (A) Electromagnetic oven (B) Vacuum cleaner.
Keywords: Arc fault, Arc voltage, fault distortion, identification of transition edges, multi-feature fusion
Citation: Wang W, Xu B, Yang F, Sun Z and Zou G (2023) Arc fault detection on load-side based on sensitive features tracking. Front. Energy Res. 10:1023060. doi: 10.3389/fenrg.2022.1023060
Received: 19 August 2022; Accepted: 26 September 2022;
Published: 10 January 2023.
Edited by:
Changhui Liu, China University of Mining and Technology, ChinaReviewed by:
Fanyue Qian, Tongji University, ChinaArturo García Pérez, University of Guanajuato, Mexico
Junbing Xiao, Changsha University of Science and Technology, China
Copyright © 2023 Wang, Xu, Yang, Sun and Zou. This is an open-access article distributed under the terms of the Creative Commons Attribution License (CC BY). The use, distribution or reproduction in other forums is permitted, provided the original author(s) and the copyright owner(s) are credited and that the original publication in this journal is cited, in accordance with accepted academic practice. No use, distribution or reproduction is permitted which does not comply with these terms.
*Correspondence: Bingyin Xu, eHVieUB2aXAuMTYzLmNvbQ==