 Md. Danish Equbal1
 Md. Manzar Nezami2
 Hythem Hashem3
 Mohit Bajaj4
 Tahir Khurshaid5*
 Sherif S. M. Ghoneim6
 Salah Kamel7*
- 1Department of Electrical Engineering, Galgotias College of Engineering and Technology, Greater Noida, India
- 2Department of Electronics and Communication Engineering, GLA University, Mathura, India
- 3Department of Computer Science, Faculty of Science and Arts at Belqarn, University of Bisha, Bisha, Saudi Arabia
- 4Department of Electrical Engineering, Graphic Era (Deemed to be University), Dehradun, India
- 5Electrical Engineering Department, Yeungnam University, Gyeongsan, South Korea
- 6Department of Electrical Engineering, College of Engineering, Taif University, Taif, Saudi Arabia
- 7Electrical Engineering Department, Faculty of Engineering, Aswan University, Aswan, Egypt
E-Nose finds its use in a wide range of applications such as quality assessment in food processing to toxic gas identification in chemical industry either in the offline or online mode. Their usage can be extended to transformer condition monitoring in the online mode. Considering the importance of transformers in power system and the impact it could create if faults in them are unidentified or left unattended, their functioning should be monitored on a real time basis. This work, describes the realization of a prospective E-Nose for online transformer incipient fault identification. The resistive gas sensor array has been simulated in real time using variable resistances forming one arm of a Wheatstone bridges. Separate variable resistances have been calibrated using characteristics of different fault gas sensors. The sensor array of the E-Nose helps to identify the transformer fault gases resulting from an incipient fault condition at the nascent stage itself and prompts for the necessary corrective action well before a catastrophic situation arises. Furthermore, ANFIS model of the Duval’s Triangle (DT) method have been developed to facilitate the online classification of incipient faults. The ANFIS models of other popularly used incipient fault interpretation methods, reported in earlier works, have also been used for a comparative analysis on their diagnostic capabilities. The developed model has been tested using the fault cases of IEC-TC10 fault database and the results thus obtained have been found to be very promising.
Introduction
Power transformers are essential and costly power system assets which are used primarily for changing voltage levels in the power system. Transformers operate with their insulation stressed both under normal stable operation and even during fault where the magnitude of stress is augmented by thermal or electrical fault conditions in the insulation. A timely diagnosis of these slow developing anomalies in the transformer could save the transformer and the system as a whole from large scale damages (Duval, 1989). Diagnosis of faults at the incipient stage can prevent large scale component outages. Incipient fault identification methodologies have been designed for the diagnosis of winding faults in squirrel cage induction motors (Wu et al., 2020) and for transformers as well. Dissolved Gas Analysis (DGA) is one such diagnostic tool that aids to predict such eventualities before their occurrences. However, DGA based incipient fault diagnosis has failed to give consistent reliable diagnosis at all times. Hence, the fault interpretation standards have apparent shortcomings in the form of no diagnosis or unresolved diagnosis. This calls for use of other tools that would aid the standards in the diagnosis process by removing these apparent fallacies (Duval, 2003; Duval, 2002; Singh and Bandyopadhyay, 2010a; Wani et al., 2015; Khan et al., 2020; Benmahamed et al., 2021; Zhang et al., 2022).
E-Nose system is essentially an array of sensors which can respond to a wide range of inputs. The need for E-Nose for transformer health monitoring arises from the requirement of nonintrusive diagnostic method (Gardner and Bartlett, 1994; Wilson and Baietto, 2009).
A host of soft computing methodologies have been implemented using the diagnostic standards of IEEE and IEC (Interpretation of the analysis of, 1978; Rogers, 1978; Hooshmand and Banejad, 2008; Author anonymous, 2009). The possibility of transformer incipient fault diagnosis and transformer insulation health monitoring has been explored using Artificial Neural Network (ANN) and Machine Learning (ML) (Guardado et al., 2001; Equbal et al., 2018; Nezami et al., 2021a; Ghoneim et al., 2021; Kherif et al., 2021; Taha et al., 2021), Fuzzy Logic (FL) system (Dukarm, 1993; Dhote and Helonde, 2012; Huang and Sun, 2013; Noori et al., 2017) and Adaptive Neuro Fuzzy Inference System (ANFIS) (Hooshmand et al., 2012; Khan et al., 2014; Vani and Murthy, 2014; Khan et al., 2015; Nezami et al., 2021b). However, these methods have their own limitations which needs to be addressed for their effective use in an online system.
In this work an online system of incipient fault identification of transformer is showcased through the use of an E-Nose and ANFIS based fault interpretation model. The E-Nose is realized by using an array of variable resistances simulating gas sensors instead of directly employing the sensors for identifying the evolved gas concentrations. These variable resistances simulate various resistive fault gas sensors. Variable resistance values are converted into gas concentrations by calibrating them using real sensor characteristics. Furthermore, one of the popular methods of incipient fault classification, the Duval’s Triangle Method (Duval, 1989; Duval, 2003; Duval, 2002; Singh and Bandyopadhyay, 2010a; Singh and Bandyopadhyay, 2010b), has been implemented using ANFIS. The E-Nose is interfaced with the online incipient fault detection model using a microcontroller. The gas concentrations obtained from the E-Nose are used as inputs in the ANFIS model which in turn helps diagnosis the fault developing in the transformer.
This paper proposes an online non-destructive procedure of transformer incipient fault identification without the use of sophisticated instruments and without interrupting the transformer operation. It aims to identify the gases evolved as a result of transformer oil decomposition and relay this information to an online system hosting the ANFIS model for interpretation of fault type. The conventional method involves a destructive procedure requiring the extraction of transformer oil and determination of dissolved gases in oil using gas chromatography and then interpreting the fault gases to converge upon the fault type. Here, the objective is to obtain a model that facilitates non-intrusive online detection of incipient fault with a high degree of accuracy. The testing of the developed system has been done using fault cases reported in IEC-TC10 fault database (Duval and DePablo, 2001; Gouda et al., 2021). The outcome of the diagnostic tests has been found to be reliable and suggests that the developed model can be regarded as a prospective online incipient fault identification system.
Development of an ANFIS model of the duval’s triangle method for online transformer incipient fault classification
Dissolved gas analysis
Transformer insulating oils, under normal aging as well as under increased thermal and electrical stress resulting from incipient faults, decomposes to release fault gases. The type and concentration of gases is fault dependent such that aging of oil will result in the production of the low molecular weight gases while incipient fault-related gases include hydrocarbons, oxides of carbon and some non-fault gas types as well. Sustained faults in transformers that are allowed to persist for longer duration may eventually lead to catastrophic failure of the transformer. The different types of gases that evolve due to transformer oil decomposition are: 1) Hydrocarbon and hydrogen-a. Methane (CH4) b. Ethane (C2H6) c. Ethylene (C2H4) d. Acetylene (C2H2) e. Hydrogen (H2) 2) Carbon oxides-a. Carbon monoxide (CO) b. Carbon dioxide (CO2) and 3) Non fault gases a. Nitrogen (N2) b. Oxygen (O2). Further, the classification may also be done on the basis of combustible gases (H2, CO, CH4, C2H6, C2H4 and C2H2) and non-combustible gases (CO2, N2 and O2). The gases released in the process of oil decomposition get dissolved in the liquid insulation. The identification of these gas types and their concentration would indicate the possible fault type (Singh and Bandyopadhyay, 2010a).
DGA is one of the most commonly used tools for online health monitoring of transformers in service. DGA has gained immense acceptability in maintenance procedures due to its ability to detect incipient faults in addition to providing early warnings of slow developing faults and the rate of the fault build up.
A number of ratio and concentration-based transformer incipient fault diagnosis methods have been universally adopted for determining the existing fault type in the transformer oil insulation using the DGA data. Various indicators such as Total Dissolved Combustible Gaz (TDCG), Total Dissolved Hydrogen and Hydrocarbon Gas (TDHG), the primary gases- Methane, Ethane and Ethylene (MEA) and thermal fault gases-Total Heat Gases (THG) use combination of gas concentrations for performing health assessment of transformer insulation. The TDCG method is most commonly used method among them and has been elaborated in the IEEE C57.104-2008 standard (Author anonymous, 2009). The ratio-based methods include the Roger’s Ratio Method, Doernenberg Ratio Method, and IEC methods while the Duval’s triangle method is a graphical method that uses relative gas concentration for performing diagnosis functions (Duval, 2002; Singh and Bandyopadhyay, 2010a; Zhang et al., 2022).
Duval’s triangle method of incipient fault identification
The Duval’s Triangle method is a transformer incipient fault diagnosis method that has gained world-wide acceptability due to its simplicity in application and interpretation, as well as its effectiveness in diagnosing fault conditions (Duval, 2002). It is a graphical method in which the region within the triangle is demarcated into seven zones, each representing a fault condition. This method uses the relative concentration of three fault gases (CH4, C2H4 and C2H2) to identify seven possible fault conditions namely, Partial Discharge (PD), Discharges of Low Energy (D1), Discharges of High Energy (D2), Thermal Fault, T< 300°C (T1), Thermal Fault, 300°C < T < 700°C (T2), Thermal Fault, T > 700°C (T3) and an intermediate fault zone comprising of a mix of electrical and thermal fault (DT). Figure 1 shows the Duval’s triangle along with the fault regions represented as polygons within the triangle. The relative concentration values of the three gases are calculated and plotted on their respective sides of the triangle using Eqs 1–3. The zone in which the point of intersection of the projection of the relative gas concentration from each side lies indicates the incipient fault type.
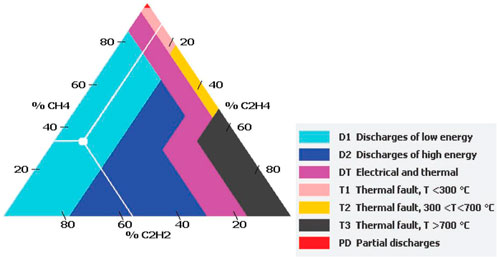
FIGURE 1. Duval’s triangle zones showing the identifiable fault types.
This method provides a fairly reliable diagnosis. The formulation of this graphical method is easy but the interpretation of the results requires precision. In addition, for transformer incipient fault diagnosis, the Duval’s triangle method mandates a fault condition to exist as it does not have the provision to diagnose a non-fault condition. It assigns a fault type to the no-fault cases, thus giving a wrong diagnosis (Duval, 2003) (Khan et al., 2020) (Singh and Bandyopadhyay, 2010b).
Development of ANFIS model of the duval’s triangle method
ANFIS is a hybrid approach to input-output mapping that makes use of the advantages of neural networks’ capacity for learning within the context of fuzzy inference systems. The generalised structure of ANFIS, which consists of nodes connected to one another through directed linkages, is depicted in Figure 2. ANFIS contains five layers, each of which has a fixed or adaptable node. The output of the adaptive square nodes depends on the input parameters. While the circular nodes are stationary and their output is dependent on the output of the previous layer. The directed linkages offer a conduit for the signal’s flow without changing its weight (Khan et al., 2015; Nezami et al., 2021b).
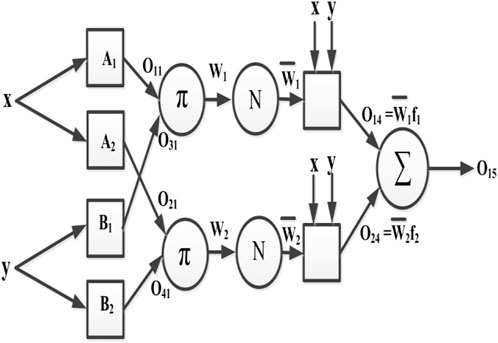
FIGURE 2. Generalized ANFIS structure.
Here, A1, A2, B1, and B2 are the four nodes that make up layer 1, the top layer. Each nodes represent a fuzzy set that converts the input to the output based on how closely it resembles the fuzzy sets. The output of node k in the first layer, Ok1, is determined by Eqs 4–7.
The circular shape of the layer two nodes indicates its fixed nature. These nodes combine the input signals to produce an output that is represented by Eqs 8, 9.
The third layer’s nodes carry out the layer 2’s output’s normalizing function. Eqs 10, 11 can be used to express this.
The outputs of layer four nodes are of the adaptive kind, and they depend on the nodes’ ensuing parameters. Because of this, the outputs of this layer mix the output of layer 3 with the parameters chosen by the fuzzy sugeno system. Eqs 12, 13 serve as representations of this form.
Where
where the system parameter set is composed of p, q, and r. In order to produce the final output, layer 5, the last layer, summarizes the incoming signals O14 and O24 to estimate O15. Eq. 16 is used to calculate this layers output.
The ANFIS model for the implementation of Duval’s triangle method has been developed in the MATLAB environment. The model has been trained based on the confinement of each fault type in a given zone. Separate ANFIS models have been trained suitably to identify their respective fault type using a training dataset comprising of 1821 simulated data points. Each of the ANFIS model has been trained to keep the error within a tolerance of 0.001. The triangular membership function when selected as the input MF gave the most accurate diagnosis. Hence, triangular MF has been chosen to represent the inputs while linear MF has been selected as the output MF in the developed ANFIS model. Seven ANFIS models have been developed, one for each of the seven faults that can be detected by the Duval’s Triangle method. The input gas concentrations are simultaneously applied to all the seven ANFIS model and the fault corresponding to the highest value in the output vector is identified as the prevalent fault type. The input-output pattern which forms the basis for the development of the ANFIS models is given in Table 1. The input values of P1, P2 and P3 are the contributions in terms of relative percentage of the three fault gases forming the three sides of the triangle. The input codes are taken as the coordinates of the vertices of the polygon representing the respective zones formed inside the triangle. Additional care has been taken to handle overlapping points by preventing replication of data points in two fault zones up to four places of decimals.
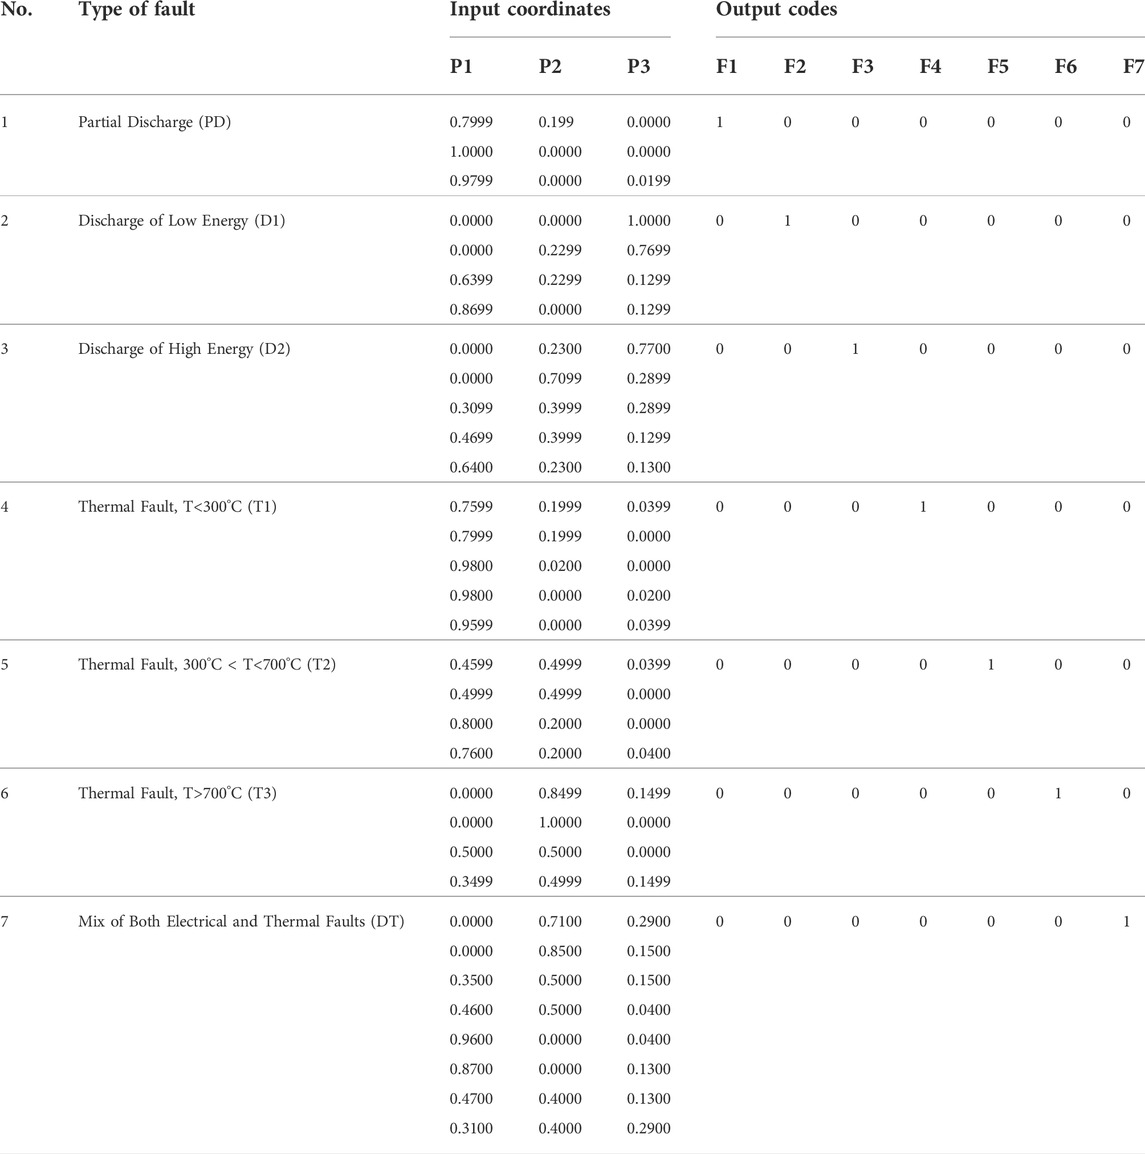
TABLE 1. Input-output codes for the ANFIS model of the Duval’s triangle.
Faults lying on the boundaries of two fault zones has been treated to be of the more severe type among them so as to prompt for immediate corrective action. This generalization for the ANFIS model has been made in view of the fact that if a given fault condition is sustained for larger time duration will lead to a more severe fault condition.
The MATLAB based GUI of the ANFIS model for Duval’s triangle method has been shown in Figure 3. This GUI can be utilized for online detection of the prevalent incipient fault in the transformer.
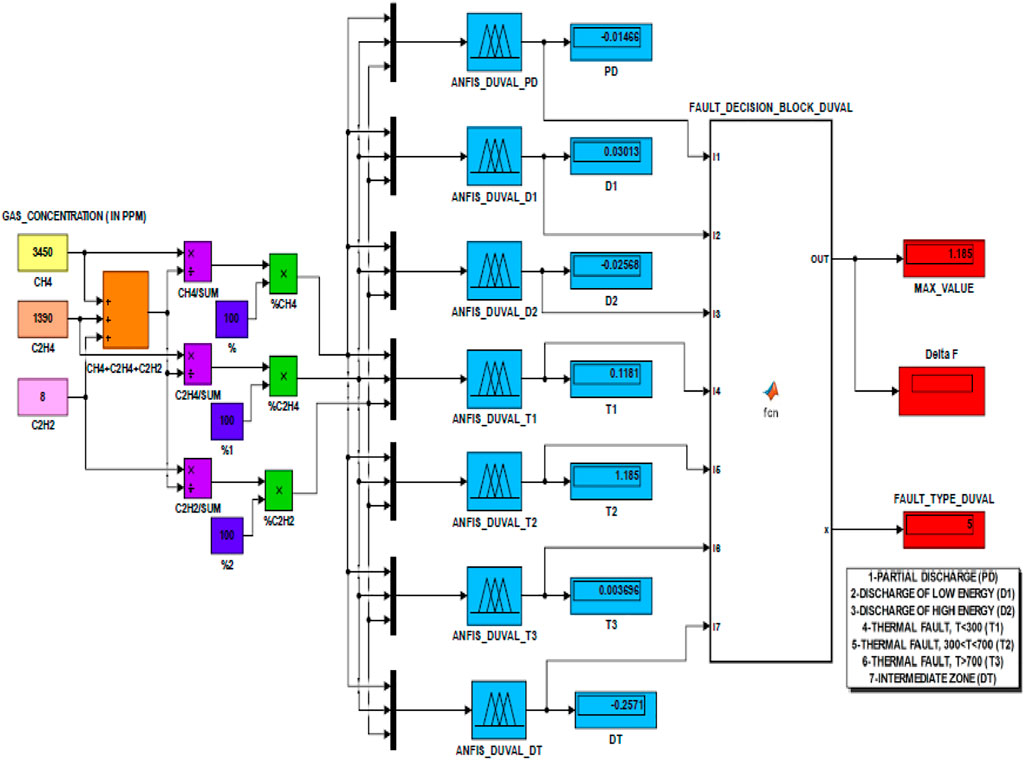
FIGURE 3. MATLAB GUI for ANFIS based implementation of Duval’s triangle method.
Development of E-NOSE based online transformer incipient fault identification system
Realization of E-Nose for transformer incipient fault gas identification
The objective here is to make a prototype of an E-Nose that would work in conjunction with an ANFIS based fault interpretation model for assessing the condition of the transformer and identifying the type of incipient fault existing in the transformer, if any. However, the E-Nose is not designed using an array of actual gas sensors but instead adopts the characteristics of these standard gas sensors to calibrate variable resistances, one for each fault gas type. One arm of the Wheatstone bridge is a variable resistance to account for the resistance change in accordance with change in gas concentration following the sensor characteristics. Output of the Wheatstone bridges have been calibrated using four gas sensors characteristics. The sensors based on which the system has been calibrated are MQ-2 for Hydrogen, MQ-4 for Methane, Figaro TGS2620 for ethylene and a lab fabricated sensor reported in (Lin et al., 2015) for acetylene. The schematic of the experimental setup showing the arrangement of the Wheatstone bridges and the interfacing equipment in the form of an Arduino Mega 2,560 microcontroller for online readings is shown in Figure 4. The essential specifications of the four sensors are summarized in Table 2.
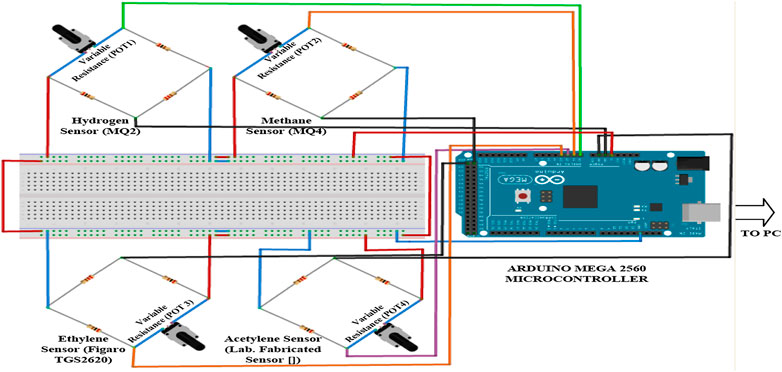
FIGURE 4. Schematic arrangement of a simulated E-Nose for online transformer incipient fault identification.
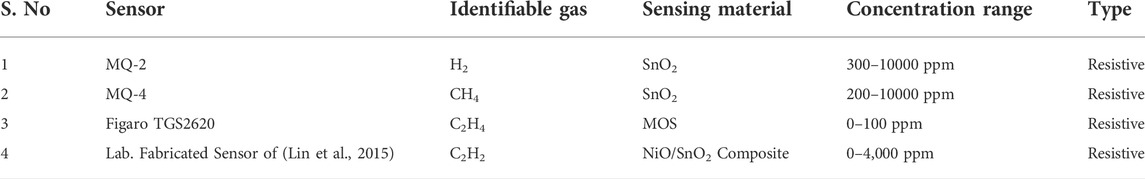
TABLE 2. Specifications of gas sensors.
As stated earlier, the feasibility of usage of an E-Nose for transformer incipient fault identification is studied through an arrangement of variable resistances simulating the actual characteristics of the sensors. The variable resistance is varied imitating the resistance variation of the sensing material due to the change in gas concentration. The resistance values corresponding to a given concentration is determined from the equations established using the sensitivity characteristics of the sensors.
In the balanced state, the voltage across the output terminals of the bridge remains zero. As the concentrations of the fault gases change, the balance of the respective Wheatstone bridges is disturbed due to the change in the sensor resistance and a voltage appears across the detector terminals of the Wheatstone bridge. This voltage representing the output voltage is detected and displayed on a monitor using a microcontroller-based interface. In order to obtain a diagnosis of the prevailing fault condition in the transformer the output voltage needs to be converted into gas concentrations in ppm. Calibration has been carried out using the voltage-concentration relation derived for each sensor.
The response characteristics (resistance-gas concentration relationship) and the voltage-gas concentration relationship for the MQ-2, MQ-4, Figaro TGS2620 and the laboratory fabricated acetylene sensor of (Lin et al., 2015) are given in Figure 5 (i)–(iv), respectively. The resistance-gas concentration relationships are obtained by extracting data points from the response characteristics given in the data sheet of the respective sensor while the voltage-gas concentration plot is obtained by observing the voltage across the detector for the for the whole range of sensor resistance extracted from the response characteristics. In the figures Rs denotes the sensor resistance while Ro is the resistance of sensor at a particular concentration (say 1,000 ppm) in fresh air. Its value can be determined by calibrating the actual sensors in fresh air. In this experimental study, Ro has been designated a value of 1 KΩ for all the sensors. It can be observed from the plots of all the characteristics that the R-squared values i.e. the regression is very close to 1, thus, indicating a good fit.
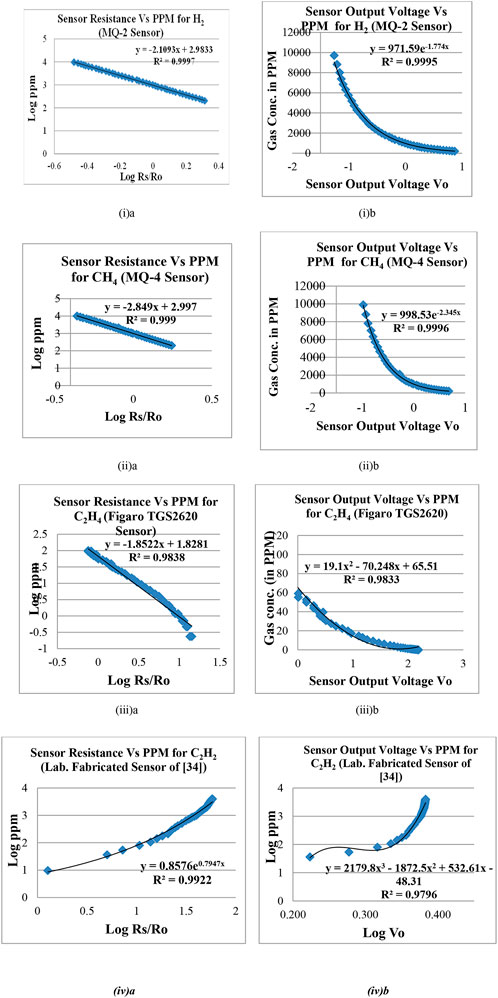
FIGURE 5. (A) Sensitivity characteristics plot and (B) output Voltage-PPM plot- (i) MQ-2 sensor for H2 (ii) MQ-4 sensor for CH4 (iii) Figaro TGS2620 for C2H4 (iv) lab. Fabricated sensor for C2H2 (Lin et al., 2015)
The relation between gas concentration in ppm and the sensor resistance within the detectable concentration range and the relation between the output voltage and gas concentration are given by Eqs 17, 18, respectively for the MQ-2 hydrogen sensor, Eqs 19, 20, respectively for MQ-4 methane sensor, Eqs 21, 22, respectively for ethylene sensor and Eqs 23, 24, respectively for acetylene sensor.
Interface for online transformer incipient fault study
The setup for the simulated E-Nose based online transformer incipient fault identification is given in Figure 6. It can be observed that the sensor array output voltages samples are acquired to host computer using an Arduino Mega 2,560 microcontroller interface. The Arduino Mega 2,560 has an ATmega2,560 microcontroller housed on board that provides adequate clock speed, RAM and analog input channels for the application. The objective of acquiring the data on a computer is to enable a host fault diagnosis algorithm to identify the fault type after calibration of the sensor output voltage.
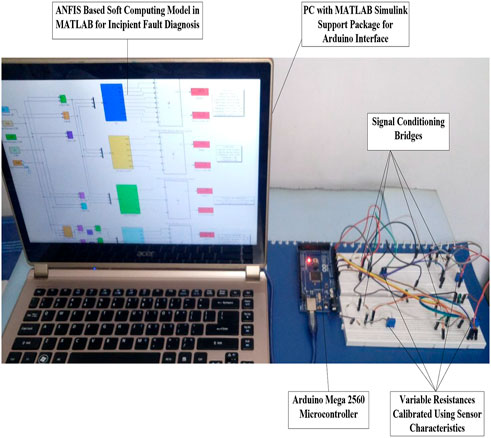
FIGURE 6. Setup for online transformer incipient fault diagnosis using an E-Nose prototype.
In the setup the variable resistances are simulating the actual gas sensors of the E-Nose and are calibrated using their characteristics. The change in gas concentration leads to change in sensor resistance which results in an output voltage appearing across the output terminals of the Wheatstone bridge. The output terminals of the bridges are wired to the analog input of Arduino Mega 2,560. The Simulink model on the host computer needs to acquire this voltage available with the hardware so that after suitable conversion into gas concentration the diagnostic functions can be performed online.
In order to acquire the voltage data from the Arduino hardware a communication interface needs to be setup. Simulink model has been executed in the normal mode as normal mode execution of the simulation model ensures its validation as well as accelerates the process since no code generation or model deployment is required. The Simulink IO that comes with the Simulink support package for Arduino hardware creates a communication link that allows the Simulink model and the IO server on the hardware to communicate among themselves. Figure 7 gives an insight on the interaction between the simulation model and the Arduino hardware in the normal mode with Simulink IO.

FIGURE 7. Communication between host computer and Arduino hardware.
Arduino being a microcontroller-based device are capable of performing the Analog to Digital Conversion (ADC) when the inputs are given to the analog ports on the board of an Arduino Mega 2,560. The output of the ADC is a ratiometric values, proportional to the system voltage. For a 10-bit microcontroller the output of an ADC ranges from 0 to 1,023, where 0 corresponds to an output voltage of 0V while and an ADC output reading of 1,023 would imply 5V output. Hence, a conversion of the ADC readings needs to be done for obtaining output voltages in Volts using a simple relation given in Eq. 25.
Based on this relation the voltage data acquired in the simulation model from Arduino Mega 2,560 is a 10-bit voltage value with a resolution of 0.0048875V.
Online transformer incipient fault detection and classification model
The output from the Arduino Mega after suitable conversion to voltages is used to obtain the gas concentrations in ppm. The conversions to ppm follows the relations obtained from the voltage-ppm curve for each of the sensors. These gas concentrations are used as input to the fault identification algorithm for diagnosing the existing incipient fault. The complete process of the online fault identification model is shown as a flow diagram in Figure 8.
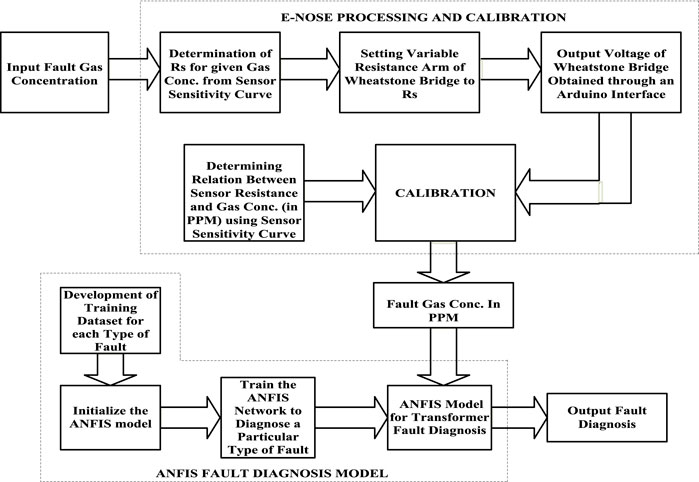
FIGURE 8. Flow diagram of the fault diagnosis process.
The output of the E-Nose in the form of fault gas concentrations obtained after suitable conversion of the output voltages resulting from variation in sensor resistances into gas concentrations in ppm serves as the inputs for the ANFIS based fault diagnosis model. The MATLAB Simulink model to acquire the output voltages and their subsequent conversions into gas concentrations is shown in Figure 9. The fault interpretation model is a composite model comprising ANFIS model of the DT method developed above.
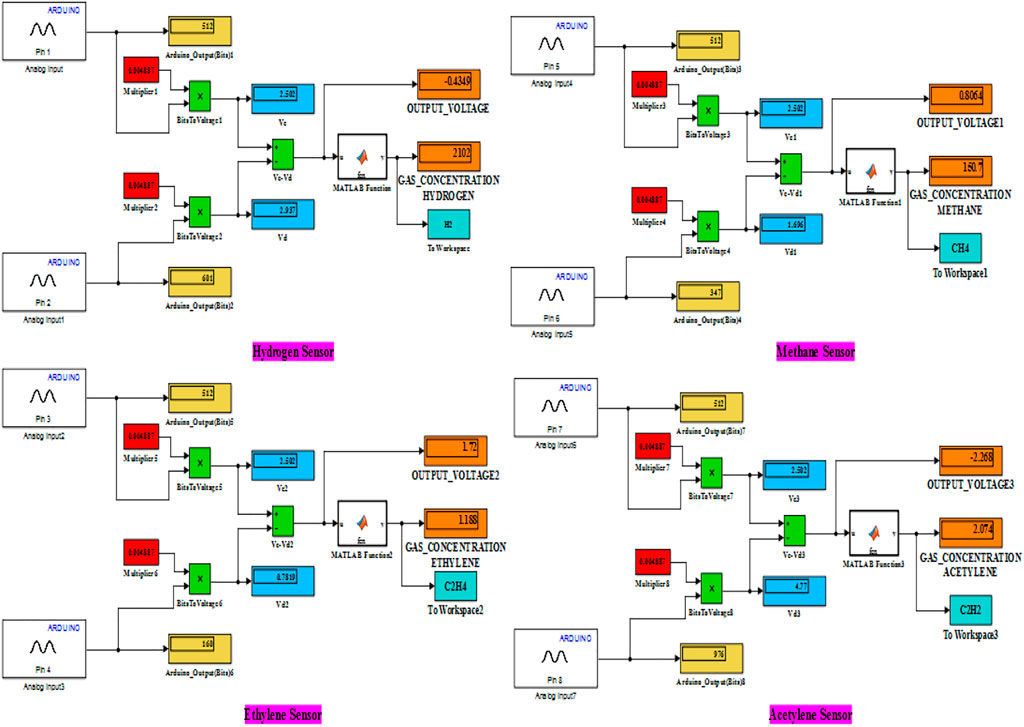
FIGURE 9. MATLAB subsystem for acquiring output voltages and conversion to gas concentration.
And the ANFIS models based on IEC-599 standard, Roger’s ratio method, Doernenberg ratio method as reported in (Khan et al., 2015). The standard fault identification methods, in general, depend on the concentration of five primary gases to recognize the fault condition in the transformer. These gases are namely, hydrogen, methane, ethane, ethylene and acetylene. However, in the prototype for E-Nose based online transformer incipient fault detection method only four sensors have been considered, one each for hydrogen, methane, ethylene and acetylene. The ethane gas concentration has been manually fed in the fault identification process. In the event that an ethane gas sensor with sensing capabilities in the desired gas concentration range is obtained/fabricated, their incorporation would be in a manner similar to the other sensors.
The ANFIS based fault interpreting Simulink model is given in Figure 10.
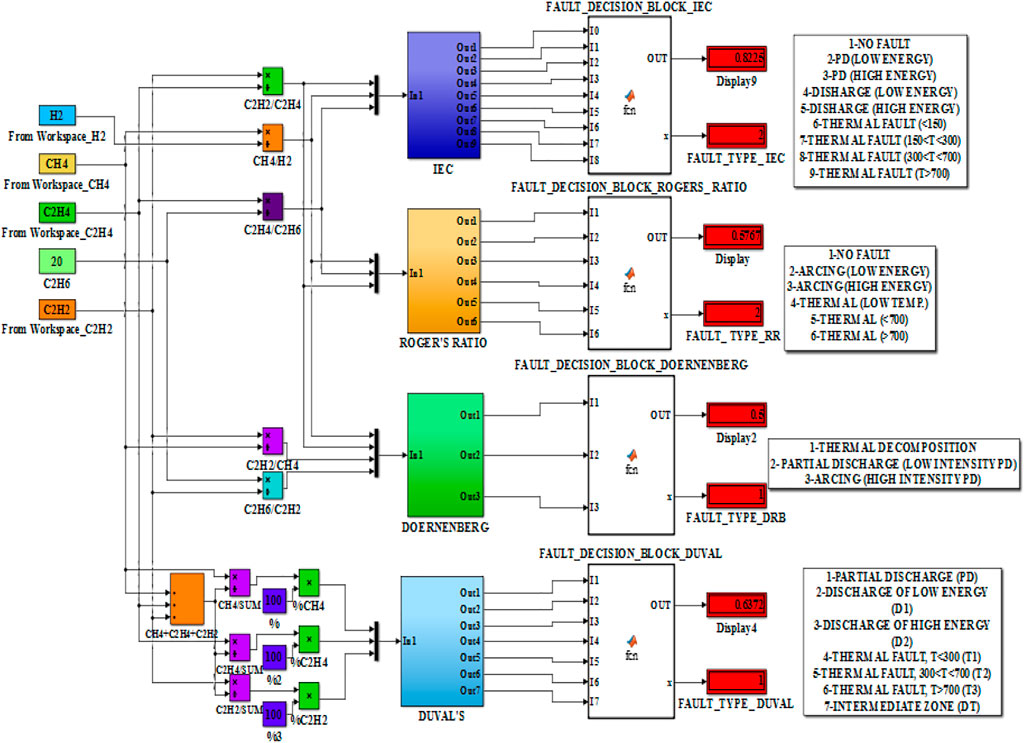
FIGURE 10. ANFIS model for online transformer incipient fault diagnosis.
Result and discussion
The ANFIS model based on the Duval’s triangle method has been tested to identify its diagnostic capability using incipient fault cases from field data of faulty transformers reported in (Duval and DePablo, 2001). The accuracy of the ANFIS model for DT method was determined to be 97%.
The developed setup, simulating an E-Nose, applied for the identification of transformer incipient faults has been also tested using the fault cases reported in (Duval and DePablo, 2001). Since the sensors are limited to operate within a specified gas concentration range, only those fault cases which satisfy these ranges have been selected for testing. These diagnosable cases along with their respective gas concentrations are given in Table 3. These fault cases were diagnosed to check the diagnostic efficiency of the developed online E-Nose system. The sensor resistance for a particular sensor is obtained using the sensitivity characteristics of that sensor by projecting the given gas concentration on the ppm-sensor resistance curve or by using the equation derived from the characteristics.
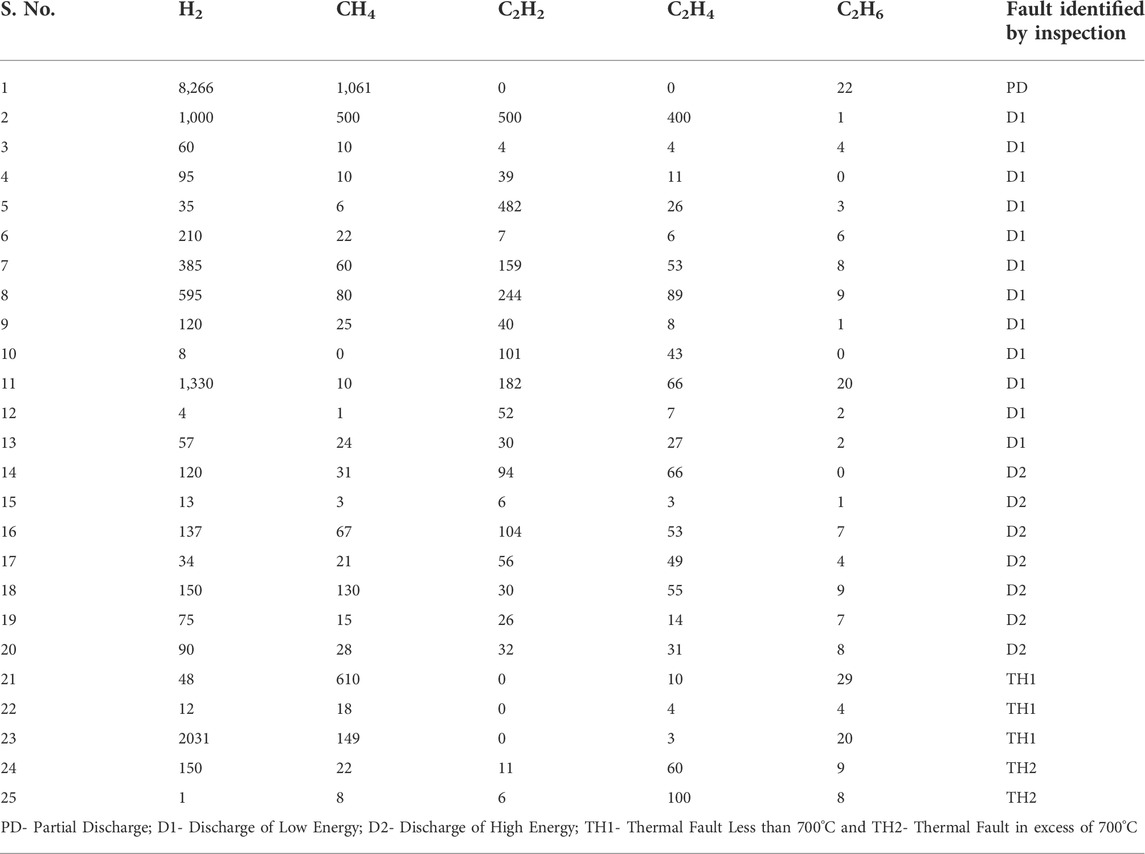
TABLE 3. Transformer fault cases for diagnostic testing of E-Nose model.
The combined diagnosis results for all the fault cases under study are given in Table 4. It is observed that the ANFIS models based on the IEC-599, Roger’s ratio method, Doernenberg method and the Duval’s triangle method have an accuracy of 40%, 44%, 72% and 80%, respectively. Unlike the other fault interpretation models the Duval’s triangle method requires only threes gas inputs i.e. gas concentrations of CH4, C2H4 and C2H2 and they are all acquired from the output of the sensor array prototype.
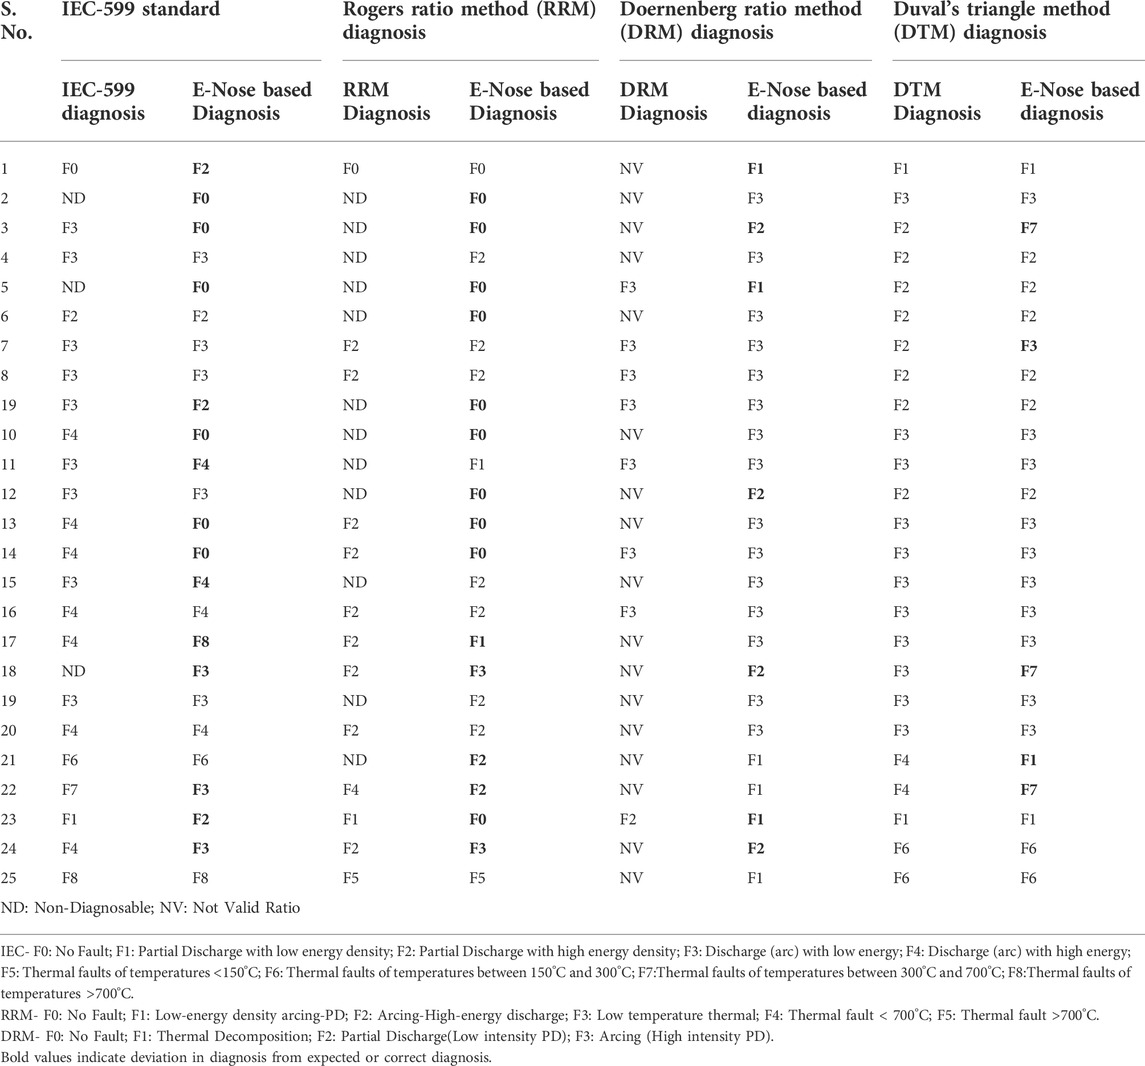
TABLE 4. Transformer fault diagnosis results using the E-Nose setup.
In order to showcase the diagnostic capability of the proposed method a comparison of diagnosis of sample fault cases reported in published works has been shown in Table 5. The cases have been carefully selected to satisfy the ppm limitations of the CH4, C2H2, C2H4 sensors of the E-Nose while the limitations of other gases are ignored as they are insignificant in incipient fault diagnosis by Duval’s method. It can be observed that the ANFIS model of the Duval Triangle method successfully diagnoses all cases while the E-Nose based diagnosis incorrectly diagnoses the high thermal fault in Case 3 as a mix of Thermal Electrical fault.
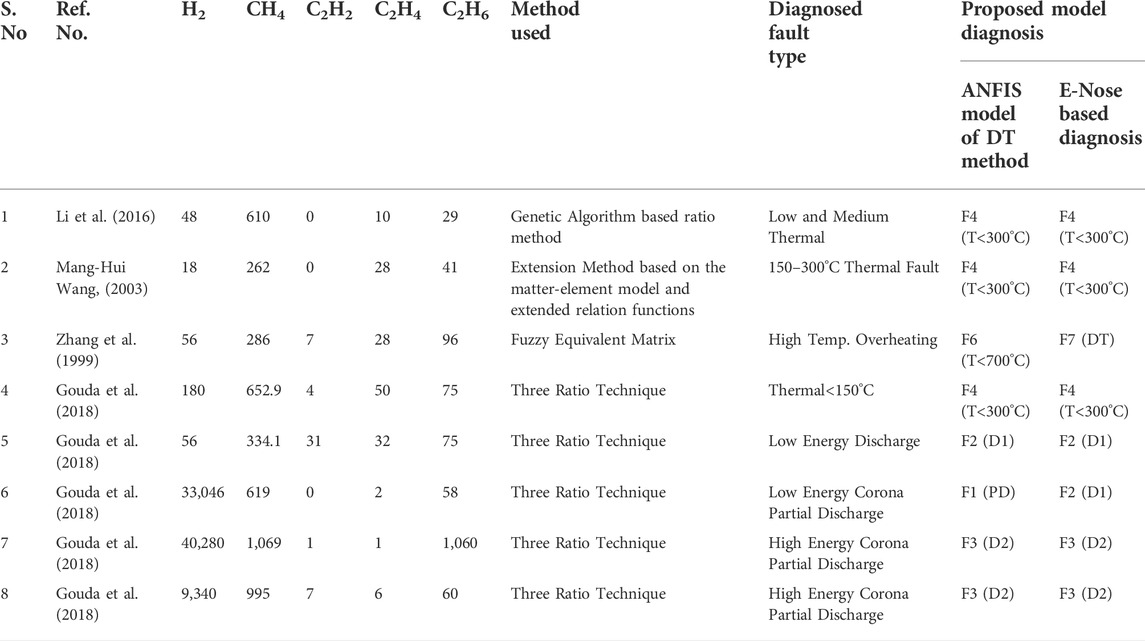
TABLE 5. Comparison of Transformer fault diagnosis with reported results.
Furthermore, the proposed E-Nose based transformer incipient fault model has been tested for the impact in diagnosis due to errors introduced in the measurement of gases, errors in the interfacing devices or due to the conditions in the transformers. Table 6 shows the sample transformer cases of Table 3 being subjected to ±5%, ±10%, ±15% and ±20% errors. The conclusion drawn from the diagnosis is that the even though noises does influence the performance of the model, the E-Nose system along with the ANFIS is able to effectively classify most cases particularly the low ppm fault cases. The faults causing release of higher concentration of fault gases have shown some deviation in their diagnosis.

TABLE 6. Impact of noise on incipient fault diagnosis.
Conclusion
In this work, an online system for transformer incipient fault identification using an E-Nose has been implemented. Actual sensor characteristics have been used to realize the E-Nose by suitably calibrating variable resistances simulating sensors. The Wheatstone bridge is used as a signal conditioning circuit for the sensors. The outputs of the bridges were voltages, equivalent to the sensor output voltages. The prototype model utilized these output voltages to obtain the gas concentration online through an Arduino Mega 2,560 interface. An ANFIS model using the Duval’s Triangle method was developed and used along with ANFIS models of popular interpretation standards were used to arrive upon a fault diagnosis online. The offline testing of the AFIS model based on DT method gave an accuracy of 97%. The selected fault cases in compliance with the detectable concentration range of the sensors, from a fault larger transformer incipient fault database were used to test this online fault diagnosis system. The Duval’s triangle method using three senor output gas concentrations as its input in terms of relative gas concentration, gave an encouraging diagnosis trend with an accuracy of 80% with ample scope to improve upon the accuracy with the elimination of errors. Some errors were introduced in the process of obtaining the gas concentrations due to approximations and using equipment of lesser precision. The accuracy of the setup could certainly be enhanced by using sensors of higher resolution and interfacing equipment lesser prone to errors. Other methods such as IEC-599, Roger’s ratio method and the Doernenberg ratio method had diagnostic efficiencies lower than the Duval’s triangle method. Their performance would also be augmented with the removal of inaccuracies.
This preliminary work does make pathways for a reliable online transformer incipient fault detection model using an actual gas-based sensor array as an E-Nose that could be deployed in the hostile transformer environment. The improvement in the incipient fault diagnosis of transformers can be explored by implementing the incipient fault interpretation methods using machine learning and deep neural network methodologies. The hydrocarbon gas sensors used in the E-Nose can be made more sensitive to a wide range of gas concentration ranging from sub-ppm levels to thousands of ppm. An ethane gas sensor having resolution for an appropriate gas range needs to be fabricated and incorporated into the E-Nose so that gas ratios of all interpretation methods can be obtained from a common setup. Furthermore, better precision is required in interfacing the E-Nose with the online fault identification system so as to obtain gas concentration values closer to the true value and more accurate incipient fault diagnosis can be performed.
Data availability statement
The raw data supporting the conclusion of this article will be made available by the authors, without undue reservation.
Author contributions
All authors listed have made a substantial, direct, and intellectual contribution to the work and approved it for publication.
Conflict of interest
The authors declare that the research was conducted in the absence of any commercial or financial relationships that could be construed as a potential conflict of interest.
Publisher’s note
All claims expressed in this article are solely those of the authors and do not necessarily represent those of their affiliated organizations, or those of the publisher, the editors and the reviewers. Any product that may be evaluated in this article, or claim that may be made by its manufacturer, is not guaranteed or endorsed by the publisher.
References
Author anonymous (2009). IEEE guide for the interpretation of gases generated in oil-immersed transformers, IEEE std. C57.104-2008 (Revision of IEEE std. C57.104-1991). Piscataway: IEEE, 1–36.
Benmahamed, Y., Kherif, O., Teguar, M., Boubakeur, A., and Ghoneim, S. S. M. (2021). Accuracy improvement of transformer faults diagnostic based on DGA data using SVM-BA classifier. Energies 14, 2970. doi:10.3390/en14102970
Dhote, N. K., and Helonde, J. B. (2012). Diagnosis of power transformer faults based on five fuzzy ratio method. WSEAS Trans. Power Syst. 7 (3), 114–125.
Dukarm, J. J. J. (1993). “Transformer oil diagnosis using fuzzy logic and neural networks,” in Proceedings of the Canadian conference on electrical and computer engineering, 14-17 September 1993, Vancouver: Canada.
Duval, M. (2002). A review of faults detectable by gas-in-oil analysis in transformers. IEEE Electr. Insul. Mag. 3, 154–196. doi:10.1109/MEI.2002.1014963
Duval, M., and DePablo, A. (2001). Interpretation of gas-in-oil analysis using new IEC publication 60599 and IEC TC 10 databases. IEEE Electr. Insul. Mag. 17, 31–41. doi:10.1109/57.917529
Duval, M. (1989). Dissolved gas analysis: It can save your transformer. IEEE Electr. Insul. Mag. 5, 22–27. doi:10.1109/57.44605
Duval, M. (2003). New techniques for dissolved gas-in-oil analysis. IEEE Electr. Insul. Mag. 19, 06–15. doi:10.1109/mei.2003.1192031
Equbal, M. D., Khan, S. A., and Islam, T. (2018). Transformer incipient fault diagnosis on the basis of energy-weighted DGA using an artificial neural network. Turk. J. Elec. Eng. Comp. Sci. 26, 77–88. doi:10.3906/elk-1704-229
Gardner, J. W., and Bartlett, P. N. (1994). A brief history of electronic noses. Sensors Actuators B Chem. 18, 210–211. doi:10.1016/0925-4005(94)87085-3
Ghoneim, S. S. M., Farrag, T. A., Rashed, A. A., El-Kenawy, E. M., and Ibrahim, A. (2021). Adaptive dynamic meta-heuristics for feature selection and classification in diagnostic accuracy of transformer faults. IEEE Access 9, 78324–78340. doi:10.1109/access.2021.3083593
Gouda, O. E., El-Hoshy, S. H., and E. L.-Tamaly, H. H. (2018). Proposed three ratios technique for the interpretation of mineral oil transformers based dissolved gas analysis. IET Gener. Transm. &. Distrib. 12, 2650–2661. doi:10.1049/iet-gtd.2017.1927
Gouda, O. E., El-Hoshy, S. H., and Ghoneim, S. S. M. (2021). Enhancing the diagnostic accuracy of DGA techniques based on IEC-TC10 and related databases. IEEE Access 9, 118031–118041. doi:10.1109/access.2021.3107332
Guardado, J. L., Naredo, J. L., Moreno, P., and Fuerte, C. R. (2001). A comparative study of neural network efficiency in power transformers diagnosis using dissolved gas analysis. IEEE Trans. Power Deliv. 16, 643–647. doi:10.1109/61.956751
Hooshmand, R. A., Parastegari, M., and Forghani, Z. (2012). Adaptive neuro-fuzzy inference system approach for simultaneous diagnosis of the type and location of faults in power transformers. IEEE Electr. Insul. Mag. 28, 32–42. doi:10.1109/mei.2012.6268440
Hooshmand, R., and Banejad, M. (2008). Application of fuzzy logic in fault diagnosis in transformers using dissolved gas based on different standards. World Acad. Sci. Engg. Techn 2 (5), 1172–1176. doi:10.5281/zenodo.1076352
Huang, Y., and Sun, H. (2013). Dissolved gas analysis of mineral oil for power transformer fault diagnosis using fuzzy logic. IEEE Trans. Dielectr. Electr. Insul. 20, 974–981. doi:10.1109/tdei.2013.6518967
Interpretation of the analysis of gases in transformers and other oil- filled electrical equipment in service, IEC Publ. 599, 1978.
Khan, S. A., Equbal, M. D., and Islam, T. (2015). A comprehensive comparative study of DGA based transformer fault diagnosis using fuzzy logic and anfis models. IEEE Trans. Dielectr. Electr. Insul. 22, 590–596. doi:10.1109/tdei.2014.004478
Khan, S. A., Equbal, M. D., and Islam, T. (2014). “ANFIS based identification and location of paper insulation faults of an oil immersed transformer,” in Proceedings of the IEEE power India international conference.05-07 December 2014, New Delhi, India.
Khan, S. A., Khan, M. A., Wani, S. A., and Equbal, M. D. (2020). Performance enhancement and extension of DGA based transformer fault diagnosis methods using soft-computing techniques. Soft Computing Condition Monitoring and Diagnostics of Electrical and Mechanical Systems. Adv. Intelligent Syst. Comput. 1096, 287–324.
Kherif, O., Benmahamed, Y., Teguar, M., Boubakeur, A., and Ghoneim, S. S. M. (2021). Accuracy improvement of power transformer faults diagnostic using KNN classifier with decision tree principle. IEEE Access 9, 81693–81701. doi:10.1109/access.2021.3086135
Li, J., Zhang, Q., Wang, K., Wang, J., Zhou, T., and Zhang, Y. (2016). Optimal dissolved gas ratios selected by genetic algorithm for power transformer fault diagnosis based on support vector machine. IEEE Trans. Dielectr. Electr. Insul. 23, 1198–1206. doi:10.1109/tdei.2015.005277
Lin, Y., Li, C., Wei, W., Li, Y., Wen, S., Sun, D., et al. (2015). A new type of acetylene gas sensor based on a hollow heterostructure. RSC Adv. 5, 61521–61527. doi:10.1039/c5ra10327d
Mang-Hui Wang, M.-H. (2003). A novel extension method for transformer fault diagnosis. IEEE Trans. Power Deliv. 18 (1), 164–169. doi:10.1109/tpwrd.2002.803838
Nezami, M. M., Equbal, M. D., Khan, S. A., and Sohail, S. (2021). An ANFIS based comprehensive correlation between diagnostic and destructive parameters of transformer’s paper insulation. Arab. J. Sci. Eng. 46, 1541–1547. doi:10.1007/s13369-020-05180-4
Nezami, M. M., Equbal, M. D., Khan, S. A., Sohail, S., and Ghoneim, S. S. M. (2021). Classification of cellulosic insulation state based on smart life prediction approach (SLPA). Processes 9, 981. doi:10.3390/pr9060981
Noori, M., Effatnejad, R., and Hajihosseini, P. (2017). Using dissolved gas analysis results to detect and isolate the internal faults of power transformers by applying a fuzzy logic method. IET Gener. Transm. &. Distrib. 11, 2721–2729. doi:10.1049/iet-gtd.2017.0028
Rogers, R. R. (1978). IEEE and IEC codes to interpret incipient faults in transformers, using gas in oil analysis. IEEE Trans. Elect. Insul. EI-13, 349–354. doi:10.1109/tei.1978.298141
Singh, S., and Bandyopadhyay, M. N. (2010). Duval triangle: A noble technique for DGA in power transformers. Int. J. Electr. Power Eng. 4, 193–197. doi:10.3923/ijepe.2010.193.197
Singh, S., and Bandyopadhyay, M. N. (2010). Dissolved gas analysis technique for Incipient Fault diagnosis in power transformers: A bibliographic survey. IEEE Electr. Insul. Mag. 26, 41–46. doi:10.1109/mei.2010.5599978
Taha, I. B. M., Ibrahim, S., and Mansour, D. -E. A. (2021). Power transformer fault diagnosis based on DGA using a convolutional neural network with noise in measurements. IEEE Access 9, 111162–111170. doi:10.1109/access.2021.3102415
Vani, A., and Murthy, P. S. C. R. (2014). An adaptive neuro fuzzy inference system for fault detection in transformers by analyzing dissolved gases. IOSR J. Electr. Electron. Engg 9, 07–14. doi:10.9790/1676-09460714
Wani, S. A., Farooque, M. U., Khan, S. A., Gupta, D., and Khan, M. A. (2015). “Fault severity determination in transformers using dissolved gas analysis (DGA),” in Proceedings of the 12th IEEE conference electronics, Energy, environment, communication.New Delhi, India, 17-20 December 2015
Wilson, A. D., and Baietto, M. (2009). Applications and advances in electronic-nose technologies. Sensors 9, 5099–5148. doi:10.3390/s90705099
Wu, Y., Jiang, B., and Wang, Y. (2020). Incipient winding fault detection and diagnosis for squirrel-cage induction motors equipped on CRH trains. ISA Trans. 99, 488–495. doi:10.1016/j.isatra.2019.09.020
Zhang, G., Yasuoka, K., and Ishii, S. (1999). “Application of fuzzy equivalent matrix for fault diagnosis of oil-immersed insulation,” in 13th International Conference on Dielectric Liquids (ICDL’99), Nara, Japan, July 25, 1999, 400–403.
Keywords: E-nose, anfis, duval triangle method, incipient faults, power transformer
Citation: Equbal MD, Nezami MM, Hashem H, Bajaj M, Khurshaid T, Ghoneim SSM and Kamel S (2022) IOT based classification of transformer faults using emerging techniques of E-nose and ANFIS. Front. Energy Res. 10:1020040. doi: 10.3389/fenrg.2022.1020040
Received: 15 August 2022; Accepted: 15 September 2022;
Published: 11 October 2022.
Edited by:
Yongming Han, Beijing University of Chemical Technology, ChinaReviewed by:
Yunkai Wu, Jiangsu University of Science and Technology, ChinaHasmat Malik, University of Technology Malaysia, Malaysia
Copyright © 2022 Equbal, Nezami, Hashem, Bajaj, Khurshaid, Ghoneim and Kamel. This is an open-access article distributed under the terms of the Creative Commons Attribution License (CC BY). The use, distribution or reproduction in other forums is permitted, provided the original author(s) and the copyright owner(s) are credited and that the original publication in this journal is cited, in accordance with accepted academic practice. No use, distribution or reproduction is permitted which does not comply with these terms.
*Correspondence: Tahir Khurshaid, dGFoaXJAeW51LmFjLmty; Salah Kamel, c2thbWVsQGFzd3UuZWR1LmVn