 Ran Chen1
 Xuhui He
 Can Wang
95% of researchers rate our articles as excellent or good
Learn more about the work of our research integrity team to safeguard the quality of each article we publish.
Find out more
ORIGINAL RESEARCH article
Front. Energy Res. , 12 January 2023
Sec. Smart Grids
Volume 10 - 2022 | https://doi.org/10.3389/fenrg.2022.1016754
This article is part of the Research Topic Optimal Energy Management for Electric Vehicles (EVs) by the interface of Vehicle to Grid (V2G), Grid to Vehicle (G2V) and Smart Grid Scheduling View all 7 articles
The occurrence of unintentional islanding will seriously threaten the stable operation of a microgrid (MG). Therefore, detecting the islanding of an microgrid timely is an important premise to ensure the microgrid operates safely and stably. However, the problem of dead zone exists in the traditional islanding detection process because the threshold of various electrical feature quantities of the point of common coupling (PCC) cannot be determined effectively. To solve this problem, an islanding detection method based on CatBoost is proposed for an microgrid. The novelty of this method lies in two aspects: 1) To reduce the error brought by the electrical feature quantities with weak correlation in the process of islanding detection, an analysis method based on the Spearman correlation coefficient is used to extract the electrical feature quantities closely related to islanding detection. 2) To determine the threshold of the electrical feature quantities more accurately and reduce the dead zone of island detection, an integrated learning machine is used to dig out correlations between the electrical feature quantities and the operation of an microgrid. The performance of the proposed islanding detection method is verified based on the modified IEEE13-bus system. The results of the example verify that the proposed islanding detection can achieve higher detection accuracy in cases of grid-connected interference and line faults.
As a new form of power supply that effectively integrates distributed generations (DGs), microgrids (MGs) can promote the development of DGs and improve the consumption capacity of the grid for DGs (Zhang et al., 2022). The power quality in MGs is the key to determining whether MGs can operate stably. When the power quality does not meet the requirements or the power supply is interrupted due to the failure of distribution networks, the DGs will continue to supply the load, thus forming an islanding state of the MGs (Wang et al., 2022a; Liu et al., 2022). After the occurrence of islanding, the DGs should take corresponding control measures to change their inverter control mode, and even implement the corresponding load shedding strategy when the power shortage is serious. Otherwise, the power shortage will lead to voltage and frequency instability in the islanding MG, and the power equipment will be damaged in serious cases (Davari et al., 2021; Wang et al., 2022b).
Effective islanding detection of MGs is key and prerequisite to preventing the delinking of islanding MGs during the process of islanding transition. Therefore, from a safety point of view, the MGs should have the ability of timely islanding detection. At present, the research on islanding detection technology is mainly divided into active islanding detection and passive islanding detection. In (Sivadas and Vasudevan, 2020), an active islanding detection method was proposed for an MG containing multiple inverters operating in parallel. This method realizes accurate identification of islanding mode by constructing a predefined pattern with small periodic steps during the process of islanding detection. In (Gupta et al., 2015), an average absolute frequency deviation value based active islanding detection technique was proposed. This detection method can detect the occurrence of islanding and maintain the stable operation of systems under the condition of small frequency deviation. In (Murugesan et al., 2018), an active islanding detection method based on generator d-axis current disturbance was proposed. This active islanding detection method can quickly detect the occurrence of islanding while maintaining the stable operation of DGs. In (Wen et al., 2016), an impedance-based analysis of the active frequency drift (AFD) islanding detection method was proposed. In this method, the output impedance of the inverter is modeled and the frequency detection unit can accurately judge the occurrence of islanding according to the frequency drift of the inverter. The active islanding detection methods are mainly to inject a disturbance signal into the system and judge whether islanding occurs by using the change of electrical feature quantities caused by the disturbance signal. However, these methods can affect the power quality.
To avoid the impact of the islanding detection process on the power quality of MGs, the passive islanding detection method has been widely studied. In (Seyedi et al., 2021), a new method for islanding detection based on the combination of the rate of change of voltage (ROCOV) and the rate of change of active power (ROCOAP) was proposed. This method overcomes the disadvantage that the traditional passive islanding detection methods may fail when the power mismatch is close to zero. In (Makwana and Bhalja, 2019), an islanding detection method based on the modal component of the voltage signal was proposed. This method can quickly identify the occurrence of islanding under the condition of complete power balance in an MG. In (Bakhshi et al., 2018), an islanding detection method based on the chaos theory was proposed. This method takes the correction frequency at the point of common coupling (PCC) as the input signal of the forced Helmholtz oscillator and determines the threshold of the islanding detection index by using the chaotic motion of the forced Helmholtz oscillator and the obvious change of normal motion. In (Bakhshi-Jafarabadi et al., 2021), a two-level islanding detection method using the rate of change of output voltage and the change of active power output was proposed. This method can achieve independent determination of the threshold and does not adversely affect the output power quality of DGs. However, the passive islanding detection methods rely on the change of the electrical feature quantities of the inverter when the islanding occurs, and there are shortcomings such as detection blind area and low detection accuracy. In addition, the large uncertainty and power volatility of DGs operation will lead to the failure of the passive islanding detection methods in some scenarios.
In recent years, the application of machine learning algorithms in islanding detection has been widely studied. The application of machine learning algorithms can improve the shortcomings of traditional active and passive islanding detection methods, and improve the rationality and efficiency of islanding evaluation. In (Ezzat et al., 2021), a two-stage islanding detection method based on K-nearest neighbor (KNN) was proposed. This method can correctly identify the occurrence of islanding in the presence of noise and has the advantages of high recognition accuracy and short detection time. In (Baghaee et al., 2020), an islanding detection method for photovoltaic power plants based on a support vector machine (SVM) was proposed. This method effectively solves the problem of indistinguishable islanding events and grid fault events in multiple complex scenario tests. In (Kermany et al., 2017), an islanding detection method for MGs with multiple connection points to smart grids was proposed. This method uses artificial neural networks (ANNs) to move the current and voltage measurement locations from the PCC to the distribution network side during the signal processing, thereby reducing the islanding detection time. In (Alshareef et al., 2014), a passive islanding method for DGs based on wavelet design and machine learning was proposed. This method uses the procrustes analysis method to determine the filtering coefficient of the designed wavelet and improves the adaptability of the machine learning algorithm in islanding detection. In (Özcanlı and Özcanlı, 2022), an islanding detection method based on long short-term memory (LSTM) was proposed. The islanding detection method achieves accurate detection of islanding without affecting the power quality and operation stability of the MG. However, the above islanding detection methods do not analyze the correlation between electrical feature quantities at the PCC and the islanding states. The selection of electrical feature quantities at the PCC is closely related to the islanding detection method. If the training samples of the islanding detection method contain irrelevant or weakly correlated electrical feature quantities, feature conflicts and key features will be underestimated, which will affect the accuracy of the islanding detection method.
To solve the above problems, this paper extracts electrical feature quantities with a strong correlation with islanding detection based on the Spearman correlation coefficient. In addition, to effectively determine the threshold of multiple electrical feature quantities and reduce the dead zone in the islanding detection process, an islanding detection method based on CatBoost is proposed for an MG in this paper. This method trains the islanding detection method in the dataset generated by islanding, grid-connected interference, and line fault by CatBoost. It learns to explore the correlation between multiple electrical feature quantities and the operating state of the MG, so as to determine the threshold of electrical feature quantities in the process of islanding detection and realize the accurate detection of islanding. The proposed method can effectively improve the defects of the traditional active and passive islanding detection methods, and improve the accuracy of the islanding detection methods.
The main contributions of this paper are as follows:
1) To reduce the interference of weak correlation electrical feature quantities on the islanding detection method, an islanding state feature extraction method based on the Spearman correlation coefficient is proposed in this paper. By analyzing the correlation between multiple electrical feature quantities and the operating states of an MG, this feature extraction method extracts the electrical feature quantities with a strong correlation with the islanding states. This method can reduce the errors caused by weakly correlated electrical feature quantities in the islanding detection method.
2) To determine the threshold of various electrical feature quantities and reduce the dead zone in the process of islanding detection, an islanding detection method based on CatBoost is proposed for an MG. As an ensemble learner, this method has strong performance in the multidimensional data processing. It can fully learn data sets and determine the threshold of electrical feature quantities to accurately detect islanding.
The islanding detection method proposed in this paper is to judge whether the islanding occurs in the MG according to the electrical feature quantities at the PCC between the MG and the distribution network. The PCC can provide rich instantaneous electrical feature quantities information (Mlakić et al., 2019; Chaitanya et al., 2021). Table 1 shows the common electrical feature quantities that can be used in islanding detection at the PCC. The ideal electrical feature quantities applied to the islanding detection of the MG should be highly correlated with the operation states of the MG and can produce obvious changes before and after the islanding of the MG. At the same time, the ideal electrical feature quantities should be insensitive to faults and power quality disturbances in the MG. Therefore, it is necessary to analyze the correlation between multiple electrical feature quantities at the PCC and the operation states of the MG.
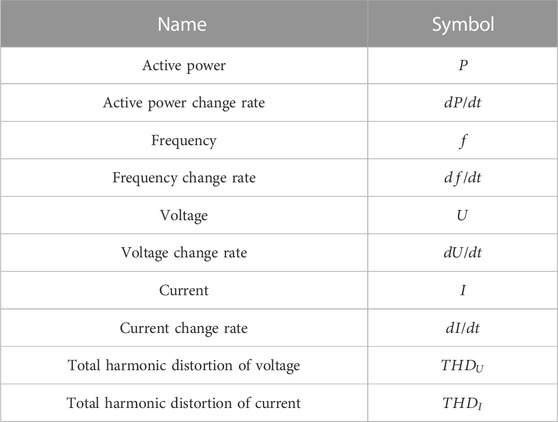
TABLE 1. Multiple electrical feature quantities at PCC.
During islanding detection, the time and complexity of islanding detection will increase dramatically if all the electrical feature quantities in Table 1 are used as the criterion of islanding detection. In addition, the electrical feature quantities at the PCC contain much weak correlation information with islanding detection. The information will affect the judgment of the islanding detection method and bring errors in islanding detection. Therefore, it is necessary to extract the characteristic of relevant electrical feature quantities and dig out the effective information related to islanding detection. In this paper, the Spearman correlation coefficient is used to analyze the correlation between the electrical feature quantities at the PCC and the islanding states, and the electrical feature quantities with a large correlation with the islanding state are extracted. The extracted electrical feature quantities are used as the islanding detection index to improve the efficiency and accuracy of the islanding detection method.
The Spearman correlation coefficient can measure the correlation between two variables (Zhang et al., 2016; Jia et al., 2021). This method can be used to extract the key information for judging the islanding state of the MG, and enhance the mapping relationship between the electrical feature quantities at the PCC and the islanding judgment. The specific steps of the electrical feature quantities correlation analysis based on the Spearman correlation coefficient proposed in this paper are as follows:
Step 1 The electrical feature quantities data set
where k is the
Step 2
Step 3 Each element of the sequence r and the sequence s is subtracted to obtain the rank difference sequence
where
The traditional active and passive islanding detection methods need to manually set the threshold, and there is a certain detection dead zone. The disturbance signals injected by some traditional islanding detection methods will also adversely affect the power quality in the MG. The application of machine learning in islanding detection can improve the defects of traditional active and passive islanding detection methods. Machine learning avoids the manual setting of the thresholds in islanding detection, and can accurately detect the islanding state of an MG by learning various electrical feature quantities measured at the PCC and further determining the thresholds of electrical feature quantities.
The traditional single machine learning algorithms are prone to low precision in multi-feature data processing. The emergence of integrated machine learning algorithms avoids the defects of single machine learning algorithms. As a typical representative algorithm in the integrated machine learning algorithm, CatBoost is developed based on the GBDT framework. CatBoost has a good performance in processing categorical features, gradient deviation, and prediction offset, and can reduce the occurrence of overfitting, thereby improving the accuracy of the algorithm (Samat et al., 2021; Samat et al., 2022).
CatBoost is composed of Categorical and Boosting. By training the weighted training set, several weak learners are formed, and the weight errors are fed back for weight correction. Finally, a strong learner based on several learners is formed. Its structure diagram is shown in Figure 1.
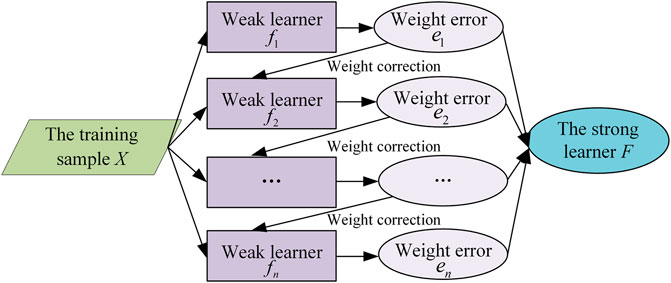
FIGURE 1. Diagram of CatBoost structure.
It is assumed that the observation data set
First, the CatBoost model binaries all numeric features: the tree of oblivious is used as the base predictor to binarize floating-point features, statistics, and one-hot coding.
Second, categorical features are marked as numerical values:
(1) The observed values are randomly arranged to generate multiple random sequences.
(2) For a certain sequence, the average marker values of the training data set are used to mark the categorical features:
where, if
(3) It is assumed that
where, prior value
Finally, when dealing with feature combinations, CatBoost combines with a greedy strategy: 1) The first split of the tree does not combine at all; 2) The second split of the tree combines all the existing combination and classification features in the current tree and all the classification features in the data set. At the same time, the new combined categorical features are converted into numerical features; 3) All the splits selected in the tree are considered categorical features with two values, and are used to generate a combination of numerical features and categorical features.
In the process of overcoming gradient bias, CatBoost constructs a tree in two stages: 1) CatBoost selects the tree structure and calculates the value of leaf nodes after the tree structure is fixed; 2) CatBoost enumerates different splitting methods, and scores the obtained tree by calculating the values of leaf nodes, so as to select the best segmentation. The values of leaf nodes in the two stages are calculated using the approximation of the gradient.
CatBoost synchronizes training data sets and processing categorical features, which greatly improves the efficiency of feature processing. The algorithm for calculating leaf nodes can effectively avoid overfitting and reduce the need for hyperparameter tuning, which makes the model more universal. At the same time, CatBoost binaries floating-point features, statistics and one-hot encoded features, and achieves binarization of model output in the scoring process.
The islanding detection method based on CatBoost in this paper mainly includes sample construction, weak learner generation, loss function gradient determination, and final strong learner generation. The specific contents are as follows:
1) Sample set construction
Firstly, data set
2) Generation of weak learner
After constructing the sample set, the initial weak learner
where
3) Loss function gradient determination
The negative gradient of the loss function for the
For each sample input
4) Generation of the final strong learner
The proposed islanding detection method uses a symmetric tree as the basic predictor. In this type of tree, the same partitioning criterion is used on the entire level of the tree. This tree is balanced and less prone to overfitting. In a symmetric tree, the index of each leaf node can be encoded as a binary vector of length equal to the depth of the tree, and the evaluation result is calculated by using binary features during prediction. The strong learner formed after
After the strong learner in the
The electrical feature quantities at the PCC under various operation scenarios of an MG are taken as the input, and the islanding label of the MG is taken as the output. The flow chart of the proposed islanding detection method is shown in Figure 2, and the detailed steps of the islanding detection are as follows:
1) The hyperparameters of CatBoost and fault events are initialized.
2) The Spearman correlation coefficient analysis method is used to extract the islanding strong correlation electrical feature quantities at the PCC of the MG under fault events.
3) The data of islanding strong correlation electrical feature quantities at the PCC is input to the pre-trained CatBoost model.
4) Each weak learner in the CatBoost model gives its own islanding decision result of the MG.
5) The strong learner generated by the training of CatBoost model gets the final decision of islanding detection according to the weight of each weak learner.
6) The islanding event label is output.
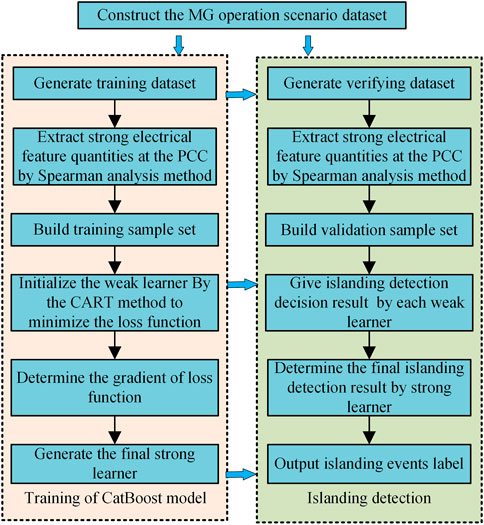
FIGURE 2. Flow chart of the proposed islanding detection method.
The setting of the samples can determine the learning result of the machine learning algorithm and then affect the islanding detection accuracy. To include the operation situations of MGs in grid-connected and islanded states as much as possible, a modified IEEE 13-bus system shown in Figure 3 is built based on MATLAB/Simulink in this paper. All tests are conducted on a computer equipped with Intel(R) Core(TM) i5-7500, which operates at 3.40 GHz and is equipped with 16 GB of running memory. The test system contains 4 DGs and 6 loads. In the system, the AC power grid is a three-phase power supply. The line voltage and DC bus voltage are 380 and 600 V respectively. The frequency is 50 Hz. The data information of DGs and loads are shown in Table 2. The parameter Settings of the CatBoost model are shown in Table 3.
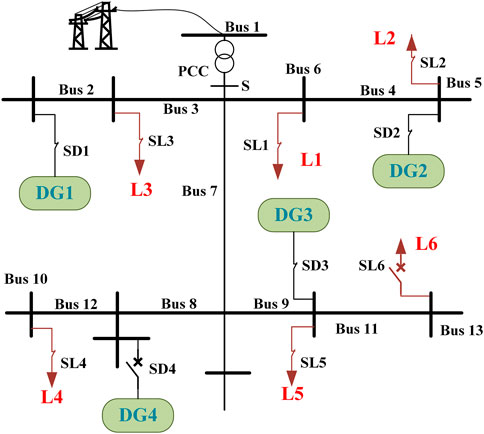
FIGURE 3. MG model based on a modified IEEE 13-bus system.
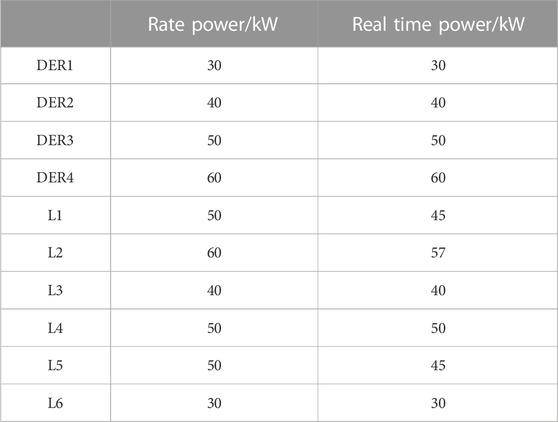
TABLE 2. Data information of DGs and loads.
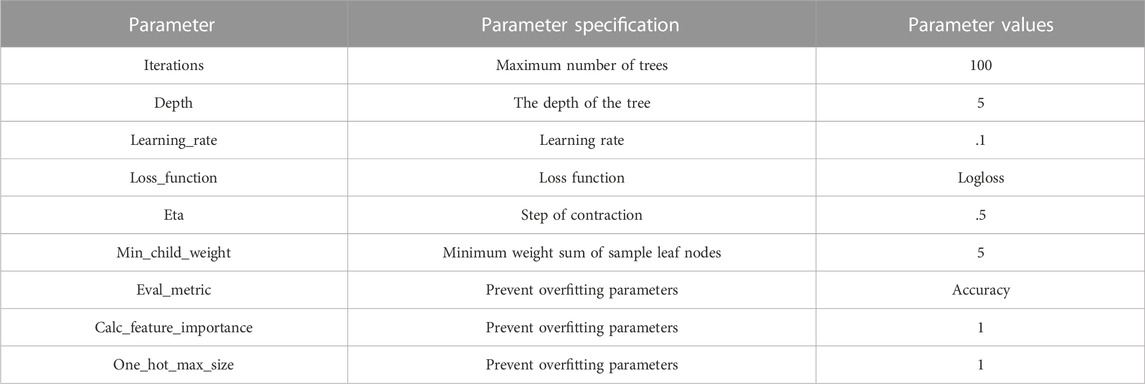
TABLE 3. The parameters of CatBoost model.
To train and detect the proposed islanding detection method more comprehensively, and reduce the interference of different operation states of MGs on islanding detection, this paper comprehensively considers the switching of DGs and loads in the islanding scenario and the grid-connected scenario. At the same time, the short-circuit and open-circuit faults of transmission lines are also considered in the case of MG grid-connected mode. Various simulated events are shown in Table 4. In addition, to more comprehensively reflect the different operating states of MGs, the power imbalance in the MG is considered on the basis of the above state settings (Faqhruldin et al., 2014).
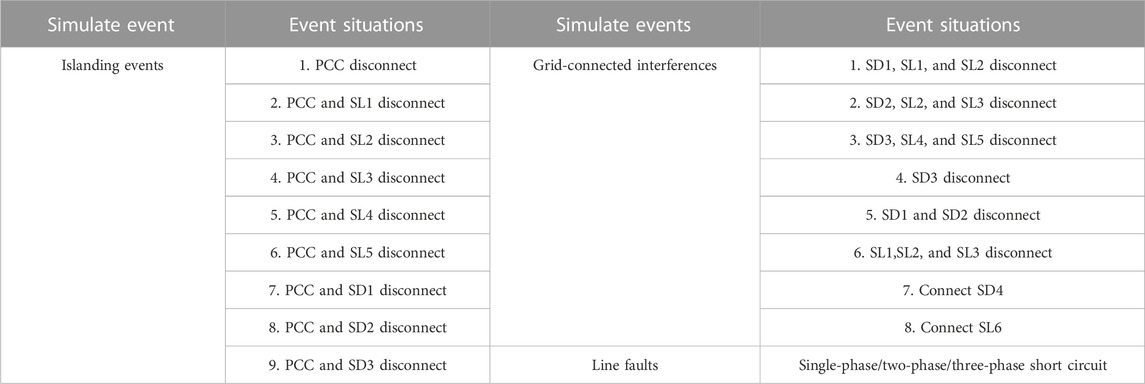
TABLE 4. MG different state settings.
This paper comprehensively considers the islanding events, grid-connected interference events, and line fault events shown in Table 3. In the range
In the constructed 396 sets of data, the Spearman correlation coefficient is used to analyse the correlation between the islanding state and the electrical feature quantities at the PCC. The Spearman correlation coefficient analysis results are shown in Figure 4.
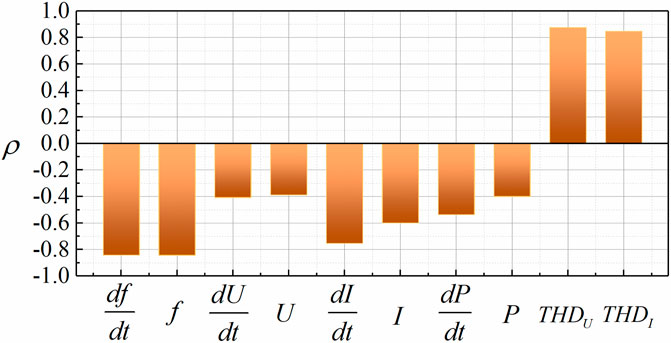
FIGURE 4. Spearman correlation coefficient between each electrical quantity and MGs state.
According to the correlation strength classification criteria in Table 5, the absolute value
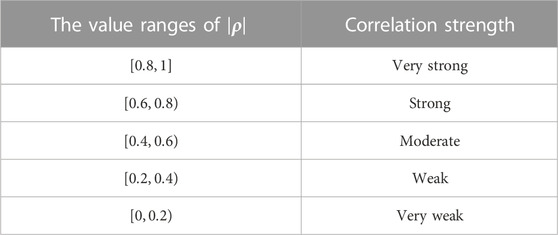
TABLE 5. Correlation strength classification.
In the cases of islanding events, grid-connected interference events and line faults are extracted to obtain electrical eigenvalues for islanding detection, which together with the islanding state constitute the training samples of the islanding detection method. To verify the performance of the proposed islanding detection method based on CatBoost, this paper compares the proposed islanding detection method with three different islanding detection methods. Comparison method 1 is the islanding detection method based on K-nearest neighbor (KNN) (Ezzat et al., 2021), comparison method 2 is the islanding detection method based on a support vector machine (SVM) (Baghaee et al., 2020), and comparison method 3 is the islanding detection method based on artificial neural network (ANN) (Kermany et al., 2017). In addition, the accuracy, F-measure, and AUC value indicators are selected as the evaluation indicators of the islanding detection method (Xia et al., 2022). The values of accuracy, F-measure, and AUC represent the reliability and accuracy of the islanding detection method, and the closer the value is to 1, the higher the reliability of the islanding detection method.
To verify the reliability of the islanding detection method and the influence of feature extraction on the islanding detection method, a comparative analysis of different detection methods is carried out in the two cases of feature extraction and no feature extraction in this paper. At the same time, to ensure that the sample proportions of islanding events and grid-connected interference events in the training set and validation set are consistent with the full set of samples, stratified proportional sampling is used to divide the total sample set into a sample set A and a sample set B according to the ratio of .7:.3. The proposed islanding detection method, comparison method 1, comparison method 2, and comparison method 3 are trained by taking sample set A as the training sample set. Sample set B is used as the verification sample to verify the performance of the islanding detection methods trained by sample set A. The accuracy, F-measure, and AUC values of the proposed islanding detection method, comparison method 1, 2, and 3 based on sample set B are shown in Figures 5–7.
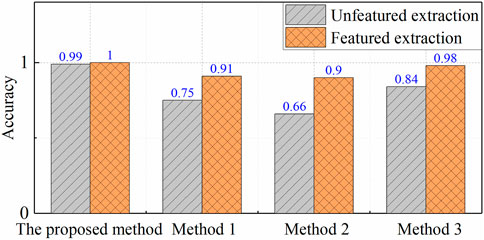
FIGURE 5. Accuracy of four islanding detection methods.
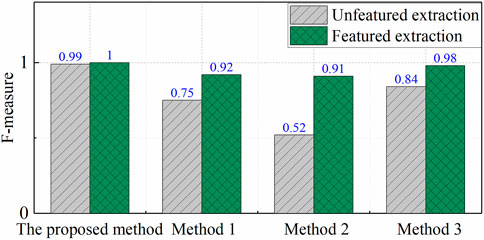
FIGURE 6. F-measure of four islanding detection methods.
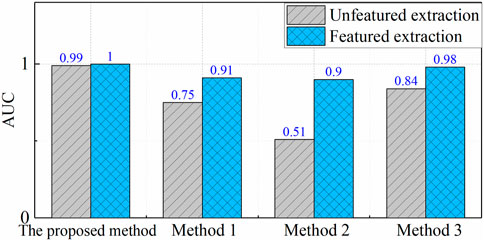
FIGURE 7. AUC of four islanding detection methods.
When there is no feature extraction and the four islanding detection methods detect the islanding state based on 10 electrical feature quantities, the values of accuracy, F-measure, and AUC of the proposed method, comparison methods 1, 2, and 3 are shown in Figures 5–7, respectively. The accuracy, F-measure, and AUC values obtained by comparison method 1 are all below .8. These values obtained by comparison method 2 are all below .7, and the F-measure and AUC values are even around .5. These values obtained by comparison method 3 are all below .9. These values obtained by the proposed method all reach .99. When judging the islanding state based on 10 electrical feature quantities, the proposed islanding detection method is significantly better than comparison methods 1, 2, and 3. However, the accuracy, F-measure, and AUC values obtained by the four islanding detection methods do not reach 1, which shows that the four islanding detection methods fail to accurately judge the islanding state of the MGs without feature extraction.
After using the Spearman correlation coefficient to extract the characteristics of electrical feature quantities, five electrical feature quantities which have a strong correlation with the islanding state of the MG are extracted from the original 10 electrical feature quantities. By analyzing the islanding detection results before and after feature extraction, it can be concluded that the values of accuracy, F-measure, and AUC of comparison method 1 are increased by 16%, 17%, and 16% respectively by using the Spearman correlation coefficient to extract the electrical feature quantities. The values of accuracy, F-measure, and AUC of comparison method 2 are increased by 24%, 39%, and 39% respectively. The values of accuracy, F-measure, and AUC of comparison method 3 are all increased by 14%. In particular, the values of accuracy, F-measure, and AUC obtained by the proposed islanding detection method are all increased from .99 to 1, which realizes the error-free detection of the islanding state. This is because after using the Spearman correlation coefficient for feature extraction, features weakly correlated with the MG state are eliminated, and key features with a strong correlation in the process of islanding detection are retained. Feature extraction reduces the errors caused by electrical feature quantities with weak correlation in the process of islanding detection, weakens the over-fitting phenomenon, and improves the accuracy of the islanding detection method.
By analyzing the performance of different detection methods after feature extraction, it can be seen that the values of accuracy and AUC obtained by the proposed method are 9%, 10%, and 2% higher than that obtained by comparison method 1, 2, and 3, respectively. The F-measure of the proposed islanding detection method is 8%, 9%, and 2% higher than that obtained by comparison methods 1, 2, and 3, respectively. This is because islanding detection is a complex process involving a variety of electrical feature quantities. KNN, SVM, and ANN have limited ability to fit and judge the complex electrical variables at the PCC in the islanding MG, and cannot fully learn the correlation between the MG operation states and the electrical feature quantities. The proposed islanding detection method is based on the integrated learner, which can give full play to the advantages of weak learners in the diversity of structure and parameters, and can fully mine the rules contained in complex electrical feature quantities in data training. Therefore, compared to comparison methods 1, 2, and 3, the proposed islanding detection method has higher detection accuracy and performance.
To further verify the performance reliability and superiority of the proposed islanding detection method, all samples in islanding events and grid-connected interference events are combined into a new sample set A, and all samples in islanding events and line fault events are combined into a new sample set B in this case. In addition, all samples in islanding events, grid connection interference events, and line fault events are divided into sample set C and sample set D by stratified proportional sampling method in the ratio of .5:.5. The proposed method, the comparison method 1, 2, and 3 are trained based on sample sets A, B, C, and D, respectively. The accuracy rate accuracy, F-measure, and AUC values of the proposed islanding detection method, comparison methods 1, 2, and 3 are tested. In this case, four scenarios are set as follows:
Scenario 1: According to the ratio of .6:.4, sample set A is divided into a training set and validation set by the stratified proportional sampling method to verify the performance of different islanding detection methods under grid-connected interference.
Scenario 2: According to the ratio of .6:.4, sample set B is divided into a training set and validation set by the stratified proportional sampling method to verify the performance of different islanding detection methods under grid-connected interference.
Scenario 3: The proposed islanding detection method, the comparison method 1, 2, and 3 are trained by sample set C. Sample set D is used as the verification set to test the islanding detection methods trained by sample set C.
Scenario 4: The proposed islanding detection method, comparison methods 1, 2, and 3 are trained by sample set D. Sample set C is used as the verification set to test the islanding detection methods trained by sample set D.
The accuracy values of the proposed islanding detection method, comparison methods 1, 2, and 3 in four scenarios are shown in Figure 8, the F-measure is shown in Figure 9, and the AUC values are shown in Figure 10. From Figures 8–10, it can be seen that in the verification of the four test scenarios, the proposed method is significantly better than the comparison methods 1, 2, and 3 in the three evaluation indicators of accuracy, F-measure, and AUC values on the validation samples. In scenario 1, the accuracy and AUC values obtained by the proposed islanding detection method are 10%, 7%, and 3% higher than those of comparison methods 1, 2, and 3, respectively. The F-measure value obtained by the proposed islanding detection method are 10%, 7%, and 4% higher than those of comparison methods 1, 2, and 3, respectively. In scenario 2, the accuracy and F-measure values obtained by the proposed islanding detection method are 1% higher than those of comparisons 1, 2, and 3. The AUC value obtained by the proposed islanding detection method are 1%, 2%, and 2% higher than those of comparison methods 1, 2, and 3, respectively. The data shows that compared with comparison methods 1, 2, and 3, the proposed islanding detection method has a higher detection accuracy in the presence of grid-connected interference and line faults.
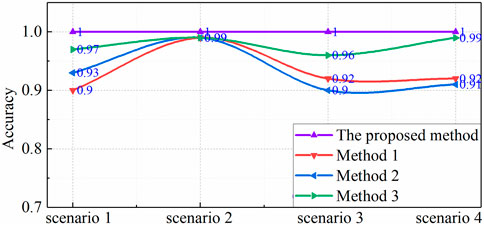
FIGURE 8. Accuracy of four islanding detection methods in four scenarios.
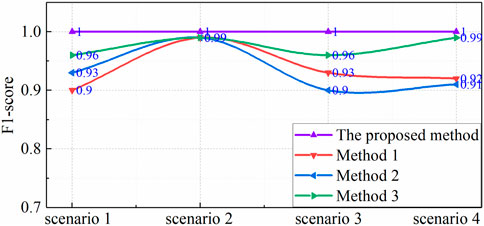
FIGURE 9. F-measure of four islanding detection methods in four.
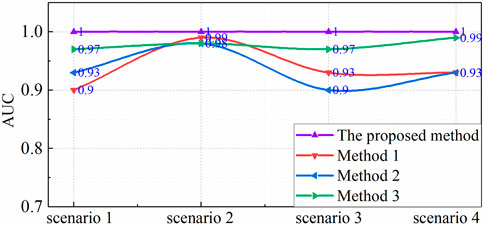
FIGURE 10. AUC of four islanding detection methods in four scenarios scenarios.
In the cross-validation of scenario 3 and scenario 4, with the increase in the complexity of the composition of the test samples, the three evaluation indexes of accuracy, F-measure, and AUC values obtained by comparison methods 1, 2, and 3 fluctuated greatly, and the values ranged from .9 to .99. On the contrary, the proposed islanding detection method is relatively stable in the three evaluation indexes of accuracy, F-measure, and AUC values, and the values all reach 1. This data shows that the proposed islanding detection method can detect islanding more accurately for complex verification samples in the presence of grid connection interference and line fault. In four different scenarios, the proposed islanding detection method can accurately detect islanding and non-islanding states. In addition, compared with the comparison methods 1, 2, and 3, the proposed islanding detection method can better detect islanding correctly under different sample compositions. They have a large leading amplitude, which fully shows that compared with the traditional single machine learning algorithm, the proposed islanding detection method gives full play to the advantages of the integrated learner in the multidimensional data processing. The data set can be fully learned to determine the threshold value of electrical feature quantities in the process of islanding detection and has higher detection accuracy.
To determine the threshold value of various electrical feature quantities, reduce the dead zone in the process of islanding detection, and then realize the accurate detection of islanding, an islanding detection method based on CatBoost is proposed. The method realizes the accurate islanding detection of the MGs by deep excavating the electrical feature quantities at the PCC. Compared with existing methods, the proposed islanding detection method has the following advantages:
1) The proposed islanding detection method uses the Spearman correlation coefficient to extract the features of the electrical feature quantities at the PCC, reducing the error caused by the electrical feature quantities with weak correlation in the islanding detection process.
2) The proposed islanding detection method can more accurately determine the threshold of electrical feature quantities and reduce the dead zone of islanding detection.
3) The proposed islanding detection method can avoid the interference caused by grid-connected interference and line faults, and has higher islanding detection accuracy.
The raw data supporting the conclusion of this article will be made available by the authors, without undue reservation.
RC, LZ, CX, HX, and ZZ performed the main data analysis and wrote the paper. XH and QD supervised the research activities and reviewed the paper. CW contributed to the discussion. All authors reviewed the manuscript.
This work was supported by the Science and Technology Program of State Grid Hubei Electric Power Co., Ltd. under Grant B31538221024.
The authors declare that this study received funding from the Science and Technology Program of State Grid Hubei Electric Power Co., Ltd. The funder had the following involvement in the study: design, collection, analysis, interpretation of data, the writing of this article, and the decision to submit it for publication.
All claims expressed in this article are solely those of the authors and do not necessarily represent those of their affiliated organizations, or those of the publisher, the editors and the reviewers. Any product that may be evaluated in this article, or claim that may be made by its manufacturer, is not guaranteed or endorsed by the publisher.
Alshareef, S., Alshareef, S., and Alshareef, W. G. (2014). A new approach based on wavelet design and machine learning for islanding detection of distributed generation. IEEE Trans. Smart Grid 5, 1575–1583. doi:10.1109/tsg.2013.2296598
Baghaee, H. R., Baghaee, D., Nikolovski, S., and Dragicević, T. (2020). Support vector machine-based islanding and grid fault detection in active distribution networks. IEEE Trans. Emerg. Sel. Top. Power Electron 8, 2385–2403. doi:10.1109/jestpe.2019.2916621
Bakhshi, M., Noroozian, R., and Gharehpetian, G. B. (2018). Novel islanding detection method for multiple DGs based on forced Helmholtz oscillator. IEEE Trans. Smart Grid 9, 6448–6460. doi:10.1109/tsg.2017.2712768
Bakhshi-Jafarabadi, R., Sadeh, J., Sadeh, J. d. J., and Popov, M. (2021). Two-level islanding detection method for grid-connected photovoltaic system-based microgrid with small non-detection zone. IEEE Trans. Smart Grid 12, 1063–1072. doi:10.1109/tsg.2020.3035126
Chaitanya, B. K., Yadav, A., and Pazoki, M. (2021). Reliable islanding detection scheme for distributed generation based on pattern-recognition. IEEE Trans. Ind. Inf. 17, 5230–5238. doi:10.1109/tii.2020.3029675
Davari, M., Gao, W., Jiang, Z. -P., and Lewis, F. L. (2021). An optimal primary frequency control based on adaptive dynamic programming for islanded modernized microgrids. IEEE Trans. Autom. Sci. Eng. 18, 1109–1121. doi:10.1109/tase.2020.2996160
Ezzat, A., Ezzat, B. E., and Abdelsalam, A. A. (2021). Microgrids islanding detection using Fourier transform and machine learning algorithm. Electr. Power Syst. Res. 196, 107224. doi:10.1016/j.epsr.2021.107224
Faqhruldin, O. N., El-Saadany, E. F., and Zeineldin, H. H. (2014). A universal islanding detection technique for distributed generation using pattern recognition. IEEE Trans. Smart Grid 5, 1985–1992. doi:10.1109/tsg.2014.2302439
Gupta, P., Bhatia, R. S., and Jain, D. K. (2015). Average absolute frequency deviation value based active islanding detection technique. IEEE Trans. Smart Grid. 6, 26–35. doi:10.1109/tsg.2014.2337751
Jia, K., Yang, Z., Zheng, L., Zhu, Z., and Bi, T. (2021). Spearman correlation-based pilot protection for transmission line connected to PMSGs and DFIGs. IEEE Trans. Ind. Inf. 17, 4532–4544. doi:10.1109/tii.2020.3018499
Kermany, S. D., Kermany, M., Deilami, S., and Masoum, M. A. S. (2017). Hybrid islanding detection in microgrid with multiple connection points to smart grids using fuzzy-neural network. IEEE Trans. Power Syst. 32, 2640–2651. doi:10.1109/tpwrs.2016.2617344
Liu, C., Wang, W., Wang, Z., Chen, S., Su, P., Gao, H., et al. (2022). Optimal operation and locating method of new energy building with shared charging service. Front. Energy Res. 10, 865060. doi:10.3389/fenrg.2022.865060
Makwana, Y. M., and Bhalja, B. R. (2019). Experimental performance of an islanding detection scheme based on modal components. IEEE Trans. Smart Grid 10, 1025–1035. doi:10.1109/tsg.2017.2757599
Mlakić, D., Baghaee, H. R., and Nikolovski, S. (2019). Gibbs phenomenon-based hybrid islanding detection strategy for VSC-based microgrids using frequency shift, $THD_{U}$, and $RMS_{U}$. IEEE Trans. Smart Grid 10, 5479–5491. doi:10.1109/tsg.2018.2883595
Murugesan, S., Murali, V., and Daniel, S. A. (2018). Hybrid analyzing technique for active islanding detection based on <italic>d</italic>-Axis current injection. IEEE Syst. J. 12, 3608–3617. doi:10.1109/jsyst.2017.2730364
Özcanlı, A. K., and Özcanlı, M. (2022). A novel Multi-LSTM based deep learning method for islanding detection in the microgrid. Electr. Power Syst. Res. 202, 107574. doi:10.1016/j.epsr.2021.107574
Samat, A., Li, E., Du, P., Liu, S., Miao, Z., and Zhang, W. (2022). CatBoost for RS image classification with pseudo label support from neighbor patches-based clustering. IEEE Geosci. Remote. Sens. Lett. 19, 1–5. doi:10.1109/lgrs.2020.3038771
Samat, A., Li, E., Du, P., Liu, S., and Xia, J. (2021). GPU-accelerated CatBoost-forest for hyperspectral image classification via parallelized mRMR ensemble subspace feature selection. IEEE J. Sel. Top. Appl. Earth Obs. Remote Sens. 14, 3200–3214. doi:10.1109/jstars.2021.3063507
Seyedi, M., Taher, S. A., Ganji, B., and Guerrero, J. (2021). A hybrid islanding detection method based on the rates of changes in voltage and active power for the multi-inverter systems. IEEE Trans. Smart Grid 12, 2800–2811. doi:10.1109/tsg.2021.3061567
Sivadas, D., and Vasudevan, K. (2020). An active islanding detection strategy with zero nondetection zone for operation in single and multiple inverter mode using GPS synchronized pattern. IEEE Trans. Ind. Inf. 67, 5554–5564. doi:10.1109/tie.2019.2931231
Wang, C., Chu, S., Ying, Y., Wang, A., Chen, R., Xu, H., et al. (2022). Underfrequency load shedding scheme for islanded microgrids considering objective and subjective weight of loads. IEEE Trans. Smart Grid., 1. doi:10.1109/TSG.2022.3203172
Wang, C., Chu, S., Yu, H., Ying, Y., and Chen, R. (2022). Control strategy of unintentional islanding transition with high adaptability for three/single-phase hybrid multimicrogrids. Int. J. Electr. Power Energy Syst. 136, 107724. doi:10.1016/j.ijepes.2021.107724
Wen, B., Boroyevich, D., Burgos, R., Shen, Z., and Mattavelli, P. (2016). Impedance-based analysis of active frequency drift islanding detection for grid-tied inverter system. IEEE Trans. Ind. Appl. 52, 332–341. doi:10.1109/tia.2015.2480847
Xia, X., Xiao, Y., Liang, W., and Cui, J. (2022). Detection methods in smart meters for electricity thefts: A survey. Proc. IEEE Inst. Electr. Electron Eng. 110, 273–319. doi:10.1109/jproc.2021.3139754
Zhang, R., Li, G., Bu, S., Kuang, G., He, W., Zhu, Y., et al. (2022). A hybrid deep learning model with error correction for photovoltaic power forecasting. Front. Energy Res. 10, 948308. doi:10.3389/fenrg.2022.948308
Zhang, W., Wei, Z., Wang, B., and Han, X. (2016). Measuring mixing patterns in complex networks by Spearman rank correlation coefficient. Phys. A 451, 440–450. doi:10.1016/j.physa.2016.01.056
Zhao, G., Ding, W., Tian, J., Liu, J., Gu, Y., Shi, S., et al. (2022). Spearman rank correlations analysis of the elemental, mineral concentrations, and mechanical parameters of the lower cambrian niutitang shale: A case study in the fenggang block, northeast guizhou Province, south China. J. Pet. Sci. Eng. 208, 109550. doi:10.1016/j.petrol.2021.109550
Keywords: islanding detection, electrical quantities, CatBoost, microgrid, correlation
Citation: Chen R, Zhou L, Xiong C, Xu H, Zhang Z, He X, Dong Q and Wang C (2023) Islanding detection method for microgrids based on CatBoost. Front. Energy Res. 10:1016754. doi: 10.3389/fenrg.2022.1016754
Received: 11 August 2022; Accepted: 29 December 2022;
Published: 12 January 2023.
Edited by:
Yimin Zhou, Shenzhen Institutes of Advanced Technology (CAS), ChinaReviewed by:
Srikanth Goud B., Anurag Group of Institutions, IndiaCopyright © 2023 Chen, Zhou, Xiong, Xu, Zhang, He, Dong and Wang. This is an open-access article distributed under the terms of the Creative Commons Attribution License (CC BY). The use, distribution or reproduction in other forums is permitted, provided the original author(s) and the copyright owner(s) are credited and that the original publication in this journal is cited, in accordance with accepted academic practice. No use, distribution or reproduction is permitted which does not comply with these terms.
*Correspondence: Can Wang, eGZjYW5jYW5AMTYzLmNvbQ==
Disclaimer: All claims expressed in this article are solely those of the authors and do not necessarily represent those of their affiliated organizations, or those of the publisher, the editors and the reviewers. Any product that may be evaluated in this article or claim that may be made by its manufacturer is not guaranteed or endorsed by the publisher.
Research integrity at Frontiers
Learn more about the work of our research integrity team to safeguard the quality of each article we publish.