 Hengjie Li
 Daming Liang
 Yun Zhou
 Yiwei Shi
 Donghan Feng2
95% of researchers rate our articles as excellent or good
Learn more about the work of our research integrity team to safeguard the quality of each article we publish.
Find out more
ORIGINAL RESEARCH article
Front. Energy Res. , 09 January 2023
Sec. Smart Grids
Volume 10 - 2022 | https://doi.org/10.3389/fenrg.2022.1013154
This article is part of the Research Topic Flexibility Analysis and Regulation Technology of Clean Energy System View all 17 articles
As the number of urban electric vehicles continues to increase, accurate prediction of the electric vehicle (EV) spatial and temporal distribution charging demand is of great importance for safely operating the power grid. Due to the uncertainty and variability of EV user charging and discharging strategies, the strategic factors behind user behavior become the key to influencing whether the charging demand prediction results are reasonable. As a result, this paper proposes a charging demand prediction model based on real-time data from Baidu map that can interpret EV user driving strategies and charging strategies based on the strategy learning capability of generative adversarial imitation learning. This paper first analyzes the correlation between strategy factors and SOC in user charging and discharging data, then describes establishing a 24-hour SOC prediction model for a single vehicle, and finally discusses building a spatiotemporal model of charging demand in the region on this basis. The results demonstrate that, while it can be combined with real-time traffic data, the method has better prediction accuracy and robustness compared with the current mainstream prediction methods and high application value.
In recent years, in order to reduce dependence on oil and fossil fuels, a number of countries and regions have developed policies to promote the development and market penetration of electric vehicles. Global electric vehicle sales reached 6.75 million units in 2021, an increase of 108% over 2020, while the global share of electric vehicles in global light vehicle sales was 8.3% compared to 4.2% in 2020 (EV volumes.com, 2021). The continued growth of scaled EV charging loads connected to the grid will certainly bring challenges to urban road traffic, as well as to the stable operation of the grid. Currently, research on EVs focuses on charging demand prediction, energy management and charging guidance, which can help reduce the negative impacts of EVs on the grid, where EV charging demand prediction is the basis for conducting an impact analysis of EV access on the grid, a distribution grid planning and control operation, a two-way interaction between EVs and the grid, and charging guidance (Chen and Zhang, 2019). However, with the increasing penetration of EVs and the increasing charging demand, the rationality and accuracy of the existing charging demand prediction methods can no longer meet the needs of grid dispatch and charging guidance well (Ge et al., 2020). Therefore, this paper discusses conducting a series of studies on electric vehicle charging demand prediction.
Contemporary research on EV charging demand prediction focuses on user behavior analysis and the coupling characteristics between user behavior, road networks, and EVs (Arias et al., 2017; Li et al., 2018; Liu et al., 2022). Charging demand is generated due to the lack of energy of electric vehicles, and user behavior is the dominant factor of electric vehicle battery energy change, where user behavior users include charging time selection, travel mileage selection and driving strategy; thus, user behavior analysis is the difficulty and key to charging demand prediction. In recent years, load prediction models based on IoT big data platforms for obtaining user psychological and behavioral characteristics to meet real-time charging demand have been the focus of research (Ge et al., 2020), (Ge et al., 2020) obtains regenerative feature data by obtaining historical travel information and using data mining and fusion techniques to analyze the distribution pattern of residential trips and charging behavior characteristics. (Xydas et al., 2016) starts with the analysis of real charging data to establish a framework of features for EV charging demands. The model uses data analysis methods to extract the information hidden behind charging events to characterize EV charging loads. (Arias et al., 2017) proposes a time-space EV charging-electricity demand prediction model based on real-time CCTV data in Seoul, Korea. Traffic data (i.e., arrival rates) and EV battery information (i.e., SOC levels and charging patterns) are used to calculate EV charging demands. (Jahangir et al., 2021) proposes a supervised EV demand prediction method called EVGANS, which was developed in a 3D environment based on generative adversarial networks that can represent different characteristics of EV charging demands. (Zhao et al., 2021) addresses the problem of prediction accuracy by developing a new data-driven prediction framework, which improves the application of charging demand prediction models and enhances the prediction accuracy in complex real-world scenarios. (Yang et al., 2020) proposes an analytical framework for EV charging demand, emphasizing that charging demand is mainly determined by users’ travel behavior and bounded rational behavior. (Zang et al., 2020; Zang et al., 2021) analyze the information of user consumption behavior from practical load data from residential customers, and predict regional charging load based on deep learning algorithm.
Recent research methods show that researchers focus on individual user charging SOC feature mining and user charging strategy distribution based on model group behavior and its impact on charging demand prediction (Yang et al., 2017; Chaudhari et al., 2018; Calearo et al., 2019). A Marquardt (LM) training method based on a rough structure was developed using Levenberg’s feedforward and recursive artificial neural network (ANN). The method considers the correlation between arrival time, departure time and trip length (Jahangir et al., 2019). (Yi et al., 2020) investigates the spatial and temporal distribution of an EV charging demand in different urban functional areas and temperatures. The method describes the variability of individual users and considers various objective factors, such as time, location, temperature, and road conditions. (Lin et al., 2019) establishes an agent-based travel chain model (ABTCM) to study the distribution of electric vehicle (EV) charging demand and its dynamic characteristics, where a large number of EV charging demand differentiation models are considered. (Majidpour et al., 2014; Yi and Bauer, 2015) links charging demand to the urgency coefficient of user charging behavior, which gave a mathematical model to describe charging demand behavior, but lacked a method to determine charging demand behavior. (Ge et al., 2020) predicts the future 24-hour SOC variation curve of a single EV based on user historical SOC data, but this is only applicable to the more regular user SOC historical data, while the method lacks a grasp of user behavior. Based on a large amount of literature, it is known that user behavior is a deterministic strategy made by users based on factors, such as current time and remaining SOC, and there is a lack of research on accurate mathematical models of user charging and discharging strategies in current research due to the large number of factors influencing user behavior.
In this paper, we study two problems. The first problem is building an accurate mathematical model of user charging and discharging policies. Currently, generative adversarial imitation learning (Ho and Ermon, 2016) can express user policies as a neural network, and thus, neural networks can fit user policies due to their good strategy learnability (Wang, 2003). Generative adversarial imitation learning improves on the original inverse reinforcement learning (Ng and Russell, 2000), which can extract policies directly from user data, while avoiding the problem of difficult definition of the reward function in inverse reinforcement learning. In this paper, user charging and discharging policies are divided into driving policies, travel target mileage policies, and charging duration selection policies, and then these three policies are learned using generative adversarial imitation learning. The second problem is perceiving the charging demand behavior on the single vehicle SOC prediction results. Here, we consider quantifying the perception of user charging demand based on the user charging urgency model and providing the method of determining charging demand.
In summary, this paper proposes a new EV charging demand prediction method that fully considers user charging and discharging strategies, and this paper makes the following contributions.
1) A user charging and discharging strategy model is established. Based on the MIC maximum information coefficient to prove the correlation between EV SOC variation and driving strategy and charging strategy, combined with the real-time traffic flow speed of Baidu map, we propose a strategy learning model based on the generative adversarial imitation learning (GAIL) hybrid proximal policy optimization algorithm (PPO).
2) A 24-hour SOC prediction model for a single electric vehicle is established. Based on the strategy learning model, the prediction method of single EV SOC is proposed based on the XGboost algorithm, and it is proven that the prediction method has good robustness and accuracy.
3) A spatiotemporal model of EV cluster charging demand in the region is established. Based on the individual EV SOC prediction curves and combined with the user charging urgency perception model, a spatiotemporal model of EV cluster charging demand in the region is established and demonstrated to describe the spatiotemporal characteristics of charging demand.
The rest of the paper is organized as follows: Chapter 2 demonstrates that the user charging and discharging strategy is the main factor in the SOC variation of EVs. Chapter 3 gives a detailed description of the approach in this paper, and Chapter 4 presents and discusses the results of the model simulation. Chapter 5 provides a summary and outlook of the work in this paper.
From Chapter 1, it is clear that the core problem of EV charging demand prediction at this stage is to consider a single-user SOC prediction model based on the user’s EV charging and discharging strategy. Since SOC variation is affected by many factors, including user strategy factors and environmental factors, it is necessary to demonstrate that charging and discharging strategies are the main factors of SOC variation. Thus, this proves the feasibility of a single EV SOC prediction model, followed by screening the strategy factors that are strongly related to SOC as the input features of the single vehicle SOC prediction model, where charging and discharging strategies include the user driving strategy, the user travel mileage selection strategy and the user charging duration selection strategy. Next, the correlation between user charging demand and user charging starting SOC distribution and user charging urgency is illustrated.
MIC is the maximal information coefficient (Zhang et al., 2014). MIC can measure the degree of correlation between two variables, and the value of MIC is between 0 and 1. The larger the value of MIC is, the stronger the correlation between the two. Meanwhile, MIC has good accuracy and robustness.
The charge-discharge characteristic analysis proves the correlation between the discharging SOC and the driving strategy based on the MIC matrix and illustrates the correlation between the charging SOC and the charging strategy. The MIC matrix values are distributed from 0 to 1; the closer to 1 the value is, the stronger the correlation between the horizontal and vertical factors.
The discharging process, i.e., the driving process, is a process with human factors involved, and its SOC is affected by numerous factors, not limited to those shown in the figure below, such as road conditions (slope, bumpiness). This paper mainly considers the influence of the user’s driving strategy on the SOC variation. The discharging characteristic MIC matrix is shown on the left of Figure 1, and the results prove that the correlation between the discharging SOC and driving distance, speed and temperature is the strongestamong the subcorrelation factors of the discharging SOC, the correlation between the discharging SOC and total voltage and battery voltage is stronger, therefore, the user driving strategy is the main causal factor of SOC change in the discharging process. Meanwhile, temperature is also a major factor affecting SOC, which is due to the fact that electric vehicles are driven in situations where the outdoor temperature is low and the low temperature inhibits the performance of the battery (Qin et al., 2021). Here, a discharging SOC prediction model based on user driving strategy and real temperature data is considered.
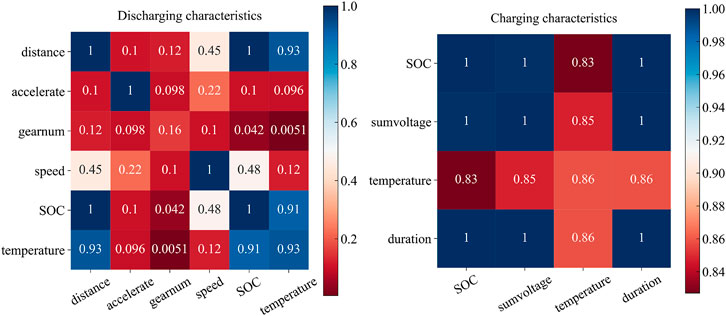
FIGURE 1. MIC matrix analysis of charging characteristics and discharging characteristics.
The charging stage has no human subjective factors involved, and each variable changes with the interaction process of EV and charging pile. The whole process is more regular than the discharging process, and the charging process is divided into fast charging and slow charging. The correlation of these two process features is basically unified. The MIC matrix is shown on the right of Figure 1, and the results prove that the charging SOC and the user charging duration, charging voltage, and temperature are strongly correlated. As with the discharging process, a charging SOC prediction model based on user charging duration and real temperature data is considered here.
The root cause of user charging demand generation is the reduction of battery energy, which affects the urgency of user charging, i.e., charging urgency (Yi and Bauer, 2015). The higher the charging urgency is, the higher the probability of that user signaling charging demand. Only the charging urgency determined by the battery SOC is considered here. When the depth of discharge (DOD) is deep and the remaining charge is less, the higher the charging probability of the user and the higher the charging urgency of the user, it becomes more urgent for the user to charge.
Here, we consider the general expression of the charging urgency function. Let the charging probability density function be
where
Here,
where
The user charging starting SOC distribution reflects the user’s dependence on the action of charging demand on the selection of starting charging SOC. If a user tends to choose to charge at a lower SOC, the probability of having a charging demand at a certain moment will also be lower, conversely, the probability of generating charging demand will increase. We consider fitting the charging start SOC distribution of different users using a normal distribution, and the method of determining the charging demand is as follows: when a user’s real-time SOC approaches this user’s historical charging starting SOC at moment t, i.e., when the real-time SOC drops to some user’s charging demand interval, that user will generate charging demand, which is determined by the distribution of the user’s charging urgency coefficient and that user’s charging starting SOC.
Here, consider the case that when the charging starting SOC is smaller, the greater the probability of charging for a user. In order to obtain the charging start SOC distribution of a user, i.e. normal distribution
The analysis of the strategy factors of the charging and discharging process in Section 2.1 shows that there is a correlation between user strategy and SOC variation, as well as variability in different user behavior strategies, so it is necessary to establish a single-user 24-hour SOC curve and finally a regional EV cluster charging demand model. Strategy learning is performed using generative adversarial imitation learning (GAIL), and based on strategy learning; individual vehicle SOC curves are predicted based on the XGboost algorithm. The spatial and temporal prediction framework for EV cluster charging demand is shown in Figure 2, and the prediction process is divided into three steps, which are described in detail in Sections 3.3, 3.4, 3.5, followed by experimental data acquisition and algorithm introduction described in Sections 3.1, 3.2, respectively.
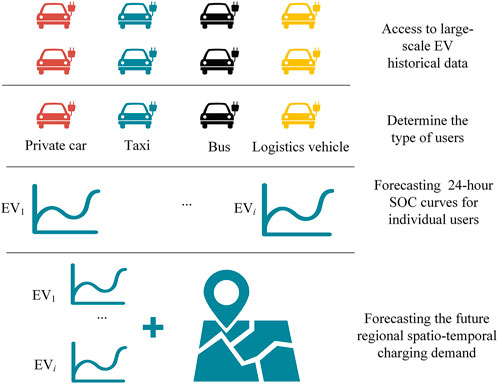
FIGURE 2. Spatial and temporal prediction framework for EV cluster charging demand.
The experimental data in this paper are obtained from the Shanghai New Energy Electric Vehicle Monitoring Center for 1,000 tested EVs in a month (Shanghai Electric Vehicle Public Data Collecting, 2019), which contains the following EV operation parameters: speed, acceleration, SOC, temperature, latitudes and longitudes, with data points sampled every 10 s, with private cars, logistics vehicles, buses, and taxis accounting for 10%, 12%, 35%, and 43% of the data, and the data points for a single trip trajectory are approximately 2000. This article states: all vehicle information has been de-privatized. The data attributes are shown in Table 1.
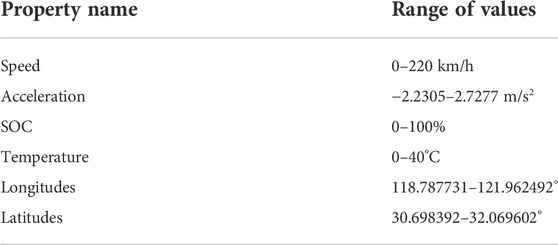
TABLE 1. Data attributes.
The OSMnx library in Python was used to obtain information on the coordinates of all road nodes in the target prediction area and the distance between nodes (road nodes are the intersections of that path and other roads), and a sample road network is shown in Figure 3.
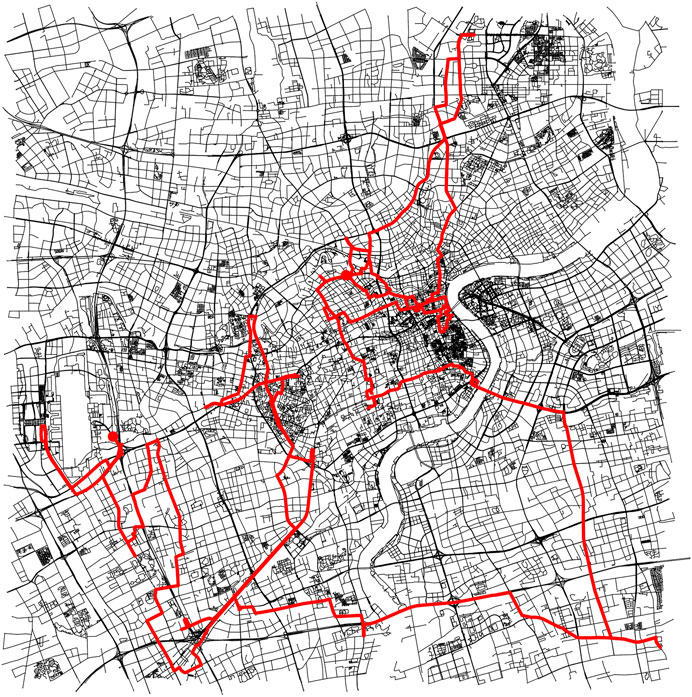
FIGURE 3. Example of a path.
Generative adversarial imitation learning is an effective combination of imitation learning (Osa et al., 2018) and adversarial networks (Goodfellow et al., 2014). This paper is based on GAIL to fit user charging and discharging strategies. The generator network is the charging and discharging policy, where the discriminator and generator are multilayer fully connected neural networks. Here set the label of generated data by the generator to 1 and the real user data to 0. The above process is a game process between the discriminator and the generator. After several iterations of the above process, when the discriminator cannot distinguish the data generated by the generator from the real data, i.e., the generator and the discriminator reach Nash equilibrium, the generated data successfully matches the real data.
First, we introduce the binary cross-entropy loss function:
Eq. 4 is the loss function for training the binary classifier,
According to the principle of generative adversarial model, the discriminator performs a gradient descent update based on Eq. 5:
where
The loss function of the generative network is constructed using Eq. 4 as follows:
The optimization of the parameters of the generator and the discriminator is performed by the PPO algorithm. This algorithm accelerates the convergence of the network parameters. The PPO algorithm has some of the advantages of trust region policy optimization (TRPO) (Schulman et al., 2015). The objective function of PPO is a first-order approximation taken over TRPO, so they are easier to implement, more general and have better sample complexity (Schulman et al., 2017). In this paper, certain improvements are made based on the original PPO algorithm as follows.
In order to make the generalization ability of the generator better, the generated samples collected from the environment are disrupted here, while the samples are divided into certain batches and sent to the PPO algorithm for multiple rounds of parameter updates, which can make full use of the sample information and also improve the learning efficiency and convergence speed of the generator. Here, the sample batches should not be too many, so as not to reduce the operation speed of the algorithm.
XGBoost is an optimized distributed gradient boosting library (Chen and Guestrin, 2016) that performs well on regression problems. It is a machine learning algorithm based on the gradient boosting framework. The basic idea of XGBoost is the same as GBDT (Friedman, 2001).
Path planning uses the set of real path latitude and longitude coordinates in the dataset of Section 3.1.2, and all path latitude and longitude coordinates are processed through the data. Then, the OSMnx library in Python is used to visualize the path and extract information about the coordinates of road nodes and distance from the starting node (a path node is the intersection of that path and other roads). Let the dataset of each path node be:
where
Considering that the user’s driving strategy is affected by the real-time traffic flow speed, it is necessary to obtain the real-time average speed of each road section based on the Baidu map real-time information platform (Baidu map open platform, 2022) to obtain the driving time
The individual EV SOC is predicted on the path-based real-time traffic flow speed extraction in Section 3.3. The prediction flow diagram is shown in the dashed part of Figure 4, and the prediction model is divided into two submodels as follows.

FIGURE 4. Flow chart of EV cluster charging demand spatial and temporal prediction.
The dashed part of Figure 4 shows the policy model part, which consists of three upper-level policies and one lower-level policy. The state space is the current SOC and the current moment, and all upper layer strategies share the current state information and make actions according to the state, where the charging and discharging strategies make charging action 0 or travel action 1; the charging strategy outputs the single charging duration; the travel strategy outputs the single travel target distance; the lower driving strategy executes the output target of the upper-level strategy and outputs the acceleration, single mileage, and time of the next moment with an output interval of 10 s. Thus, the output after executing the policy network is a single EV 24-hour speed curve and a single mileage curve. The three policy networks use the same GAIL structure with a time scale of 24 h. The strategy learning flow chart is shown in Figure 5. The strategy learning model consists of a policy generation network, a discriminator network and a PPO network. The policy network uses the user history data as the learning sample and fits the user history policy distribution through the discriminator. The specific process is as follows.
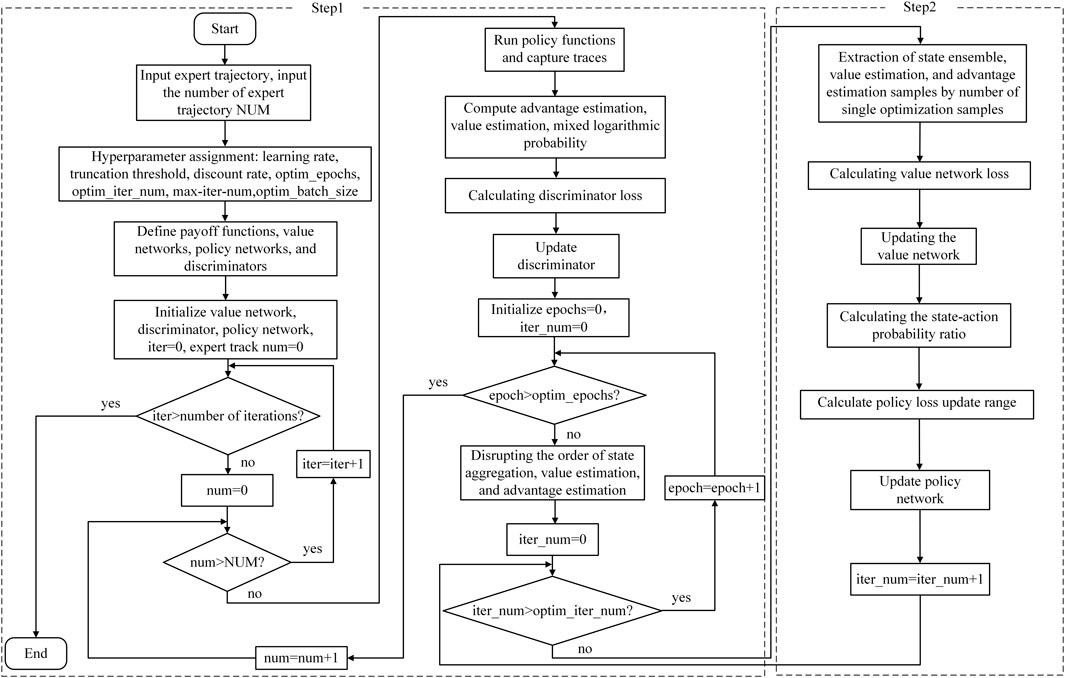
FIGURE 5. Flow chart of strategy learning based on the PPO algorithm.
The main program is a nested loop structure. The first layer loop is an iterative loop, traversing all expert trajectory data for one generation. The second layer is an expert trajectory loop, first generating the sampled trajectory after the policy network and then calculating the corresponding value function, advantage function, and the mixed logarithmic density of the sampled trajectory, before sending the expert strategy trajectory and sampled trajectory to the discriminator to update the discriminator parameters, and finally sending the value function, advantage function, and the mixed logarithmic density of the sampled trajectories to the PPO algorithm to update the policy network until all expert trajectories are traversed and the second level of the loop ends.
The structure is a nested two-layer loop; the first layer is an iterative loop, for each iteration, the order of the collected sample data (state set, reward value set, advantage estimation set, value estimation set, return estimation set, state-action mixed logarithmic probability set) is disordered, divided by certain batches and sent to the PPO algorithm for a parameter optimization update together with the policy network, value network; and the second layer is the network parameter update layer, traversing all sampled batches, i.e., the cycle is completed.
Based on the input feature analysis of the SOC prediction model in Section 2, the speed and mileage curves, as well as the charging duration curve, are calculated based on the 24-hour user speed curve generated by the learning strategy in Section 3.4.1, where the speed and mileage curves predict the discharging SOC and the charging duration curve predicts the charging SOC. Therefore, the driving SOC regression prediction model and the charging SOC regression prediction model are developed.
Here, the prediction algorithm is chosen as XGboost, and the prediction model flowchart is shown in the lower part of Figure 6, where the loop is a cross-validation process. The process divides the training dataset into n subsets and normalizes the training set by removing the mean and scaling to the unit variance, and each loop uses one of the subsets as the validation set and the remaining subsets as the training set until all subsets are traversed. This method ensures good generalization.
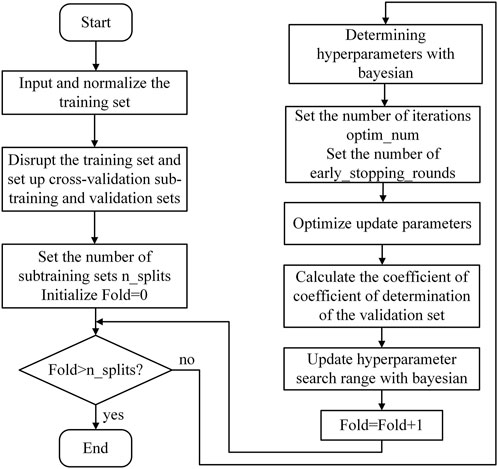
FIGURE 6. Flow chart of single vehicle 24-hour SOC prediction based on the XGboost algorithm.
As shown in Figure 4, based on the individual EV SOC prediction model in Section 3.4, a regional-scale EV charging energy demand prediction model is established, where the user charging urgency and charging starting SOC are used to predict the charging energy demand without using the user. According to the definition of the charging demand interval in Section 2.3, when the user SOC enters within the charging demand interval, the user is considered to have charging demand, and the charging energy demand of this user is calculated, labeled on the map, then finally generated a heatmap for EV cluster charging demand prediction.
In order to make the strategy learning model and SOC prediction model in Section 3.4 converge in a shorter time to achieve better performance, the Bayesian optimization algorithm is utilized here for hyper parameter search. In the curated path model, the KL scatter of the true and predicted values is used as the objective function of Bayesian optimization, where the policy network and the discriminator network consist of multilayer fully connected neural networks, and the network hyper parameters are shown in Table 2, with the number of expert trajectories set to 10. In the SOC prediction model, the mean square error of the true and predicted values is used as the objective function of Bayesian optimization, and the number of search generations is 50. The XGboost hyperparameters are shown in Table 2, and the hyperparameters are all accurate to 4 decimal places.
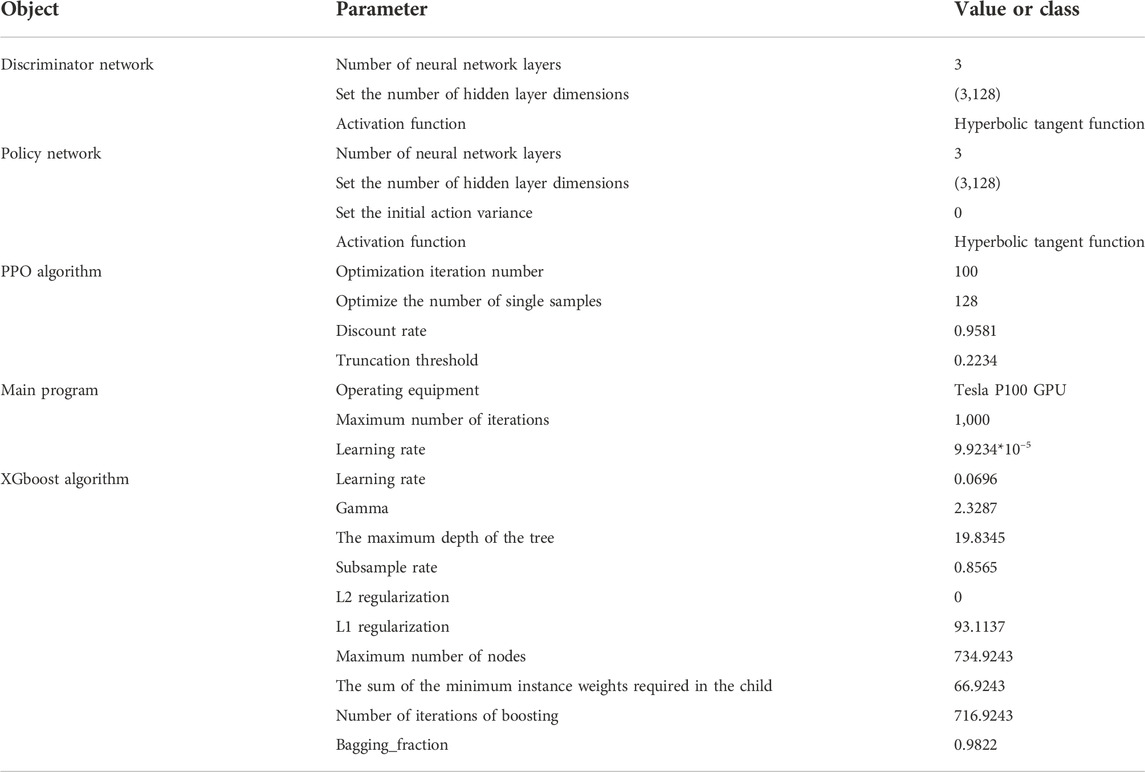
TABLE 2. Parameter settings.
1) Root mean square error (RMSE):
2) Mean square error (MSE):
3) Coefficient of determination (R-Squared):
The R-squared is between 0 and 1; the closer it is to 1, the better the performance of the regression model.
4) Mean absolute error (MAE):
The size of the expert sample determines the amount of information that can be learned by the policy network, which in turn affects the stability of the policy network. Thus, the robustness of the reinforcement learning model is mainly reflected in the effect of the size of the data on the model’s stability.
KL divergence (Kullback-Leibler divergence), also known as relative entropy, is a way to describe the difference between two probability distributions, P and Q, where P denotes the true distribution and Q denotes the fitted distribution of P. For two probability distributions, P and Q, of a discrete random variable or a continuous random variable, the KL divergence is defined as follows:
The KL divergence is between 0 and
The model simulation analysis is divided into several parts: first, the robustness and learnability of the policy network are evaluated, followed by a speed prediction model based on the policy model to illustrate the variability of user policies, comparing the speed prediction results for four types of users. Then, the single vehicle 24-hour SOC prediction results are shown and compared with historical SOC-based prediction methods, and finally, a spatiotemporal map of charging demand at key moments throughout the day in the main city of Shanghai is shown. The algorithm program is fully implemented by Python 3.7.
The robustness of the policy network reflects the stability of the policy network, therefore the stability of the policy network obtained by different policy optimization algorithms is different; thus, it is necessary to analyze the robustness of the policy optimization algorithm (PPO algorithm) based on this paper, and the comparison algorithm is the TRPO algorithm. As shown in Figure 7. Here, the total historical travel trajectories are supplied for 20, and the average returns of TRPO- and PPO-based policy networks are compared and analyzed under the conditions of 25%, 50%, 75%, and 100% historical travel trajectory data, respectively. 3 to 5 simulations are performed with the same random seeds. The dashed lines indicate the values of the reward functions corresponding to the expert policies, and the red color represents the TRPO-based return curves. The purple color represents the return curve based on PPO. The TRPO algorithm is less robust when the amount of data is less, while the average return is lower, and the PPO algorithm is more robust under each amount of data. Its average return fluctuation is less than 0.2%, while the average return is higher than the TRPO algorithm, and the average return value of the PPO algorithm is close to the expert strategy. Therefore, the robustness of the method in this paper is better, and the stability of the policy network is stronger.
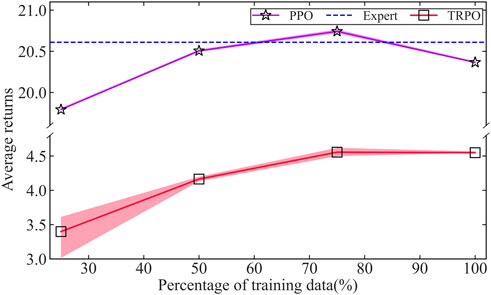
FIGURE 7. Comparison of PPO and TRPO robustness.
In order to prove that the method of this paper has good strategy learnability, the KL divergence of this paper’s algorithm (PPO) and TRPO algorithm on strategy learning is compared and analyzed here, and the magnitude of KL divergence indicates the difference between the policy network generated data and the real data. The results are shown in Table 3. The results based on the PPO algorithm have the lowest KL divergence among the three learning strategy results, which indicates that the PPO algorithm has better learnability for the policy path.
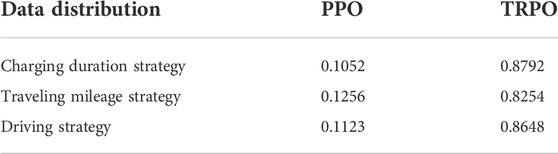
TABLE 3. Comparison of KL divergence of strategy learning results and expert data.
We illustrate the effect of variability in the charging and discharging strategies of different users on the time distribution of charging demand and provide data for the subsequent prediction of the 24-hour SOC of a single vehicle. The results of the 24-hour speed prediction for a single vehicle are shown here. Here, four types of users are considered: private cars, logistics vehicles, buses, and taxis. Their respective charging and discharging strategies are learned, and then the 24-hour speed prediction curve of a single vehicle is predicted based on the real-time traffic flow speed, as shown by the red line in Figure 8. Finally, the single driving mileage is calculated based on the speed curve, and here, the starting mileage is obtained by averaging the user’s historical data. As shown by the blue line in the figure, the following analysis shows the variability of user charging and discharging strategies.
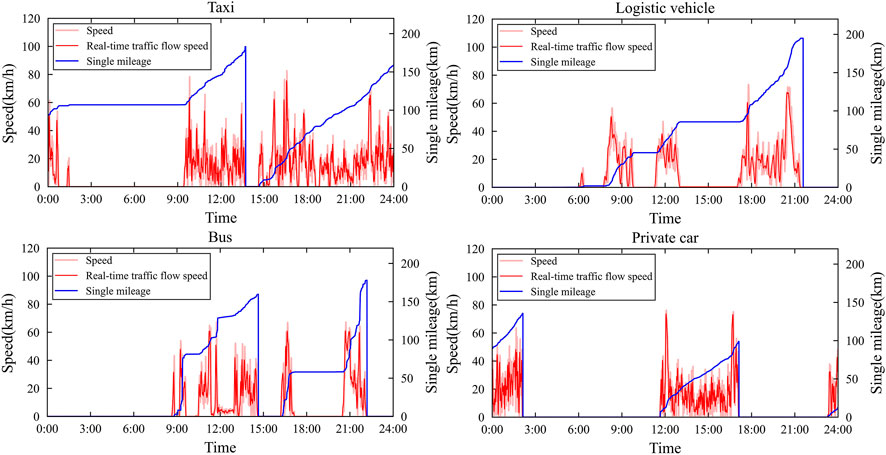
FIGURE 8. Single vehicle 24-hour speed and mileage prediction results.
As shown in Figure 8, taxis and buses travel the longest single mileage, and due to the functionality of logistics vehicles and buses, the charging demand for both is distributed between 9:00 p.m. and 8:00 a.m. the following day. Additionally, after 10:00 p.m., the operation basically stops, so both take slow charging in the evening. There is relatively no substantial regularity in the discharging time interval for taxis and private cars. Meanwhile, taxis have obvious charging behavior at approximately 1:00 p.m. Since taxis need to obtain more travel orders during the day, they mostly adopt fast charging, so the charging duration of taxis is approximately 1 h, while the charging demand of private cars is basically concentrated between 12:00 a.m. and 8:00 a.m., and private car users mostly adopt slow charging in the evening. Additionally, the driving speed of the four types of cars is basically positively correlated with the real-time traffic flow speed, and the learning results of the user’s driving strategy are relatively substantial. In summary, the variability of the time distribution of charging demand for different users is relatively obvious due to different charging and discharging strategies.
Here, the user driving speed and mileage prediction results based on Section 4.2, i.e., the charging and discharging strategy, are used as the input features of the XGboost algorithm as a way to predict the 24-hour SOC curve of a single vehicle to demonstrate the superiority of the method in this paper. As shown in Figure 9, four types of EVs are selected by vehicle usage and compared with the prediction method based on historical SOC, where the red line represents the real SOC, the blue line represents the prediction result based on historical SOC, and the sky blue line represents the prediction result based on the charging and discharging strategy. The prediction results of both methods for charging SOC are good, the prediction curves are relatively smooth, and the prediction results are stable. However, in SOC the prediction results of the discharging process, the two perform slightly differently. In the comparison of the prediction results for private car users, the prediction curves of the two methods are less stable and show obvious jitter, which may be related to the feature distribution of the data itself, but both have a good grasp of the overall trend of the SOC discharging process. In the prediction results for taxi users, the method in this paper performs well in the prediction results for taxi users. The method in this paper shows good stability in the prediction results of the discharging process, but the prediction results of the historical SOC-based method show obvious jitters and outliers in the second half of the discharging process, which is due to the inconspicuous characteristics of the historical data. In the prediction results of SOC for logistics vehicle users, both show better robustness and fit.
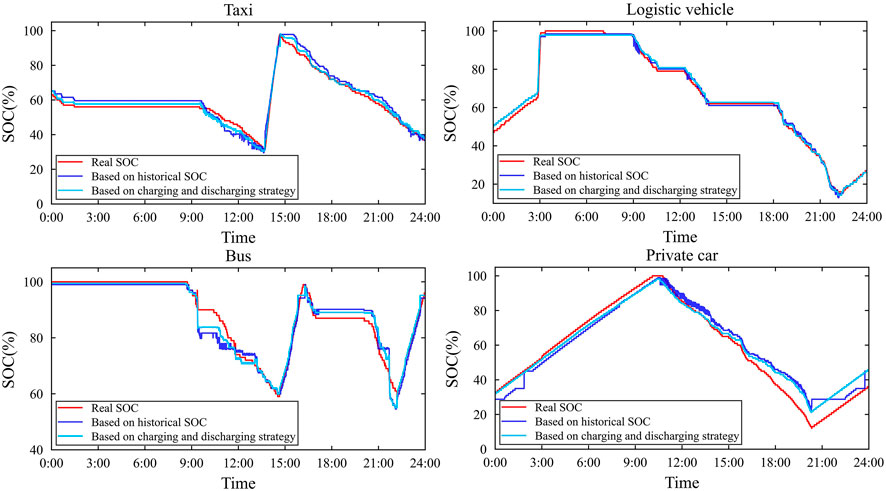
FIGURE 9. Single vehicle 24-hour SOC prediction results.
It also proves the good prediction accuracy of the method in this paper. According to Table 4, the four evaluation metrics of regression prediction in Section 3.7 are selected here, and the prediction accuracy of this paper’s SOC prediction method and the historical SOC-based prediction method are compared according to these four indicators. Both methods use the same size training set to train the network, and the training set size is 5,000 data points. From the prediction results of the four types of vehicle SOCs, each of the prediction methods obtained from this paper’s average mean square error is reduced by 37% and the average coefficient of determination is improved by 4%. The results demonstrate that the two methods perform basically equivalently for the logistics vehicle SOC prediction problem, while in the other three types of EV SOC prediction problems, the prediction accuracy of this paper’s method is considerably higher than that of the traditional prediction method.
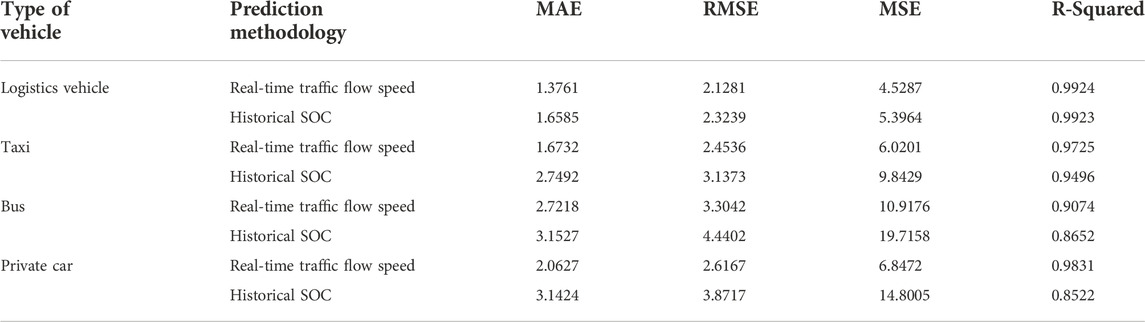
TABLE 4. Evaluation metrics.
Spatial and temporal prediction of large-scale EV charging demand is considered here. The individual EV 24-hour SOC prediction results based on Section 4.3 and the definition of charging demand intervals in Section 2.3 are combined to predict the charging demand and energy demand for all users. The spatiotemporal distribution of charging demand in the region is then built on this basis. Here, it is specified that when a user generates charging demand, the difference between the current battery energy and 100% of the battery capacity is used as the charging energy demand. Let the charging energy demand be
The battery capacity options are as follows: 135 kWh for buses, 48 kWh for private cars, 40.6 kWh for logistics vehicles, and 45 kWh for taxis.
Figure 10 selects the prediction area as the core area of Pudong New Area in Shanghai, which is divided into three functional areas: the main urban area, containing the central business district along Lujiazui and three subcenters (Huamu Road, Jinqiao, and Zhangjiang Town); the high-tech industrial area, centered on Tang Town and Zhuqiao Town; and the residential area, centered on Kangqiao and Zhoupu Town. The spatial distribution characteristics of charging demand for 1,000 tested EVs in a day are shown here, where 8 key time points in a day (3:00 a.m., 6:00 a.m., 9:00 a.m., 12:00 a.m., 3:00 p.m., 6:00 p.m., 9:00 p.m., and 12:00 p.m.) are intercepted in kWh, and only users with charging demand are shown in the figure, where each dot represents a vehicle with a charging demand, and the size and color shades of the dots represent the amount of energy demanded by the user. Figure 11 shows the total charging demand in each hour of a day. In order to prove the validity of the model in this paper, the spatiotemporal distribution characteristics of charging demand are analyzed based on the prediction results.
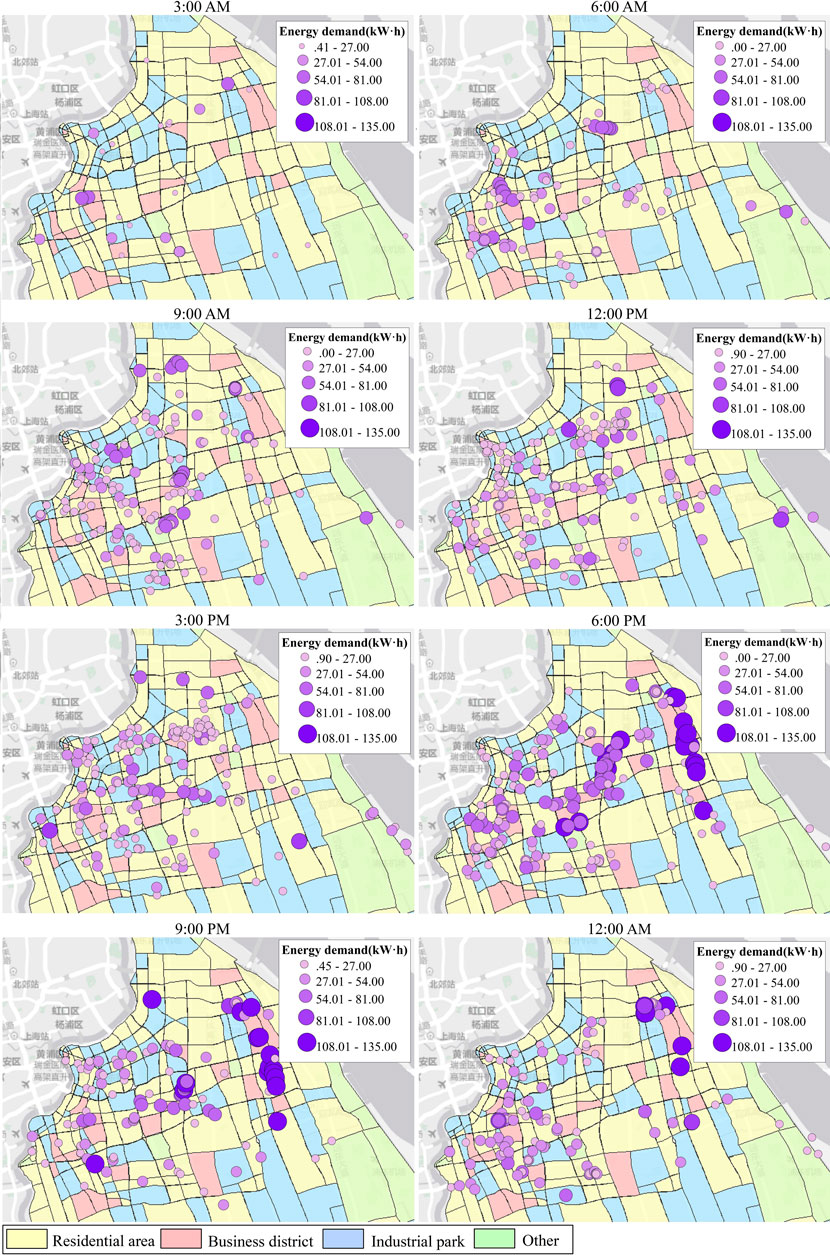
FIGURE 10. Results of 24-hour charging demand prediction in Pudong.
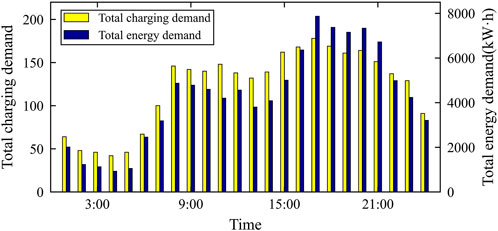
FIGURE 11. Total charging demand and total energy demand statistics by moment.
As seen in Figure 11, charging requests peak at approximately 12:00 p.m. and 6:00 p.m., reaching approximately 150 and 180, respectively. Charging energy demand also peaks at approximately 12:00 p.m. and 6:00 p.m., reaching approximately 4,000 kWh and 7000 kWh, respectively, with charging demand entering a trough at approximately 3:00 a.m. Overall, the temporal distribution of charging demand is relatively smooth, and the peak period lasts for a long time. This proves that the charging demand has the characteristics of time distribution.
As shown in Figure 10, from the spatial distribution of charging demand, the charging load demand is in the low period from 12:00 a.m. to next day 6:00 a.m., and there is no obvious aggregated demand for charging. After 6:00 a.m., the charging demand gradually increases in the main urban area due to the emergence of the morning peak period, with Lujiazui, Zhangjiang town and Jinqiao town as the center in a radial distribution and less charging demand in the area of high-tech industrial zone and residential area. After 6:00 p.m., due to the emergence of the evening peak period, the charging demand in the high-tech industrial area appears to be aggregated, and the residential area also has an aggregated distribution. After 12:00 a.m., the charging demand in the sub center area and the industrial area decreases substantially. Other areas show a uniform distribution of a charging demand throughout the day. In summary, it is proven that the charging demand distribution is related to the functionality of the area, and therefore, the charging demand has spatial distribution characteristics.
From the distribution of charging energy demand throughout the day, most of the charging demand energy near the central business district is distributed below 30 kWh, so the charging users are mainly taxis and private cars, while the charging energy demand in the high-tech industrial area is distributed above 60 kWh, which indicates that the charging users are mainly public transport vehicles. This proves that the functionality of the vehicle and the charging demand distribution are related, and in the case of this paper, the users are dominated by taxis.
In this paper, first, to address the problem that the mathematical model of user charging and discharging strategies in the current literature is vague, a GAIL hybrid PPO-based strategy learning model is proposed. Then, a single-user SOC prediction model is built based on the strategy model. Second, a mathematical determination method of charging demand is given based on user charging urgency, and a regional EV cluster charging demand model is predicted based on the determination method. The model analysis demonstrated that the KL divergence of the policy network obtained based on the GAIL hybrid PPO algorithm is reduced by 77% compared to the GAIL hybrid TRPO algorithm. Thus, in strategy learning, this paper method has better learnability. Finally, in terms of single vehicle SOC prediction, this paper proposes that the prediction method using user behavior characteristics (speed, distance traveled, charging duration) has lower prediction error, as well as better robustness compared to the current historical SOC-based prediction methods with a 37% reduction in mean square error. The main contributions of this paper are as follows.
1) A 24-hour SOC prediction model is established for individual EVs based on real-time traffic flow rates that can elaborate on the variability of user policies.
2) A regional charging demand prediction model is established for charging EV clusters based on user charging urgency.
Future research work will make further improvements based on the above results. First, since the strategy learning model in this paper only considers real-time traffic flow speed information, the vehicle speed in real situations will be affected by more factors, such as the degree of road depression, the slope and the distance of the previous vehicle; thus, more complex driving environments need to be considered to portray the perfect EV SOC changes. Second, the charging demand urgency factor directly affects the reasonableness and accuracy of charging demand. In the future, more users need to be considered to perceive the overall charging requirements, and with the rapid development of telematics technology, more comprehensive user information can be fully obtained in the future. Finally, this paper focuses on the charging demand prediction of the whole urban area. However, it lacks the charging demand prediction of the charging station because the practical charging station model of the parking location is the key to estimating the charging demand, and at the same time, can provide more accurate data support for charging guidance, so the application value of the model in this paper needs to be improved.
The datasets presented in this study can be found in online repositories. The names of the repository/repositories and accession number(s) can be found below: https://labs.shevdc.com/home.
HL: methodology, algorithm finding, experimental platform provision, editing, supervision, and review. DL: algorithm finding, programming, simulation, and writing-original draft preparation. YZ: methodology, experimental platform provision, algorithm refinement, editing, supervision, and review. YS: methodology, algorithm search, raw data provision, review, and article refinement. DF: methodology, algorithm refinement, editing, supervision, and review. SS: algorithm search, testing, and validation.
This work was sponsored in part by the National Natural Science Foundation of China (Nos. 52167014 and 52077139), in part by the Science and Technology Commission of Shanghai Municipality (Nos. 21DZ2204800 and 21YF1408600), in part by the Key Laboratory of Control of Power Transmission and Conversion (SJTU), Ministry of Education (2022AA04), and in part by the Science and Technology Project of State Grid Shanghai Municipal Electric Power Company of China (No. 52094022000G).
Author SS was employed by State Grid Shanghai Municipal Electric Power Company.
The remaining authors declare that the research was conducted in the absence of any commercial or financial relationships that could be construed as a potential conflict of interest.
All claims expressed in this article are solely those of the authors and do not necessarily represent those of their affiliated organizations, or those of the publisher, the editors and the reviewers. Any product that may be evaluated in this article, or claim that may be made by its manufacturer, is not guaranteed or endorsed by the publisher.
Arias, M. B., Kim, M., and Bae, S. (2017). Prediction of electric vehicle charging-power demand in realistic urban traffic networks. Appl. Energy 195, 738–753. doi:10.1016/j.apenergy.2017.02.021
Baidu map open platform (2022). Baidu map open platform. Available at https://lbsyun.baidu.com (Accessed March 15, 2022).
Calearo, L., Thingvad, A., Suzuki, K., and Marinelli, M. (2019). Grid loading due to EV charging profiles based on pseudo-real driving pattern and user behavior. IEEE Trans. Transp. Electrif. 5 (3), 683–694. doi:10.1109/TTE.2019.2921854
Chaudhari, K., Kandasamy, N. K., Krishnan, A., Ukil, A., and Gooi, H. B. (2018). Agent-based aggregated behavior modeling for electric vehicle charging load. IEEE Trans. Ind. Informat. 15 (2), 856–868. doi:10.1109/TII.2018.2823321
Chen, L., and Zhang, Y. (2019). Overview of charging and discharging load forcasting for electric vehicles. Automat. Electr. Power Syst. 43 (10), 177–197. doi:10.7500/AEPS20180814001
Chen, T., and Guestrin, C. (2016). “Xgboost: A scalable tree boosting system,” in Proceedings of the 22nd ACM SIGKDD International Conference on Knowledge Discovery and Data Mining (KDD), San Francisco, CA, 785–794. doi:10.1145/2939672.2939785
EV volumes.com (2021). Global EV sales for 2021. Available at http://www.evvolumes.com (Accessed May 13, 2022).
Friedman, J. H. (2001). Greedy function approximation: A gradient boosting machine. Ann. Stat. 29 (5), 1189–1232. doi:10.1214/aos/1013203451
Ge, X., Shi, L., Fu, Y., Muyeen, S. M., Zhang, Z., and He, H. (2020). Data-driven spatial-temporal prediction of electric vehicle load profile considering charging behavior. Electr. Power Syst. Res. 187, 106469. doi:10.1016/j.epsr.2020.106469
Goodfellow, I., Pouget-Abadie, J., Mirza, M., Xu, B., Warde-Farley, D., Ozair, S., et al. (2014). Generative adversarial nets. Adv. Neural Inf. Process. Syst. 3, 2672–2680. doi:10.3156/jsoft.29.5_177_2
Ho, J., and Ermon, S. (2016). Generative adversarial imitation learning. Adv. Neural Inf. Process. 29, 4572–4580.
Jahangir, H., Gougheri, S. S., Vatandoust, B., Golkar, M. A., Golkar, M. A., Ahmadian, A., et al. (2021). A novel cross-case electric vehicle demand modeling based on 3D convolutional generative adversarial networks. IEEE Trans. Power Syst. 37 (2), 1173–1183. doi:10.1109/TPWRS.2021.3100994
Jahangir, H., Tayarani, H., Ahmadian, A., Golkar, M. A., Miret, J., Tayarani, M., et al. (2019). Charging demand of plug-in electric vehicles: Forecasting travel behavior based on a novel rough artificial neural network approach. J. Clean Prod. 229, 1029–1044. doi:10.1016/j.jclepro.2019.04.345
Li, M., Lenzen, M., Keck, F., McBain, B., Rey-Lescure, O., Li, B., et al. (2018). GIS-based probabilistic modeling of BEV charging load for Australia. IEEE Trans. Smart Grid 10 (4), 3525–3534. doi:10.1109/TSG.2018.2829917
Lin, H., Fu, K., Wang, Y., Sun, Q., Li, H., Hu, Y., et al. (2019). Characteristics of electric vehicle charging demand at multiple types of location-Application of an agent-based trip chain model. Energy 188, 116122. doi:10.1016/j.energy.2019.116122
Liu, Y., Liu, W., Gao, S., Wang, Y., and Shi, Q. (2022). Fast charging demand forecasting based on the intelligent sensing system of dynamic vehicle under EVs-traffic-distribution coupling. Energy Rep. 8, 1218–1226. doi:10.1016/j.egyr.2022.02.261
Majidpour, M., Qiu, C., Chu, P., Gadh, R., and Pota, H. R. (2014). Fast prediction for sparse time series: Demand forecast of EV charging stations for cell phone applications. IEEE Trans. Ind. Informat. 11 (1), 242–250. doi:10.1109/TII.2014.2374993
Ng, A. Y., and Russell, S. J. (2000). “Algorithms for inverse reinforcement learning,” in Proceedings of the Seventeenth International Conference on Machine Learning (ICML), San Francisco, CA, 0, 663–670.
Osa, T., Pajarinen, J., Neumann, G., Bagnell, J. A., Abbeel, P., and Peters, J. (2018). An algorithmic perspective on imitation learning. Found. Trends® Robotics 7 (1-2), 1–179. doi:10.1561/2300000053
Qin, Y., Adams, S., and Yuen, C. (2021). Transfer learning-based state of charge estimation for lithium-Ion battery at Varying Ambient temperatures. IEEE Trans. Ind. Informat. 17 (11), 7304–7315. doi:10.1109/TII.2021.3051048
Schulman, J., Levine, S., Abbeel, P., Jordan, M., and Moritz, P. (2015). “Trust region policy optimization,” in 32nd International Conference on Machine Learning (ICML), Lille, France, 1889–1897.
Schulman, J., Wolski, F., Dhariwal, P., Radford, A., and Klimov, O. (2017). Proximal policy optimization algorithms. Available at https://arxiv.org/abs/1707.06347.
Shanghai Electric Vehicle Public Data Collecting, (2019). New energy vehicle operation data. Shanghai Electric Vehicle Public Data Collecting, Monitoring and Research Center. Available at https://labs.shevdc.com/home.
Wang, S. C. (2003). “Artificial neural network,” in Interdisciplinary computing in java programming (Boston, MA: Springer), 81–100.
Xydas, E., Marmaras, C., Cipcigan, L. M., Jenkins, N., Carroll, S., and Barker, M. (2016). A data-driven approach for characterising the charging demand of electric vehicles: A UK case study. Appl. Energy 162, 763–771. doi:10.1016/j.apenergy.2015.10.151
Yang, J., Wu, F., Yan, J., Lin, Y., Zhan, X., Chen, L., et al. (2020). Charging demand analysis framework for electric vehicles considering the bounded rationality behavior of users. Int. J. Electr. Power & Energy Syst. 119, 105952. doi:10.1016/j.ijepes.2020.105952
Yang, W., Xiang, Y., Liu, J., and Gu, C. (2017). Agent-based modeling for scale evolution of plug-in electric vehicles and charging demand. IEEE Trans. Power Syst. 33 (2), 1915–1925. doi:10.1109/TPWRS.2017.2739113
Yi, T., Zhang, C., Lin, T., and Liu, J. (2020). Research on the spatial-temporal distribution of electric vehicle charging load demand: A case study in China. J. Clean Prod. 242, 118457. doi:10.1016/j.jclepro.2019.118457
Yi, Z., and Bauer, P. H. (2015). Spatiotemporal energy demand models for electric vehicles. IEEE Trans. Veh. Technol. 65 (3), 1030–1042. doi:10.1109/TVT.2015.2502249
Zang, H., Cheng, L., Ding, T., Cheung, K. W., Wei, Z., and Sun, G. (2020). Day-ahead photovoltaic power forecasting approach based on deep convolutional neural networks and meta learning. Int. J. Electr. Power & Energy Syst. 118, 105790. doi:10.1016/j.ijepes.2019.105790
Zang, H., Xu, R., Cheng, L., Ding, T., Liu, L., Wei, Z., et al. (2021). Residential load forecasting based on LSTM fusing self-attention mechanism with pooling. Energy 229, 120682. doi:10.1016/j.energy.2021.120682
Zhang, Y., Jia, S., Huang, H., Qiu, J., and Zhou, C. (2014). A novel algorithm for the precise calculation of the maximal in formation coefficient. Sci. Rep. 4 (1), 6662–6665. doi:10.1038/srep06662
Zhao, Y., Wang, Z., Shen, Z. J. M., and Sun, F. (2021). Data-driven framework for large-scale prediction of charging energy in electric vehicles. Appl. Energy 282, 116175. doi:10.1016/j.apenergy.2020.116175
DOD Depth of discharge
GAIL Generating adversarial imitation learning
IRL Inverse reinforcement learning
KL Kullback-Leibler divergence
MIC Maximal information coefficient
MSE Mean square error
MAE Mean absolute error
PPO Proximal policy optimization
RMSE Root mean square error
R-Squared Coefficient of determination
SOC State of charge
TRPO Trust region policy optimization
XGboost Extreme gradient boosting algorithm
Keywords: data-driven, charging demand, user strategies, imitative learning, spatiotemporal models
Citation: Li H, Liang D, Zhou Y, Shi Y, Feng D and Shi S (2023) Spatiotemporal charging demand models for electric vehicles considering user strategies. Front. Energy Res. 10:1013154. doi: 10.3389/fenrg.2022.1013154
Received: 06 August 2022; Accepted: 16 September 2022;
Published: 09 January 2023.
Edited by:
Yingjun Wu, Hohai University, ChinaReviewed by:
Yiyan Li, North Carolina State University, United StatesCopyright © 2023 Li, Liang, Zhou, Shi, Feng and Shi. This is an open-access article distributed under the terms of the Creative Commons Attribution License (CC BY). The use, distribution or reproduction in other forums is permitted, provided the original author(s) and the copyright owner(s) are credited and that the original publication in this journal is cited, in accordance with accepted academic practice. No use, distribution or reproduction is permitted which does not comply with these terms.
*Correspondence: Yun Zhou, eXVuLnpob3VAc2p0dS5lZHUuY24=
Disclaimer: All claims expressed in this article are solely those of the authors and do not necessarily represent those of their affiliated organizations, or those of the publisher, the editors and the reviewers. Any product that may be evaluated in this article or claim that may be made by its manufacturer is not guaranteed or endorsed by the publisher.
Research integrity at Frontiers
Learn more about the work of our research integrity team to safeguard the quality of each article we publish.