 Wei Yu
 Xianmin Zhou
- Center for Integrative Petroleum Research (CIPR), College of Petroleum Engineering & Geosciences, King Fahd University of Petroleum and Minerals, Dhahran, Saudi Arabia
The geometric confinement significantly affects the foam coarsening dynamics in porous media. We present the experimental and modeling studies of coarsening-induced foam structural evolution in a porous microfluidic chip. The findings are expected to shed light on predicting the foam structure in many applications, such as foam-assisted enhanced oil recovery process and CO2 geological sequestration. It is shown that, in porous media, small bubbles are constantly consumed by large bubbles due to inter-bubble gas diffusion until most bubbles grow to the pore or throat size. The coarsening of edge bubbles (bubbles contacting the boundary) dominates the foam coarsening process, showing a linear increase in the average area of edge bubbles with time in a steady-state growth state. A mass transfer model is proposed to fit the foam coarsening rate of edge bubbles, including critical parameters such as liquid film permeability, gas-liquid interfacial tension, the molar volume of the dispersed phase, and the polydispersity of bubble size distribution. We emphasize that, under the same experimental conditions, foams with a broader size distribution exhibits a faster coarsening rate due to higher capillary pressure differences among the bubbles as the mass transfer driving force.
Introduction
Foam in porous media is involved in many natural and indusial applications, such as the distribution of non-aqueous pollutants in soil (Philippe et al., 2020), foam-assisted enhanced oil recovery (EOR) (Talebian et al., 2014), and CO2 storage in the underground stratum of porous rocks (Føyen et al., 2020). Coarsening or Ostwald ripening is significant to the structure evolution and phase distribution of foam in these systems, where a large number of bubbles are trapped in microscale pores due to high capillary forces (Yu and Kanj, 2021). During a typical foam coarsening process, gas in bubbles with higher curvature dissolves in the surrounding liquid and diffuses into bubbles with lower curvature to grow them. This mass transfer process results from the capillary pressure or chemical potential differences between neighboring bubbles (Saint-Jalmes and Langevin, 2002).
The coarsening mechanisms of foams in an open system without the interference of geometric confinement have been extensively studied. Various studies have shown that, in a steady-state growth region, the average bubble area of foam with a negligible liquid fraction (dry foam),
In a foam bounded by a solid wall, bubbles are characterized topologically into edge bubbles (E-bubbles), which are in contact with the wall, and inner bubbles (I-bubbles), which are surrounded by other bubbles. When the average bubble size is much smaller than the size of the geometric confinement (I-bubbles dominating), the wall effect on foam coarsening is insignificant and the foam coarsening kinetics still follow von Neumann’s law as the bulk foam in an open system (Fortes et al., 1999; Rosa and Fortes, 1999). When the bubble sizes are smaller than but near the size of the geometric confinement, the wall effect starts showing. This state is of specific interest to foams generated in the porous media, such as in EOR and CO2 geological sequestration, because of the foam generation mechanisms (Rossen, 2003).
When the bubble size approaches the size of the geometric confinement, E-bubbles dominate the bubble population in foams. Rosa et al. first described the topological properties of E-bubbles in a confined geometry using the number of bubbles adjacent to an E-bubble, e (Rosa and Fortes, 1999). They concluded the coarsening rate of E-bubbles increases linearly with time if the average number of neighbors of E-bubbles
Here, we present experimental and modeling studies of foam coarsening kinetics in porous media using a high-pressure and high-temperature microfluidic system. A mass transfer model is established to describe the foam coarsening dynamics in porous media, which involves the critical experimental parameters and the bubble size distribution of foams. The results are applicable to predict the foam structure in underground hydrocarbon reservoirs and deep saline aquifers for CO2 storage where the capillary forces dominate.
Experimental methods
Materials
10 mmol/L sodium dodecyl sulfate (SDS, Sigma Aldrich) dissolved in deionized water was used as the surfactant solution to generate foams. N2 (99.99%) produced by Saudi Industrial Gas Company LTD. (Dammam, KSA) was used as the dispersed phase. A Theta Flex Optical Tensiometer (Biolin Scientific, Finland) was used to measure the interfacial tension between the surfactant solution and the gas. The microfluidic chip (micromodel) was prepared from borosilicate glass by a standard acid etching technique. The pore bodies are 75–90 μm in radius and are connected randomly by throats with widths of 30–50 μm. The depth of the pores and throats is 20 μm, and the overall etched area measures 30 mm × 45 mm. The micromodel’s inner surface measures a water-glass-N2 contact angle of 40°. Figure 1A shows the glass micromodel’s overall structure in this work.
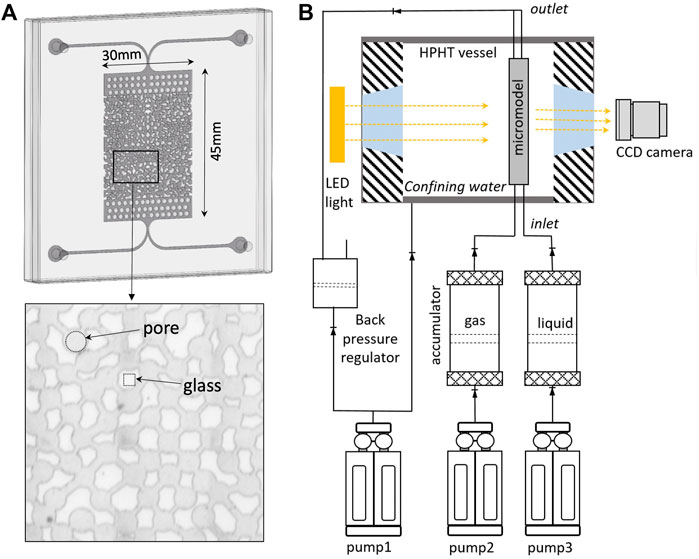
FIGURE 1. (A) Structure of the micromodel. (B) Schematic of the experimental set-up.
Experimental set-up and procedures
The schematic of the experimental set-up is shown in Figure 1B. The micromodel was first bounded with a cover plate using a silicone sealant and fitted into a stainless-steel holder. Then the micromodel and the holder were fixed vertically into a high-pressure and high-temperature (HPHT) vessel with inlets connected to the pumps and outlets connected to a back pressure regulator. The HPHT vessel was filled with water by which the confining pressure was exerted using a high-pressure metering pump (Vindum Pump, VP-250K). The confining water pressure outside the micromodel was 7 MPa higher than the pore pressure for all experiments. The temperature was maintained by a heating jacket with an accuracy of ±0.1°C.
The micromodel was first filled with the surfactant solution. The foam was generated by co-injecting two phases into the porous media at a gas flow rate of 50 μL/min and a liquid flow rate of 5 μL/min using two high-pressure metering pumps (Vindum Pump, VP-20K). The micromodel was sealed off once the stable foam was generated. A high-resolution CCD camera (Allied Vision, Manta G-1236B) mounted with a microscopic lens (K2 DistaMax lens, Infinity Photo-optical Company) was used to capture the time-lapse images in the micromodel. Imaging was focused on the center of the micromodel to avoid entry/exit effects. Record of the foam images started within seconds of foam generation in the porous media.
Image analysis methods
The captured images were analyzed by MATLAB 2020 and ImageJ software to obtain the evolution of the bubbles’ size distribution. For each experiment, 800–1,000 bubbles were counted for statistical representation. Bubbles in the micromodel are considered discs of fixed height that equals the pore depth. The average bubble area
Theory
Here, we develop a mass transfer model to predict the foam coarsening rate involving the critical physical parameters and the statistic of bubble size distribution. The following assumptions are rested on to achieve a simplified but useful model. 1) There is no bubble coalescence during the coarsening process. This is true according to the experimental observations in the micromodels (Supplementary Video S1 in Supplementary Material). 2) Total gas and liquid volume are constant, with no flow or gravity effect. 3) Bubbles are seen as circular discs with the same depth. The bubble radius is defined as the radius of a circle with the equivalent area to the actual bubble, as shown in Eqs 1, 2.
This model is based on a physical mechanism for foam coarsening and was first described by de Vries (1972) and Lemllch (1978). The coarsening behavior of the foam can be represented by the collective behavior of any bubble of radius r (m). Similar to the coarsening process in an open system, their inner pressure differences drive the mass diffusion among bubbles. The pressure difference between a bubble and its neighbors can be defined using the average bubble size
Based on Fick’s law of diffusion and Henry’s law of phase equilibrium, the rate of the change of the bubble’s area is given by:
where κ (m2/s) is the mass transfer coefficient of the liquid film, D (m2/s) is the gas diffusion coefficient in the liquid phase. H (mol/Pam3) is Henry’s law constant of gas in the liquid, representing the gas solubility. P (Pa) is the gas pressure, R (J/molK) is the universal gas constant, and T (K) is the temperature. δ (m) is the average liquid film thickness, which can be correlated with foam quality, ε, using an empirical equation that involves the Sauter mean radius of the bubbles in the foam, r32 (Stevenson, 2010).
In this work,
Here we introduce λ (≤1) to correct the mass transfer area due to the blocking effect of the geometric confinement, which is correlated with the relative bubble size to the pore size. When the bubble size is smaller than half of the geometry size, λ ∼ 0.5 (Fortes et al., 1999).
According to von Neumann’s law, for foam in an open system, bubbles with less than six sides shrink, and bubbles with more than six sides grow. Therefore, the average number of bubbles lost per unit time in an open system is the area lost by three-, four-, and five-sided bubbles per unit time divided by their mean areas (Glazier and Stavans, 1989; Fortes, 1994). Analogically, for the foam in porous media, the number of bubbles lost per unit time can be calculated by the area lost by bubbles that are smaller than the average divided by their mean areas:
where
Since,
Combing Eqs 4, 6, 7, one finds:
It is useful to define a proper statistical indication to characterize the bubble volume distribution. He we introduce,
So,
The modified version of von Neumann’s law leads to the same result for the power law with the coarsening rate of
Results
Figure 2 shows a typical foam coarsening response of foams trapped in porous media at pore pressure of 11.45 MPa and 22°C where N2 and 10 mM SDS solution were used as the gas phase and the liquid phase, respectively. Microscopic images of foam shown in Figures 2A–C at coarsening times of 0, 2 h, and 10 h illustrate different coarsening stages of foam. Initially, the fresh foam shows a pattern of bubbles closely packing in the pores with a narrow size distribution, where most bubbles (∼90%) sit in the range of 20–50 μm in radius. As the foam coarsens, small bubbles are constantly consumed by large bubbles in a single pore body until the larger bubbles grow to the pore size. The statistics of bubble size distribution from Figure 2D show that as coarsening proceeds, the peak of the size distribution shifts to a larger radius. After 10 h of coarsening, the bubble size shows a bimodal distribution with 30% trapped in the pore bodies and 45% trapped in the pore throats. A similar phenomenon has been observed by Jones et al. (2018) A video capturing the foam coarsening process can be found in the Supplementary Material.
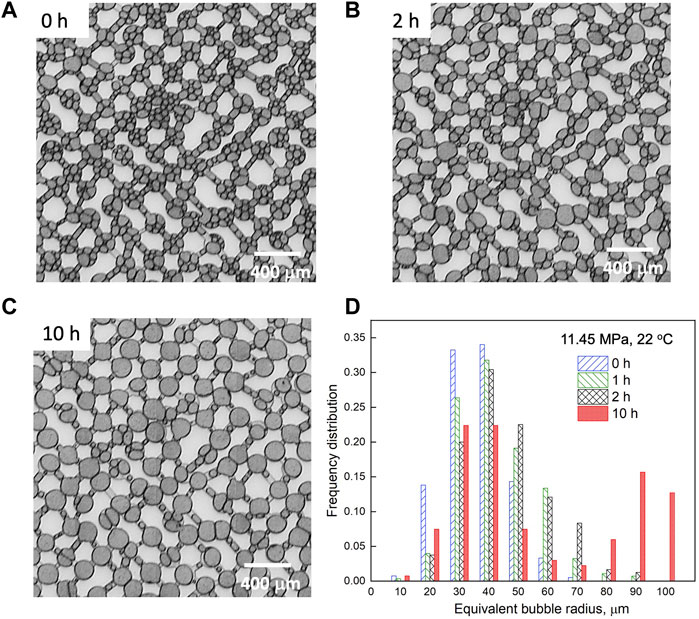
FIGURE 2. Microscopic images of bubbles in a micromodel at coarsening time of (A) 0 h, (B) 2 h, and (C) 10 h (D) Evolution of bubble size distribution at coarsening times of 0, 1, 2, and 10 h. Pore pressure = 11.45 MPa and temperature = 22°C. The gas fraction is 95%.
One important question is how fast the foam coarsening rate is in porous media. The increasing rate of the average bubble area <a> with time is used to describe the foam coarsening rate quantitatively. We previously reported that the average bubble size <a> shows a long-term linear increase with time in a steady-state growth region where the average bubble size falls between 1/5 and 1/2 the average pore size, corresponding to the edge bubble dominating region (Yu et al., 2022). The effects of gas-liquid interfacial tension, gas solubility in the liquid phase, pressure, temperature, and liquid fraction on foam coarsening dynamics have been systematically studied with the original size distribution of foam being constant. In this work, we found that besides the aforementioned factors, the bubble size distribution contributes significantly to the foam coarsening dynamics in porous media.
Figure 3A shows results of
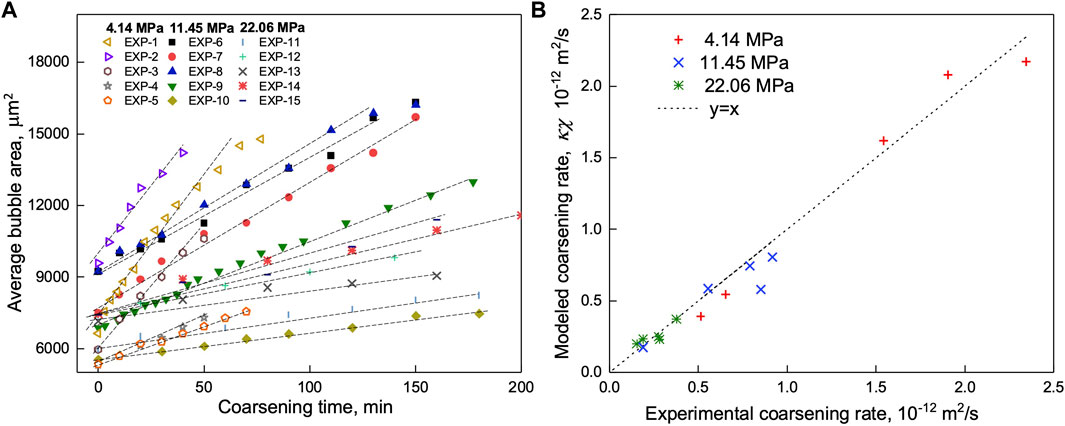
FIGURE 3. (A) Average bubble area as a function of time for fifteen experiments. (B) Comparison between the modeled and experimental foam coarsening rates.
The mass transfer model proposed in this work couples the physical mass transfer coefficient and the bubble size distribution to calculate the foam coarsening rate. To validate the derived mass transfer models, the coarsening rate of fifteen independent experiments,
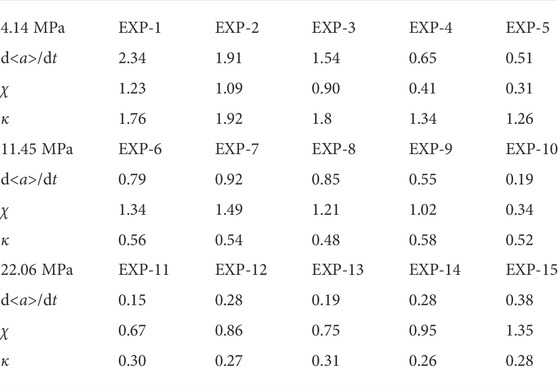
TABLE 1. Foam coarsening rate, d<a>/dt (10–12 m2/s), polydispersity of bubble size distribution, χ, and mass transfer coefficient, κ, ((10–12 m2/s) for the fifteen experiments shown in Figure 3A.
It is proposed to use the average bubble sides of edge bubbles,
Discussion
We emphasize that the foam coarsening rate in porous media is not only determined by physical factors such as pore pressure, temperature, interfacial tension, etc., but also by the morphology of foams. The foam with a more uniform bubble size distribution (small polydispersity index) shows a lower coarsening rate. That is, gas bubbles with a broader size distribution trapped in porous media will evolve faster into larger bubbles if all other conditions hold. This coarsening process is driven by the capillary pressure difference, a function of the bubble size distribution. For example, foams generated in higher pressure could exhibit a higher coarsening rate because of a higher polydispersity of bubble size distribution. A similar anticoarsening phenomenon was studied by experiments and models, indicating the effect of bubble size distribution on the gas diffusion process among them (Xu et al., 2017).
Based on our experiments and models, the coarsening effect significantly changes the structure of foams from a few minutes to tens of hours. In foam assisted EOR process, where the time scale for foam injection lasts from months to years, the structural evolution of foams is critical to their conformance control performance in heterogeneous reservoirs and will influence the oil recovery efficiency. In CO2 geological sequestration processes in depleted oil reservoirs or deep saline aquifers, the evolution of CO2 bubbles involves a much longer time scale, from decades to centuries. Understanding the coarsening effect of CO2 bubbles or droplets is of great significance for better evaluating CO2 capillary trapping efficiencies.
However, it should be noted that the model presented here is based on the foams trapped in homogeneous porous media with circular bubbles. Therefore, the modifications should be introduced when the bubbles are in irregular shapes, which the irregular pores could distort. More data on foam coarsening in porous media can be collected through various experimental methods such as μCT and microfluidics. In addition, if there is significant gas dissolution or flow occurs, all diffusion-related calculations should be rederived.
Conclusion
In summary, we visualize the foam coarsening process in a 2D glass micromodel patterned with a pore-throat network in a high-pressure and high-temperature microfluidic system. In the edge bubble-dominated process, a steady-state growth region is reached when the average bubble size falls between 1/5 and 1/2 the average pore size, and the average bubble size increases linearly with time. We establish a mass transfer model to successfully predict the coarsening rate of foam trapped in porous media based on Fick’s law of diffusion involving critical parameters such as interfacial tension, pore pressure, temperature, liquid fraction, and the polydispersity of the bubbles. The modeled results have shown a good fit with the experimental data. The conclusion will shed light on the studies of multiphase behaviors in underground hydrocarbon reservoirs and deep saline aquifers for EOR and CO2 sequestration.
Data availability statement
The raw data supporting the conclusion of this article will be made available by the authors, without undue reservation.
Author contributions
WY conceptualized the idea, conducted the experiments and, compiled the manuscript. XZ supported the experimental study.
Acknowledgments
We thank Zhengwei Pan and Yafei Chen for their assistance in the experiments. We thank Jack Lo for his assistance in image analysis and Gang Lei for his help in the theory validation.
Conflict of interest
The authors declare that the research was conducted in the absence of any commercial or financial relationships that could be construed as a potential conflict of interest.
Publisher’s note
All claims expressed in this article are solely those of the authors and do not necessarily represent those of their affiliated organizations, or those of the publisher, the editors and the reviewers. Any product that may be evaluated in this article, or claim that may be made by its manufacturer, is not guaranteed or endorsed by the publisher.
Supplementary material
The Supplementary Material for this article can be found online at: https://www.frontiersin.org/articles/10.3389/fenrg.2022.1012728/full#supplementary-material
References
De Chalendar, J. A., Garing, C., and Benson, S. M. (2018). Pore-scale modelling of Ostwald ripening. J. Fluid Mech. 835, 363–392. doi:10.1017/jfm.2017.720
de Vries, A. J. (1972). “Morphology, coalescence and size distribution of foam bubbles,” in books.google.com. Editor R. Lemlich (New York: Academic Press).
Fortes, M. A., Rosa, M. E., and Findlay, S. (1999). Properties of peripheric cells in cellular structures. Philos. Mag. A 79, 1853–1869. doi:10.1080/01418619908210396
Fortes, M. A. (1994). Grain growth controlled by triple junctions: Effect of number of topological elements. Interface Sci. 2 (2), 183–191. doi:10.1007/BF01184512
Føyen, T., Brattekås, B., Fernø, M. A., Barrabino, A., and Holt, T. (2020). Increased CO2 storage capacity using CO2-foam. Int. J. Greenh. Gas Control 96, 103016. doi:10.1016/j.ijggc.2020.103016
Glazier, J. A., and Stavans, J. (1989). Nonideal effects in the two-dimensional soap froth. Phys. Rev. A . Coll. Park. 40, 7398–7401. doi:10.1103/PhysRevA.40.7398
Hilgenfeldt, S., Koehler, S. A., and Stone, H. A. (2001). Dynamics of coarsening foams: Accelerated and self-limiting drainage. Phys. Rev. Lett. 66, 4704–4707. doi:10.1103/PhysRevLett.86.4704
Jones, S. A., Getrouw, N., and Vincent-Bonnieu, S. (2018). Foam flow in a model porous medium: I. The effect of foam coarsening. Soft Matter 14, 3490–3496. doi:10.1039/c7sm01903c
Magrabi, S. A., Dlugogorski, B. Z., and Jameson, G. J. (1999). Bubble size distribution and coarsening of aqueous foams. Chem. Eng. Sci. 54, 4007–4022. doi:10.1016/S0009-2509(99)00098-6
Philippe, N., Davarzani, H., Colombano, S., Dierick, M., Klein, P. Y., and Marcoux, M. (2020). Experimental study of the temperature effect on two-phase flow properties in highly permeable porous media: Application to the remediation of dense non-aqueous phase liquids (DNAPLs) in polluted soil. Adv. Water Resour. 146, 103783. doi:10.1016/J.ADVWATRES.2020.103783
Rosa, M. E., and Fortes, M. A. (1999). Coarsening of two-dimensional foams confined by walls. Philos. Mag. A 79, 1871–1886. doi:10.1080/01418619908210397
Rossen, W. R. (2003). A critical review of Roof snap-off as a mechanism of steady-state foam generation in homogeneous porous media. Colloids Surfaces A Physicochem. Eng. Aspects 225, 1–24. doi:10.1016/S0927-7757(03)00309-1
Saint-Jalmes, A., and Langevin, D. (2002). Time evolution of aqueous foams: Drainage and coarsening. Journal of Physics Condensed Matter 14(40): 9397. doi:10.1088/0953-8984/14/40/325Available at: http://iopscience.iop.org/0953-8984/14/40/325.
Stevenson, P. (2010). Inter-bubble gas diffusion in liquid foam. Curr. Opin. Colloid Interface Sci. 15, 374–381. doi:10.1016/j.cocis.2010.05.010
Talebian, S. H., Masoudi, R., Tan, I. M., and Zitha, P. L. J. (2014). Foam assisted CO2-EOR: A review of concept, challenges, and future prospects. J. Pet. Sci. Eng. 120, 202–215. doi:10.1016/j.petrol.2014.05.013
Xu, K., Bonnecaze, R., and Balhoff, M. (2017). Egalitarianism among bubbles in porous media: An Ostwald ripening derived anticoarsening phenomenon. Phys. Rev. Lett. 119, 264502. doi:10.1103/PhysRevLett.119.264502
Yu, W., and Kanj, M. Y. (2021). Review of foam stability in porous media: The effect of coarsening. J. Pet. Sci. Eng. 208, 109698. doi:10.1016/J.PETROL.2021.109698
Keywords: foam coarsening, porous media, microfluidic, mass transfer model, CO2 storage
Citation: Yu W and Zhou X (2022) Experimental and modeling study of foam coarsening kinetics in porous media. Front. Energy Res. 10:1012728. doi: 10.3389/fenrg.2022.1012728
Received: 05 August 2022; Accepted: 03 October 2022;
Published: 01 November 2022.
Edited by:
Tao Wang, Zhejiang University, ChinaCopyright © 2022 Yu and Zhou. This is an open-access article distributed under the terms of the Creative Commons Attribution License (CC BY). The use, distribution or reproduction in other forums is permitted, provided the original author(s) and the copyright owner(s) are credited and that the original publication in this journal is cited, in accordance with accepted academic practice. No use, distribution or reproduction is permitted which does not comply with these terms.
*Correspondence: Wei Yu, eXV3ZWk4ZXJpY0BnbWFpbC5jb20=