- 1NARI School of Electrical and Automation Engineering, Nanjing Normal University, Nanjing, China
- 2Jiangsu Provincial Integrated Gas-Electricity Interconnection Energy Laboratory, Nanjing, China
- 3International Joint Laboratory of Integrated Energy Equipment and Integration in Jiangsu Province, Nanjing, China
- 4Institute of Energy Storage Technology, Nanjing Normal University, Nanjing, China
Integrated energy systems (IESs) are developing rapidly as a supporting technology for achieving carbon reduction targets. Accurate IES predictions can facilitate better scheduling strategies. Recently, a newly developed unsupervised machine learning tool, known as Generative Adversarial Networks (GAN), has been used to predict renewable energy outputs and various types of loads for its advantage in that no prior assumptions about data distribution are required. However, the structure of the traditional GAN leads to the problem of uncontrollable generations, which can be improved in deep convolutional GAN (DCGAN). We propose a two-step prediction approach that takes DCGAN to achieve higher accuracy generation results and uses a K-means clustering algorithm to achieve scenario reduction. In terms of scheduling strategies, common two-stage scheduling is generally day-ahead and intraday stages, with rolling scheduling used for the intraday stage. To account for the impacts on the prediction accuracy of scheduling results, Conditional Value at Risk (CVaR) is added to the day-ahead stage. The intra-day prediction process has also been improved to ensure that the inputs for each prediction domain are updated in real-time. The simulations on a typical IES show that the proposed two-step scenario prediction approach can better describe the load-side demands and renewable energy outputs with significantly reduced computational complexity and that the proposed two-stage scheduling strategy can improve the accuracy and economy of the IES scheduling results.
1 Introduction
The IES is an important way of improving energy efficiency through the integrated planning and coordinated operation of multi-energy systems (Wu et al., 2016). Optimal scheduling of IES is a prerequisite for achieving a balance between supply and demand and efficient use of energy in IES with multi-energy coupling characteristics (Xue, 2015; Sun et al., 2018). While the uncertainty is high for multiple sources and loads in IES (Shabanpour-Haghighi and Ali Reza, 2016). Considering this, Accurate predictions can help decision makers to provide more economical scheduling strategies (Patel, 2005; Holttinen et al., 2007; Wu et al., 2012; Hu and Li, 2019), and they can also achieve more consumption of renewable energy (Yang et al., 2022).
Existing scenario generation methods are mainly model-driven and data-driven. The former contains many classic methods. A. Shamshad et al. (2005) used first and second-order Markov chains for wind speed scenario generation. Wu et al. (2007) used Monte Carlo methods to construct scenario trees for generation units and load prediction. The time series method is also a widely used technique for scenario generations. Morales et al. (2010) used the autoregressive moving average (ARMA) model to generate spatio-temporal scenarios with a given generation profile by assuming a linear correlation of the wind samples. Díaz et al. (2016) studied ARIMA models in state space (SS) and then extended the SS models to include correlated wind speeds at different locations. The method was enhanced by using an artificial neural network with a normal distribution approximation to capture non-linear dependencies and create representative scenarios (Vagropoulos et al., 2016). Although easy to implement, with simple statistical assumptions, model-driven methods are prone to over-fitting. And the above methods use historical data to build probability models that follow particular distributions and combine them with sampling methods to obtain the generated scenarios. This may limit the variety of scenarios generated and is not compatible with the actual complex application environment.
In recent years, data-driven methods have developed rapidly. They mainly utilize deep learning algorithms, and the development of artificial intelligence techniques allows data-driven scenario generation methods to describe the uncertainties of energy sources and loads more realistically (Chen Q et al., 2019; Cheng et al., 2021; Guo L. N et al., 2021). A radial basis function neural network algorithm was combined with a particle swarm optimisation approach to generate scenes using numerical weather forecasts as input (Sideratos and Hatziargyriou, 2012). Liao et al. (2022) redesigned the structure and parameters of the original pixel convolutional neural network and obtained more accurate prediction results. Li et al. (2022) combined back propagation neural networks with an improved particle swarm algorithm to develop a prediction method for electricity consumption. Compared to model-driven methods, data-driven methods can better characterize integrated energy systems. However, the performance of these methods relies on a careful selection of input features and is therefore not sufficiently flexible and reliable in practice (Cheng and Yu, 2019).
Another data-driven method is based on generative adversarial networks (GAN) (Goodfellow et al., 2014), which is known as a set of innovative generative models for reproducible scenario generation and has received a lot of attention in recent years. GAN was proposed in 2014 (Goodfellow et al., 2014). It was first used for image recognition but has recently also shown great results in the prediction of sources and loads for integrated energy systems (Lei et al., 2021; Hu et al., 2021). Chen Y et al. (2019) used GAN to generate scenarios of real wind and photovoltaic (PV) power distributions without complex statistical assumptions and sampling. Dong et al. (2022) used GAN to generate renewable energy scenarios with high accuracy. Chen Y et al. (2018) proposed a Bayesian GAN to successfully capture different patterns of historical data. Compared with other data-driven methods, these GAN-based ones can provide a more accurate generation process by reflecting the dynamic characteristics of energy resources with a full diversity of patterns (Dong et al., 2022).
Although a GAN-based scenario generation method can be applied to different situations easily, the problems of training difficulties, pattern collapse, and uncontrollable generated scenarios still arise in applications (Radford et al., 2016). Deep convolutional GAN (DCGAN) introduces convolutional generative networks, which has greatly improved network stability, convergence speed, and generated data quality (Radford et al., 2016; Wang and Liu, 2020).
On the other hand, the plenty of scenarios generated by the above methods become redundant initial inputs, significantly increasing the solution complexity and computational burden (Li et al., 2016; Hu et al., 2019). To reduce the number of scenarios generated, Lin et al. (2022) developed a multi-scenario stochastic programming model. Heitsch and Römisch, 2003 proposed simultaneous backward approximation and fast forward selection based on probabilistic distances. However, the time complexity of such methods is at least proportional to the problem size, and the computational cost is enormous when the number of original scenarios is large. When processing sources and loads data of IES, Clustering and scenario reduction are very similar in basic ideas (Kwedlo and Łubowicz, 2021). The K-means clustering algorithm is an unsupervised learning algorithm and its computational complexity is not as sensitive to the size of the original scenario as traditional scenario reduction methods (Wang et al., 2018; Niu et al., 2021). Li et al. (2021) performed a clustering analysis of PV output based on this method, which effectively achieved scene reduction and improved prediction accuracy.
Meanwhile, the two-stage scheduling (day-ahead and intraday scheduling) approach is commonly used in cases such as electricity markets and optimal scheduling (Handschin and Slomski, 1990; Guo S et al., 2021; Cheng L. F et al., 2022). Zhou et al. (2016) investigated the scheduling method for aggregators to arbitrage in the intraday electricity market by using trading data from the day-ahead electricity market. Li and Zhang, 2021 used a multi-time scale model for day-ahead and intraday prediction of PV outputs. Cheng L. F et al. (2022) proposed a new dynamic robust optimisation scheduling strategy for coordinated microgrid operations, including both day-ahead scheduling scales and intraday scheduling scales. Yang et al. (2022) proposed a hierarchical rolling scheduling model.
All of the above studies have verified the feasibility and economy of two-stage scheduling through specific examples, but these scenarios are focused on power systems and rarely appear in IES. The uncertainties of sources and loads are even greater in IES, and even if the prediction accuracy can be improved, for example through the two-step prediction approach proposed in this paper, the design of the objective function requires further thought. Considering this, we introduce the Conditional Value-at-Risk (CVaR) (Asensio and Contreras, 2016; Cheng Z. P et al., 2022) into the objective function of the day-ahead stage to quantify the risk associated with uncertainties.
To reduce the errors between the generated scenarios and the actual scenarios and to ensure the economy and reliability of the IES scheduling plan, we proposed a two-stage optimisation strategy combined with the traditional ones. The strategy takes into account the risks at the day-ahead stage, dynamically adjusts the intraday state based on the day-ahead scenario information and uses a scheduling plan to improve the accuracy of the optimisation results and further match the actual scenario requirements.
The main contributions are as follows:
•A two-step prediction approach that takes DCGAN to achieve higher accuracy in generation results and that uses a K-means clustering algorithm to for scenario reduction is proposed. DCGAN can describe the uncertainties of sources and loads through unsupervised learning more realistically. It also solves the problems of training difficulties and pattern collapse that occur in GAN in data training. The K-means clustering algorithm effectively overcomes the shortcomings of some reduction methods that are sensitive to the size of the original scenario and better achieves a trade-off between computation time and solution accuracy. The scenario prediction approach proposed in this paper combines scenario generation and scenario reduction and achieves accurate prediction results.
•A two-stage IES scheduling strategy that considers multiple energy flows on day-ahead and intraday is developed. In the day-ahead scheduling stage, the CVaR was introduced for risk consideration. The intraday stage enables intraday rolling optimisation based on the results of day-ahead scheduling. This approach effectively reduces errors in the prediction of IES sources and loads due to the single day-ahead scheduling, improving the accuracy of IES scheduling results while reducing system scheduling costs.
2 Two-step scenario prediction approach
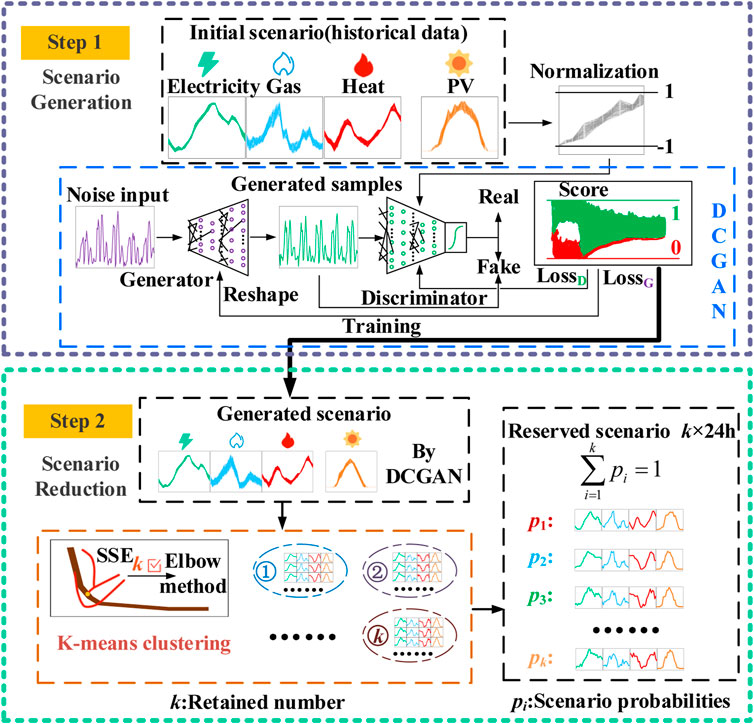
Scenario prediction provides the data basis for scenario reduction, with the objective function is the optimisation of the generated data. The proposed scenario prediction approach first develops a step of DCGAN-based scenario generation, followed by a step of a K-means clustering algorithm-based scenario reduction step. Scenario reduction optimises the scenario generation with the highest scenario retention as the optimisation goal. The prediction method ensures that the reduced scenario set learns sufficiently about the implicit distribution of the historical real data set under the interaction of multiple non-linear factors, while significantly reducing the computational cost. The overall flow of the scenario prediction is shown in Figure 1.
2.1 Step 1: Scenario generation by deep convolutional GAN
The scenario generation stage feeds the historical dataset into DCGAN for the generation of scenarios. DCGAN is improved from GAN. GAN, which was proposed in 2014 and was initially used in the field of image recognition, is inspired by the zero-sum game in game theory. The two sides of the game are the generator (G) and the discriminator (D) (Lin et al., 2022). The generator simulates the generation of new data samples by learning the underlying distribution of real data. The discriminator is used to determine as accurately as possible whether the input data is real data or fake data generated by the generator. The game is played until G and D reach a “Nash equilibrium”. However, the discriminator is not able to determine whether the generator is generating the specified data as the generator’s generation content cannot be controlled, making it prone to problems such as pattern collapse and uncontrollable generation process during training (Dong et al., 2022). To address this problem, DCGAN introduces convolutional neural networks in the generators and discriminators of the GAN to replace the multi-layer perceptron in the GAN. This improves the effectiveness of the generator in generating data and the ability of the discriminator in discriminating data, and DCGAN can learn the mapping relationships between noise distributions that satisfy the conditions and the real data training set (Iliyasu and Deng, 2020).
In the proposed DCGAN, we use a two-part alternating optimisation procedure in its training process, which can be understood as a maximum-minimum optimisation problem. The first part maximises
where
The scenario generation network is trained by gaming the generators and discriminators of DCGAN. The network learns the implicit patterns in historical datasets and generates generative datasets judged to be “true,” which can be used to simulate electricity, gas and heat loads and PV outputs. This provides a rich and reliable collection of data for subsequent IES scheduling plans.
2.2 Step 2: Scenario reduction by K-means clustering
The computation of DCGAN-generated scenarios increases exponentially with the size of the scenario, so scenario reduction is performed at this stage to reduce the computation of subsequent scheduling. The K-means clustering method continuously computes the shortest distance from each sample point to the centre of mass by iteration, updating the position of the centre of mass so that the loss function corresponding to the clustering result is minimised. The loss function is defined as the sum of squares of the errors from the sample points to the centre of mass SSE, representing the superiority or inferiority of the clustering effect.
where
The Elbow Method, which is easy to implement and effective, is adopted to confirm the number of K-means clustering centres (Chen Q et al., 2019). All scenarios are classified into k categories. The attributes and characteristics of the reduced data scenarios are significantly different. The probability of each scenario after reduction is the number of scenarios in the category divided by the total number of scenarios.
3 Two-stage scheduling objective
Typical components in an IES are shown in Figure 2. As can be seen, there are multiple sources and multiple loads in the IES, which is more complex than the power systems. The source side includes electricity and natural gas, and the load side includes electrical, gas and thermal loads. New energy generation and energy storage are also considered.
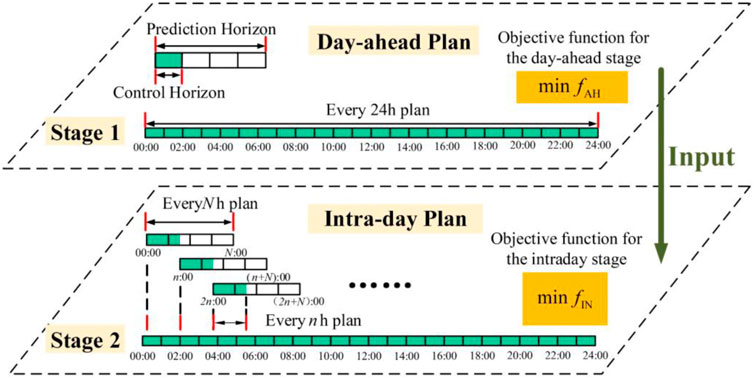
Figure 3 demonstrates the common two-stage scheduling structure. Day-ahead and intraday stages are considered for scheduling IES resources and economic scheduling models are developed. The day-ahead plan is based on a 24-h scheduling cycle with a 1-h time scale. Considering that the uncertainties of scenario prediction can have an impact on the economy of IES scheduling, the day-ahead plan combines CVaR to optimise the economics of the next day’s integrated energy system to determine the day-ahead prediction results. However, due to prediction errors, it is often difficult to meet the actual energy demand of customers before the day plan. In the intraday stage, the intraday rolling optimisation method based on DCGAN predictions is used to correct the day-ahead plan for equipment outputs. The prediction horizon is Nh, and the control horizon is nh (i.e., in a single prediction, the equipment output schedule for the next N hours is optimised by predicting the loads and outputs for the next N hours, but only the outgoing arrangements for n momentary points will be implemented). The day-ahead stage is used as the initial input to the intraday stage, and the intraday stage corrects the day-ahead stage. The two-stage optimisation process for the day-ahead and intraday stages is shown in Figure 3.
3.1 Scheduling objective in the day-ahead stage
To achieve better scheduling of the integrated energy system, a day-ahead optimisation model is constructed with the sum of energy purchase cost, operation cost and renewable energy consumption cost as the economic optimisation objective.
where,
CVaR is often introduced into system models for risk management when dealing with optimisation problems that take uncertainties into account, such as in power systems. The CVaR quantifies the worst-case tail loss, i.e., the expected loss over the value at risk (Fu et al., 2020). Due to the large errors in day-ahead scheduling, CVaR is introduced in this paper to quantify the risk posed to IES scheduling in the presence of the uncertainties of sources and loads. The objective function is as follows.
where,
Eq. 4 can be transformed into:
where,
According to the components considered in Figure 2, the constraints for the day-ahead stage include:
where,
3.2 Scheduling objective in the intraday stage
The expression for the integrated energy system intraday optimisation objective function is as follows.
The intraday stage also uses the DCGAN method for scenario generation. The difference is that the intraday scenarios are based on the previous moment’s data as input, and a large collection of historical data is used as a learning sample to generate the next set of scenarios every other moment, moving backward in time window in turn until a set of intraday scenarios is generated. The intraday scenario expressions are as follows.
where,
The components in the IES remain unchanged, so the constraint in Eq. 13 remains the same, i.e., Eqs 7–13.
4 Case study
4.1 Simulation setup
The data of electricity, gas and thermal loads and PV output are chosen (Tian et al., 2019; Chen Y et al., 2018; Chen B. Y et al., 2018). The number of scenarios per arithmetic case is 2,880, and the data is 11,520. The hardware platform used for DCGAN training is an AMD-Ryzen5-5600H CPU and an NVIDIA-GeForce-RTX3050Ti GPU. The DCGAN model uses Tensorflow 2.4.0 as the framework for deep learning. To reduce the time required for scenario generation, the GPU is called upon for efficient parallel computing to increase the efficiency of model training. The scenario generation part is trained by Pycharm calling the virtual environment created in Anaconda, and the scenario reduction part is implemented by Matlab. The prediction domain in intraday rolling optimisation is taken as 4 h and the control domain as 1 h. The confidence level
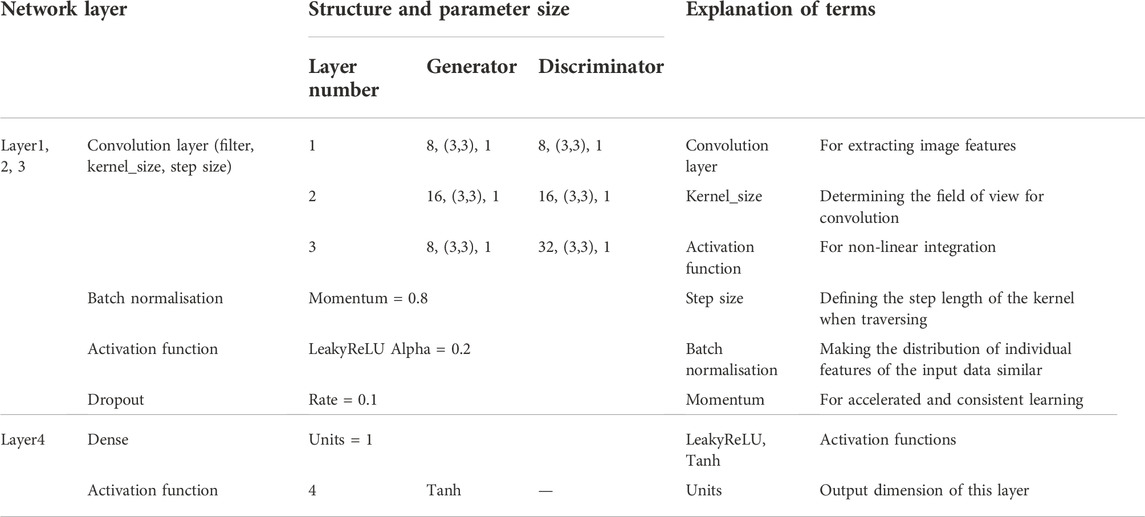
In terms of DCGAN structure parameters, both D and G include three convolutional layers, with a step size of 1 and 7 convolutional kernels. To accelerate convergence and mitigate overfitting, a batch normalisation layer with a momentum of 0.8 is added between the convolution layers. The number of G convolutional layer filters is 80, 60, and 40 in that order, and the number of D convolutional layer filters is 120, 140, and 160 in that order. The activation function for the three convolutional layers of G is ReLU, the activation function for the three convolutional layers of D is LeakReLU, and Tanh is used as the activation function in the final layer. The specific parameter settings of DCGAN are shown in Table 1.
The main economic parameters and equipment parameters involved in the system are shown in Tables 2, 3 respectively.
4.2 Analysis of scenario prediction results
4.2.1 Analysis of prediction results for the day-ahead stage
As shown in Figures 4, 5, the scenarios generated by GAN and DCGAN respectively are retained by K-means clustering. The top part of each subfigure shows the generations, and the bottom part shows the reductions. The number of retained scenarios was determined by the elbow method. The core metric of the elbow method is the sum of the squared errors (SSE), determined by Eq. 2. The elbow method was used on the data generated by GAN and DCGAN, respectively, and the resulting number of cluster centres was both 3. The original 120 days of initial historical data is reduced to three scenarios with probability, and each scenario has significantly different attributes and features after the reduction. The probability values for each of the reduced retained scenarios are shown in Table 4.
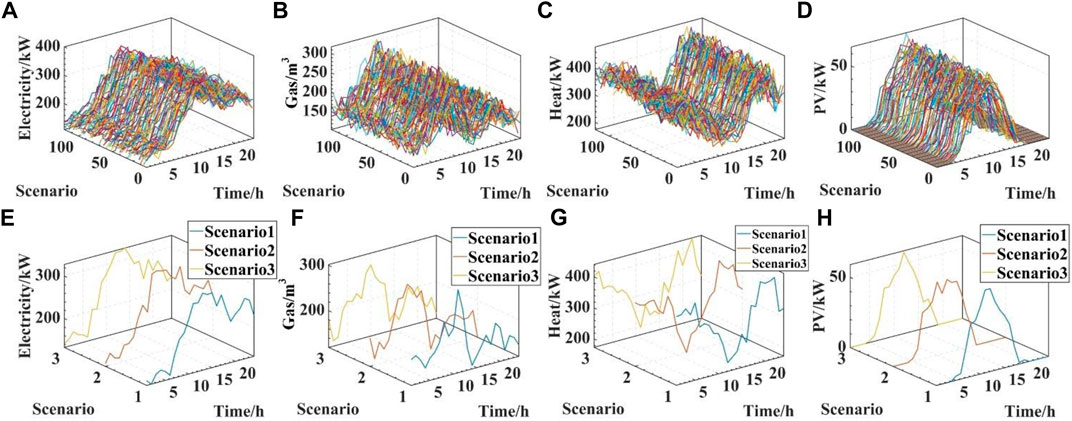
FIGURE 4. GAN-generated scenarios for: (A) electricity loads; (B) gas loads; (C) heat loads; (D) PV outputs; reduced scenarios by K-means clustering in the corresponding GAN-generated scenarios for: (E) electricity loads; (F) gas loads; (G) heat loads; (H) PV outputs.
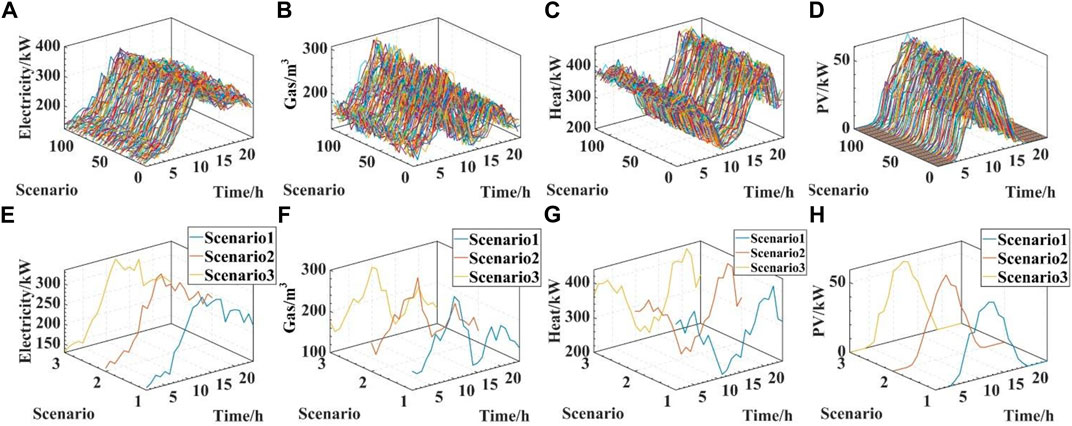
FIGURE 5. DCGAN-generated scenarios for: (A) electricity loads; (B) gas loads; (C) heat loads; (D) PV outputs; reduced scenarios by K-means clustering in the corresponding DCGAN-generated scenarios for: (E) electricity loads; (F) gas loads; (G) heat loads; (H) PV outputs.
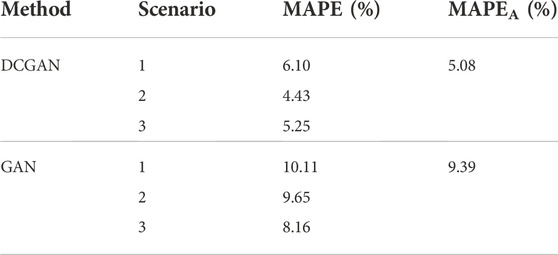
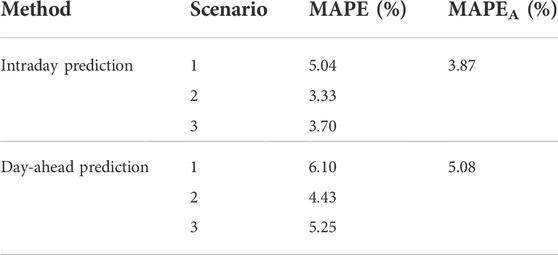
The mean absolute percentage error (MAPE) is chosen as the basis for comparison of the generated and retained scenarios with the actual data. The comparisons of the GAN-generated and DCGAN-generated scenarios with the real scenarios are shown in Figures 6, 7 respectively. As shown in Table 5, Compared to GAN, DCGAN is a more stable method for generating scenarios of sources and loads and can capture a range of iconic features of real scenarios, such as peaks and valleys, distributions, etc., more accurately. MAPEA is calculated from Eq. 15.
Where, pi is the probability of occurrence of the corresponding scenario; MAPEi is the MAPE of the corresponding scenario.

FIGURE 6. Comparisons of the scenarios generated by GAN in the day-ahead stage with the actual scenarios.

FIGURE 7. Comparisons of the scenarios generated by DCGAN in the day-ahead stage with the actual scenarios.
4.2.2 Analysis of prediction results for the intraday stage
Intraday predictions are based on day-ahead predictions. In the two-stage prediction, the first stage involves predicting the input day-ahead scenario to assess uncertainties, and the second stage uses DCGAN to continuously predict shorter intervals of time-based on the day-ahead scenario, with the input of a continuously updated set of day-ahead scenarios for the rolling predictions. The comparisons of the day-ahead and intraday stages’ retained scenarios with the actual scenarios are shown in Figure 8.

FIGURE 8. Comparisons of the day-ahead and intraday stages’ retained scenario with the actual scenario.
In contrast to the day-ahead prediction, which has a 24 h prediction domain, the intraday prediction has a 4 h prediction domain and a 1 h control domain. The intraday prediction uses the prediction domain data as the training set and the control domain results are the intraday prediction results for that hour, rolling the prediction until the 24 h prediction is completed. The difference in time interval
4.3 Analysis of the results of the scheduling operation
4.3.1 Analysis of the results of the day-ahead scheduling stage
In the day-ahead stage, DCGAN and GAN are used for scenario generation respectively, and the retained sources and loads data are weighted by the corresponding probabilities to obtain the scenarios involved in the actual scheduling, and the comparisons of the scheduling results are shown in Figure 9. As can be seen in Figure 9, PV equipment operates between 8:00 and 15:00, taking full advantages of the low O&M costs of PV equipment and increasing PV consumption. Electric boilers are put into use in large numbers at valley time tariffs to meet the larger heat loads in winter. 14:00-23:00 is the peak period for electricity consumption. Considering the peak electric charges and heat load demand, CHP works a lot during this period to meet the larger demand for electric and heat loads at a lower cost. During the day-ahead optimisation stage, the joint scheduling of the power systems, natural gas systems and thermal systems effectively relieves the pressure on the supply-demand balance and increase PV consumption. The differences in predicted data lead to different IES scheduling results. When scheduling based on DCGAN and GAN for scenario prediction respectively, the distribution and peaks of each energy flow are the same, but there are more differences in the scheduling results (especially for electrical energy). The difference between the actual value and the scenario generated by DCGAN is 5.08%, which is less than the error of 8.26% between the scenario generated by GAN and the actual value. Therefore, the scheduling results based on DCGAN for scenario generation are executed in the day-ahead scheduling stage.
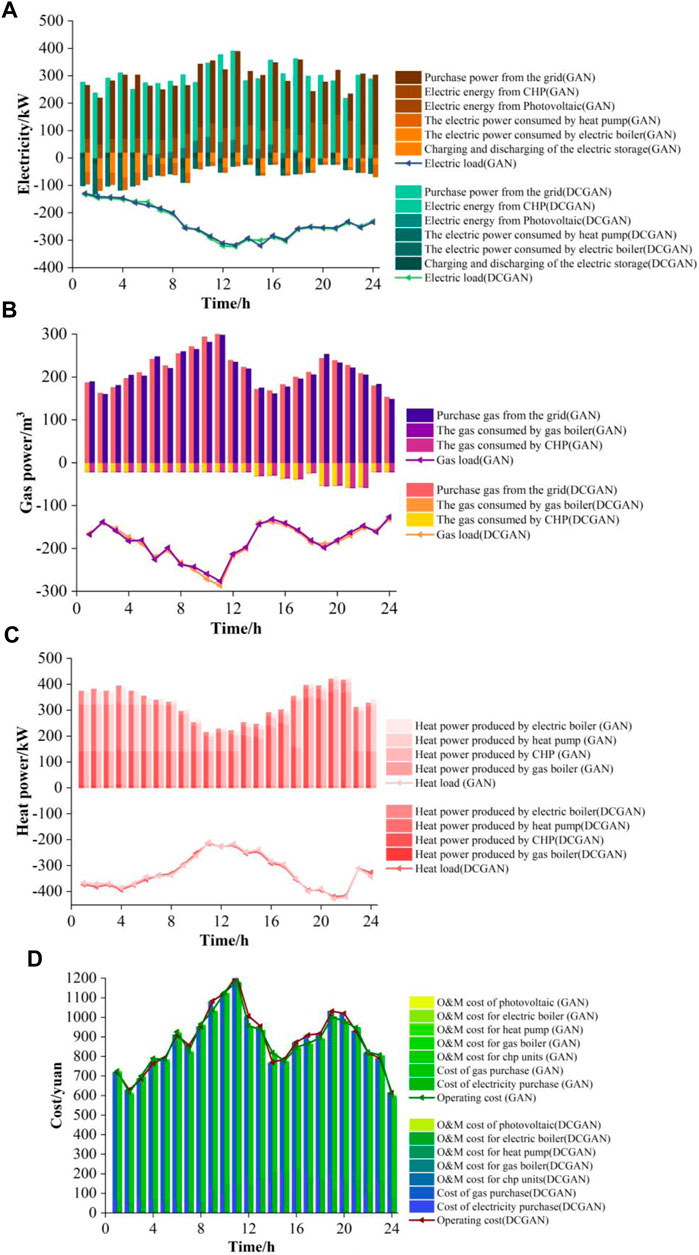
FIGURE 9. Comparisons of day-ahead scheduling results based on DCGAN scenario generation and GAN scenario generation:(A) electricity; (B) natural gas; (C) heat power; (D) cost.
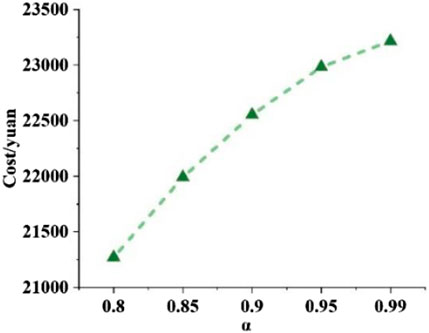
For CVaR, Figure 10 explores the impact of a change in confidence level
Figure 10 shows the impact of different confidence levels on the total cost of ownership. Five scenarios are compared with settings
4.3.2 Analysis of the results of the intraday scheduling stage
In the intraday scheduling stage, 01:00-05:00 of the day is taken as the first Prediction Domain, and the first period, i.e., 01:00-02:00, is selected as the Control Domain, and the data input from 01:00-05:00 is used to develop the scheduling plan in the Prediction Domain, obtain the scheduling plan for that period, and execute the scheduling decisions in the Control Domain only. Scroll to the next period 02:00-06:00, select 02:00-03:00 as the optimisation result for that period, and so on until the operation optimisation is completed, and obtain the scheduling decision for the whole period of that day. The scheduling results for electricity, gas and heat for the intraday stage of the IES are shown in Figure 11.
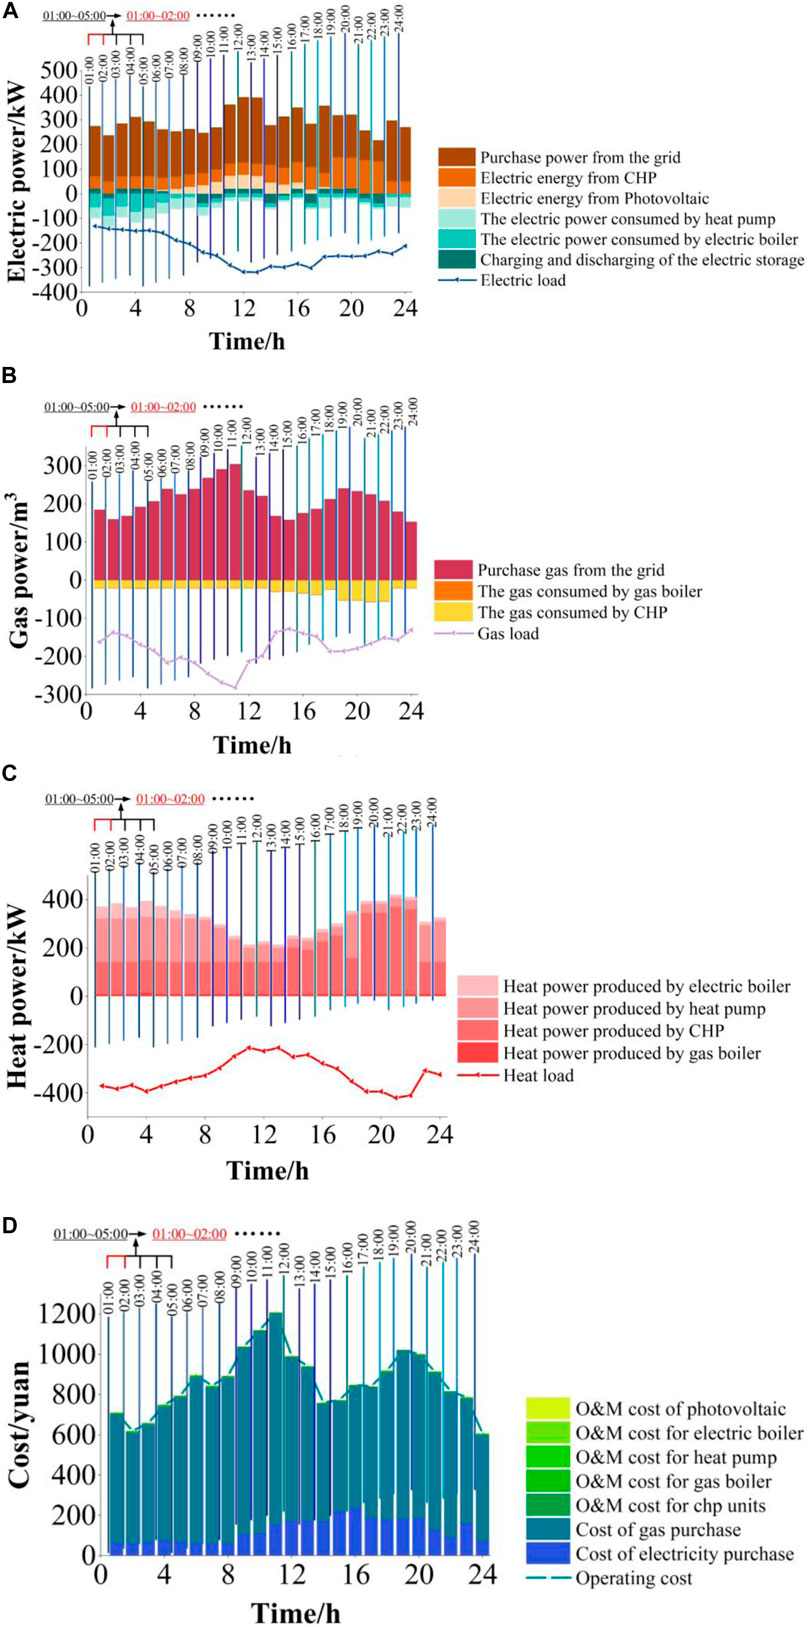
FIGURE 11. Scheduling results for the intraday stage of the IES: (A) electricity; (B) natural gas; (C) heat power; (D) cost.
The multi-energy flow scheduling in both day-ahead planning and intraday scheduling is on an hourly time scale, but the intraday prediction is more accurate than the day-ahead prediction, so the day-ahead scheduling instructions have been amended. The different scheduling strategies of the decision-makers result in different scheduling costs. The total cost of the two-stage rolling scheduling is 20,756.24yuan, which is 8.66% less than the cost of the day-ahead scheduling, making the two-stage scheduling more economical. Day-ahead scheduling input data is predicted on a 24-h basis, and due to its greater prediction error, the sources and loads uncertainties of the integrated energy system are greater and the predicted day-ahead scenario set error is greater. Decision-makers tend to make conservative scheduling decisions when considering large uncertainties, thus requiring consideration of conditional value-at-risk and resulting in higher scheduling costs. The time interval between the two stages of the scheduling update is 1 h, which produces a much smaller error. The two-stage rolling optimisation can be used to smooth out the uncertainties of sources and loads and give a more realistic decision solution so that the intraday rolling optimisation results in an improved scheduling economy.
5 Conclusion
In this paper, a DCGAN-based scenario prediction approach is used for multiple sources and loads of IES. At the same time, a two-stage scheduling model based on different objective functions to obtain better scheduling results from both day-ahead and intraday stages is also developed, which improves the economy while ensuring accuracy. The conclusions are as follows.
(1) A two-step prediction approach is proposed in the scenario prediction process. We generate data of sources and loads based on DCGAN and use a K-means clustering algorithm for scenario reduction. The proposed scenario prediction approach efficiently and accurately characterises the load-side demands and renewable energy outputs of the IES, significantly reducing the computational complexity and providing reliable support for energy scheduling.
(2) A two-stage scheduling strategy is developed by considering scenario prediction and scheduling update time scales. While further reducing prediction errors, the scheduling results considering CVaR are obtained for the intraday stage and the ones for the day-ahead stage improve the economy of IES.
This paper focuses on the problem of optimising IES scheduling at different time scales in the presence of uncertainties of sources and loads. Future work will explore the relationship between the relevant parameters of CVaR and DCGAN parameters to further achieve the trade-off between risk and prediction accuracy. The prediction and scheduling results of the sources and loads of IES in different prediction and control domains will also be considered.
Data availability statement
The raw data supporting the conclusion of this article will be made available by the authors, without undue reservation.
Author contributions
JX: Conceptualization, methodology, software, data curation, visualization, writing—original draft. ZJ: Funding acquisition, conceptualization, methodology, visualization, validation, writing—review and editing. XL: Conceptualization, funding acquisition. YB: Methodology, software. SZ: Data curation, software. WW: Methodology, software. ZP: Data curation, methodology.
Funding
This work was financially supported by the National Natural Science Foundation of China under Grant 52107100, the Natural Science Foundation of Jiangsu Province of China under Grant BK20190710, the Natural Science Research of Jiangsu Higher Education Institutions of China under Grant 20KJB470024, and the Key Research and Development Program of Jiangsu Province under Grant BE2020081-4.
Conflict of interest
JX, ZJ, XL, YB, SZ, WW, and ZP were employed by Jiangsu Provincial Integrated Gas-Electricity Interconnection Energy Laboratory and International Joint Laboratory of Integrated Energy Equipment and Integration in Jiangsu Province.
The authors declare that the research was conducted in the absence of any commercial or financial relationships that could be construed as a potential conflict of interest.
Publisher’s note
All claims expressed in this article are solely those of the authors and do not necessarily represent those of their affiliated organizations, or those of the publisher, the editors and the reviewers. Any product that may be evaluated in this article, or claim that may be made by its manufacturer, is not guaranteed or endorsed by the publisher.
Abbreviations
IES, integrated energy system; GAN, Generative Adversarial Networks; DCGAN, deep convolutional Generative Adversarial Networks; CVaR, Conditional Value at Risk; SSE, sum of squares of the errors; MAPE, mean absolute percentage error.
References
Asensio, M., and Contreras, J. (2016). Stochastic unit commitment in isolated systems with renewable Penetration under CVaR Assessment. IEEE Trans. Smart Grid 7 (3), 1356–1367. doi:10.1109/TSG.2015.2469134
Chen, B. Y., Bi, W. X., Li, X. T., Li, C. Z., and Zhou, H. W. (2018). Capacity planning strategies for distributed generation considering wind-photovoltaic-load joint time Sequential scenarios. Power Syst. Technol. 42 (03), 755–761. doi:10.13335/j.1000-3673.pst.2017.1304
Chen, Q., Xia, M., Zhou, Y., Cai, H., Wu, J., and Zhang, H. (2019). Optimal planning for Partially Self-Sufficient microgrid with limited Annual electricity exchange with distribution grid. IEEE Access 7, 123505–123520. doi:10.1109/access.2019.2936762
Chen, Y., Li, P., and Zhang, B. “Bayesian renewables scenario generation via deep generative networks,” in 2018 52nd Annual Conference on Information Sciences and Systems (CISS), Princeton, NJ, USA, March 2018 (IEEE), 1–6. doi:10.1109/CISS.2018.8362314
Chen, Y., Wang, Y., Kirschen, D., and Zhang, B. (2019). Model-free renewable scenario generation using generative adversarial networks. IEEE Power & Energy Soc. General Meet. (PESGM) 33 (3), 3265–3275. doi:10.1109/PESGM40551.2019.8974096
Cheng, L. F., Chen, Y., and Liu, G. Y. (2022). 2PnS-EG: A general two-population n-strategy evolutionary game for strategic long-term bidding in a deregulated market under different market clearing mechanisms. Int. J. Electr. Power & Energy Syst. 142, 108182. doi:10.1016/j.ijepes.2022.108182
Cheng, L. F., Yin, L. F., Wang, J. H., Shen, T., Chen, Y., Liu, G. Y., et al. (2021). Behavioral decision-making in power demand-side response management: A multi-population evolutionary game dynamics perspective. Int. J. Electr. Power & Energy Syst. 129, 106743. doi:10.1016/j.ijepes.2020.106743
Cheng, L. F., and Yu, T. (2019). A new generation of AI: A review and perspective on machine learning technologies applied to smart energy and electric power systems. Int. J. Energy Res. 43, 1928–1973. doi:10.1002/er.4333
Cheng, Z. P., Jia, D. Q., Li, Z. W., Xu, S., and Si, J. K. (2022). Multi-time-scale energy management for microgrid using expected-scenario-oriented stochastic optimization. Sustain. Energy, Grids Netw. 30, 100670. doi:10.1016/j.segan.2022.100670
Díaz, G., Gomez-Aleixandre, J., and Coto, J. (2016). Wind power scenario generation through statespace specifications for uncertainty analysis of wind power plants. Appl. Energy 62, 21–30. doi:10.1016/j.apenergy.2015.10.052
Dong, W., Chen, X. Q., and Yang, Q. (2022). Data-driven scenario generation of renewable energy production based on controllable generative adversarial networks with interpretability. Appl. Energy 308, 118387. doi:10.1016/j.apenergy.2021.118387
Fu, Y., Sun, Q., and Wennersten, R. (2020). Effectiveness of the CVaR method in risk management in an integrated energy system. Energy Rep. 6, 1010–1015. doi:10.1016/j.egyr.2020.11.084
Goodfellow, I., Jean, P.-A., Mehdi, M., Bing, X., David, W.-F., Sherjil, O., et al. (2014). Generative adversarial networks. Adv. Neural Inf. Process. Syst. doi:10.48550/arXiv.1406.2661
Guo, L. N., She, C., Kong, D. B., Yan, L. S., Xu, Y. P., Khayatnezhad, M., et al. (2021). Prediction of the effects of climate change on hydroelectric generation, electricity demand, and emissions of greenhouse gases under climatic scenarios and optimized ANN model. Energy Rep. 7, 5431–5445. doi:10.1016/j.egyr.2021.08.134
Guo, S., Qiu, Z. J., Xiao, C. P., Liao, H., Huang, Y. P., Lei, T., et al. (2021). A multi-level vehicle-to-grid optimal scheduling approach with EV economic dispatching model. Energy Rep. 7, 22–37. doi:10.1016/j.egyr.2021.10.058
Handschin, E., and Slomski, H. (1990). Unit commitment in thermal power systems with long-term energy constraints. IEEE Trans. Power Syst. 5 (4), 1470–1477. doi:10.1109/59.99401
Heitsch, H., and Römisch, W. (2003). Scenario reduction algorithms in stochastic programming. Comput. Optim. Appl. 24, 187–206. doi:10.1023/A:1021805924152
Holttinen, H., Lemström, B., Meibom, P., Bindner, H., Orths, A., Hulle, F. V., et al. (2007). Design and operation of power systems with large amounts of wind power: State-of-the-art report. VTT Technical Research Centre of Finland. VTT Working Papers No. 82 https://publications.vtt.fi/pdf/workingpapers/2007/W82.pdf.
Hu, J., and Li, H. (2019). A new clustering approach for scenario reduction in multi-stochastic variable programming. IEEE Trans. Power Syst. 34 (5), 3813–3825. doi:10.1109/TPWRS.2019.2901545
Hu, S. F., Zhu, R. J., Li, G. G., and Song, L. K. (2021). Scenario forecasting for wind power using flow-based generative networks. Energy Rep. 7, 369–377. doi:10.1016/j.egyr.2021.08.036
Hu, W., Zhang, H. X., Dong, Y., Wang, Y. T., Dong, L., and Xiao, M. (2019). Short-term optimal operation of hydro-wind-solar hybrid system with improved generative adversarial networks. Appl. Energy 250, 389–403. doi:10.1016/j.apenergy.2019.04.090
Iliyasu, A. S., and Deng, H. (2020). Semi-supervised Encrypted Traffic Classification with deep convolutional generative adversarial networks. IEEE Access 8, 118–126. doi:10.1109/access.2019.2962106
Kwedlo, W., and Łubowicz, M. (2021). Accelerated K-means algorithms for low-Dimensional data on parallel Shared-Memory systems. IEEE Access 9, 74286–74301. doi:10.1109/ACCESS.2021.3080821
Lei, Y., Wang, D., Jia, H. J., Li, J. X., Chen, J. C., Li, J. R., et al. (2021). Multi-stage stochastic planning of regional integrated energy system based on scenario tree path optimization under long-term multiple uncertainties. Appl. Energy 300, 117224. doi:10.1016/j.apenergy.2021.117224
Li, G. Q., Li, X. T., Bian, J., and Li, Z. H. (2021). Two level scheduling strategy for inter-provincial DC power grid considering the uncertainties of PV-load prediction. Proc. CSEE 41 (14), 4763–4776. doi:10.13334/j.0258-8013.pcsee.200763
Li, J., Lan, F., and Wei, H. (2016). A scenario optimal reduction method for wind power time series. IEEE Trans. Power Syst. 31 (2), 1657–1658. doi:10.1109/TPWRS.2015.2412687
Li, X. L., Wang, Y. Q., Ma, G. B., Chen, X., Fan, J., and Yang, B. (2022). Prediction of electricity consumption during epidemic period based on improved particle swarm optimization algorithm. Energy Rep. 8, 437–446. doi:10.1016/j.egyr.2022.05.088
Li, Z., and Zhang, Z. (2021). Day-ahead and intra-day optimal scheduling of integrated energy system considering uncertainty of source & load power forecasting. Energies 14 (9), 2539–2552. doi:10.3390/en14092539
Liao, W. L., Ge, L. J., Bak-Jensen, B., Pillai, J. R., and Yang, Z. (2022). Scenario prediction for power loads using a pixel convolutional neural network and an optimization strategy. Energy Rep. 8, 6659–6671. doi:10.1016/j.egyr.2022.05.028
Lin, S., Liu, C., Shen, Y., Li, F., Li, D., and Fu, Y. (2022). Stochastic planning of integrated energy system via Frank-Copula function and scenario reduction. IEEE Trans. Smart Grid 13 (1), 202–212. doi:10.1109/TSG.2021.3119939
Morales, J. M., Mínguez, R., and Conejo, A. J. (2010). A methodology to generate statistically dependent wind speed scenarios. Appl. Energy 87, 843–855. doi:10.1016/j.apenergy.2009.09.022
Niu, G., Ji, Y., Zhang, Z. H., Wang, W. B., Chen, J. K., and Yu, P. (2021). Clustering analysis of typical scenarios of island power supply system by using cohesive hierarchical clustering based K-Means clustering method. Energy Rep. 7, 250–256. doi:10.1016/j.egyr.2021.08.049
Patel, M. R. (2005). Wind and solar power systems: Design, analysis, and operation. Second Edition. CRC Press. doi:10.1201/9781420039924
Radford, A., Metz, L., and Chintala, S. (2016). Unsupervised representation learning with deep convolutional generative adversarial networks[J]. Comput. ence. doi:10.48550/arXiv.1511.06434
Shabanpour-Haghighi, A., and Ali Reza, S. (2016). An integrated Steady-state operation Assessment of electrical, natural gas, and District heating networks. IEEE Trans. Power Syst. 31, 3636–3647. doi:10.1109/TPWRS.2015.2486819
Shamshad, A., Bawadi, M. A., Wan Hussin, W. M. A., Majid, T. A., and Sanusi, S. A. M. (2005). First and second order Markov chain models for synthetic generation of wind speed time series. Energy 30 (5), 693–708. doi:10.1016/j.energy.2004.05.026
Sideratos, G., and Hatziargyriou, N. D. (2012). Probabilistic wind power forecasting using radial basis function neural networks. IEEE Trans. Power Syst. 27, 1788–1796. doi:10.1109/TPWRS.2012.2187803
Sun, H. B., Guo, Q. L., Zhang, B. M., Wu, W., Wang, B., Shen, X., et al. (2018). Integrated energy management system:concept, design, and demonstration in China. IEEE Electrific. Mag. 6, 42–50. doi:10.1109/MELE.2018.2816842
Tian, L. T., Cheng, L., Guo, J. B., Sun, S. M., Cheng, Y., and Wei, D. J. (2019). Multi-energy system Valuation method based on Emergy analysis. Power Syst. Technol. 43 (08), 2925–2934. doi:10.13335/j.1000-3673.pst.2018.2310
Vagropoulos, S. I., Kardakos, E. G., Simoglou, C. K., Bakirtzis, A. G., and Catalao, J. P. S. (2016). ANN-based scenario generation methodology for stochastic variables of electric power systems. Electr. Power Syst. Res. 134, 9–18. doi:10.1016/j.epsr.2015.12.020
Wang, F., Li, K., Liu, C., Mi, Z., Shafie-Khah, M., and Catalão, J. P. S. (2018). Synchronous pattern matching Principle-based Residential demand response Baseline Estimation: Mechanism analysis and approach Description. IEEE Trans. Smart Grid 9 (6), 6972–6985. doi:10.1109/TSG.2018.2824842
Wang, K., and Liu, M. Z. (2020). Object recognition at Night scene based on DCGAN and faster R-CNN. IEEE Access 8, 193168–193182. doi:10.1109/ACCESS.2020.3032981
Wu, J. Z., Yan, J. Y., Jia, H. J., Hatziargyriou, N., Djilali, N., and Sun, H. B. (2016). Integrated energy systems. Appl. Energy 167, 155–157. doi:10.1016/j.apenergy.2016.02.075
Wu, L., Shahidehpour, M., and Li, Z. Y. (2012). Comparison of scenario-based and interval optimization Approaches to stochastic SCUC. IEEE Trans. Power Syst. 27 (2), 913–921. doi:10.1109/TPWRS.2011.2164947
Wu, L., Shahidehpour, M., and Li, T. (2007). Stochastic Security-Constrained unit commitment. IEEE Trans. Power Syst. 22 (2), 800–811. doi:10.1109/TPWRS.2007.894843
Xue, Y. S. (2015). Energy Internet or comprehensive energy network?[J]. J. Mod. Power Syst. Clean. Energy 3 (3), 297–301. doi:10.1007/s40565-015-0111-5
Yang, M., Cui, Y., Huang, D. W., Su, X., and Wu, G. (2022). Multi-time-scale coordinated optimal scheduling of integrated energy system considering frequency out-of-limit interval. Int. J. Electr. Power & Energy Syst. 141, 108268. doi:10.1016/j.ijepes.2022.108268
Zhou, Y., Wang, C. S., Wu, J. Z., Wang, J. D., Cheng, M., and Li, G. (2016). Optimal scheduling of aggregated thermostatically controlled loads with renewable generation in the intraday electricity market. Appl. Energy 188, 456–465. doi:10.1016/j.apenergy.2016.12.008
Nomenclature
Variables
G generator
D discriminator
pi probability of occurrence of the corresponding scenario
MAPEi MAPE of the corresponding scenario
Keywords: integrated energy system, scenario generation, optimal scheduling, energy scheduling, energy internet, integrated multienergy system
Citation: Xu J, Ji Z, Liu X, Bao Y, Zhang S, Wang W and Pang Z (2023) Two-stage scheduling of integrated energy systems based on a two-step DCGAN-based scenario prediction approach. Front. Energy Res. 10:1012367. doi: 10.3389/fenrg.2022.1012367
Received: 05 August 2022; Accepted: 27 September 2022;
Published: 09 January 2023.
Edited by:
Bin Zhou, Hunan University, ChinaReviewed by:
Yongxi Zhang, Changsha University of Science and Technology, ChinaLefeng Cheng, Guangzhou University, China
Copyright © 2023 Xu, Ji, Liu, Bao, Zhang, Wang and Pang. This is an open-access article distributed under the terms of the Creative Commons Attribution License (CC BY). The use, distribution or reproduction in other forums is permitted, provided the original author(s) and the copyright owner(s) are credited and that the original publication in this journal is cited, in accordance with accepted academic practice. No use, distribution or reproduction is permitted which does not comply with these terms.
*Correspondence: Zhenya Ji, NjEyMTRAbmpudS5lZHUuY24=
 Jinxing Xu
 Zhenya Ji
 Xiaofeng Liu1,2,3,4
 Yuqing Bao
 Wei Wang