 Haiyue Yang1,2
 Xinjie Qiu
 Dong Liang
95% of researchers rate our articles as excellent or good
Learn more about the work of our research integrity team to safeguard the quality of each article we publish.
Find out more
ORIGINAL RESEARCH article
Front. Energy Res. , 23 September 2022
Sec. Smart Grids
Volume 10 - 2022 | https://doi.org/10.3389/fenrg.2022.1009238
This article is part of the Research Topic Edge Computation and Digital Distribution Networks View all 8 articles
DC interconnection at the second side of distribution transformers helps achieve power sharing among nearby low-voltage distribution networks (LVDNs) and promote integration of intermittent inverter-based distributed generators (DGs). This paper proposes an adaptive model predictive scheduling method for flexible interconnected LVDNs considering charging preferences of electric vehicles (EVs). Firstly, the steady-state models of flexible resources including voltage source converters, energy storage systems along with AC and DC power flow models are established. Then, a model predictive control (MPC)-based rolling optimization model is formulated aiming to minimize the daily energy loss considering uncertainties of DGs, load and each charging station as a whole. To further explore the flexibility and dispatchability of each charging station, an adaptive MPC-based rolling optimization model is built considering three types of EVs with different charging preferences, i.e., uncontrollable EVs, charging-only EVs and vehicle-to-grid EVs. The scheduling window of the adaptive MPC-based scheduling is dynamically updated according to the maximum departure time of currently charging EVs to fulfill expected energy requirements of all EVs. Simulation results on a typical flexible LVDN show that the daily energy loss and total load fluctuation can be further reduced through real-time scheduling of controllable EVs in addition to existing flexible resources.
Increasing penetration of distributed generators (DGs) and fast growth of electric vehicles (EVs) at the user-side keeps challenging secure and reliable operation of distribution networks. Due to intermittent nature of DGs and overlapping of EV charging load with normal load, distribution transformers frequently suffer overloading conditions which is harmful to their state of health. As it is very costly to replace existing distribution transformers with larger-capacity ones, flexible resources such as energy storages, controllable loads and power electronic converters can be helpful to alleviate this burden thanks to their dispatchability and flexibility. Specifically, DC interconnection at the second side of distribution transformers with fewer power conversion stages and enhanced network controllability helps achieve power sharing among nearby low-voltage distribution networks (LVDNs) and promote integration of intermittent inverter-based DG, which is promising for distribution networks to host more DGs and EVs without upgrading of existing infrastructure (Pei et al., 2014; Yang et al., 2015; Mokgonyana et al., 2018).
Scheduling of flexible resources in medium-voltage distribution networks, LVDNs and microgrids has been investigated for the past years. The key focus is to counteract uncertain voltage fluctuation and predicted source-load deviations for high renewable penetrated distribution networks. Model predictive control (MPC) is a closed-loop control method that can reduce model and parameter uncertainties effectively, which is very suitable for scheduling of flexible resources and voltage/var optimization problems (Wang et al., 2014; Zhang et al., 2017; Qiu et al., 2018a; Qiu et al., 2018b; Zafar et al., 2018). MPC has been widely used in scheduling of combined heat and power systems (Yao et al., 2018), active distribution networks (Zhang et al., 2021), intelligent home energy management systems (Minhas and Frey, 2021) and microgrids (Rana et al., 2021). For the voltage/var optimization of distribution networks as an example, the circuit breakers, onload tap changers and capacitor banks are scheduled hourly in a rolling horizon based on predictive outputs of wind turbines and photovoltaic (PV) generators over a finite prediction horizon, e.g., 4 h, followed by a 15-min timescale scheduling of PV inverters and battery storage systems (Zafar et al., 2018) or furthermore a real-time inverter local droop control (Zhang et al., 2017; Qiu et al., 2018b). The hourly decisions are optimized for the whole horizon to minimize the energy loss while satisfying the voltage constraints. But only the decision of the first hour is implemented, and the remaining decisions are discarded aiming at addressing the coupling constraints of the whole optimization time horizon and reserving sufficient capacity for the following hours. In the real-time operation of the system, the influence of the prediction error on the control results can be reduced by reducing the prediction time scale (Zhao et al., 2020; Ma et al., 2022).
As most small-scale DGs, EVs and user-side energy storages are integrated at the low-voltage side of distribution transformers, local energy management systems are getting more attention to manage these flexible resources in a distributed manner without upper-level coordination from the remote control center. In (He et al., 2012), an optimal scheduling scheme is proposed for EV charging and discharging aiming to minimize the total cost of the EVs in the current ongoing EV set, which is resilient to the dynamic EV arrivals. In (Van Kriekinge et al., 2021), two MPC-based EV charging schedulers for four different charging strategies are proposed to minimize electricity bills and peak powers for a local energy system. However, the scheduling is limited in the EV charging stations (EVSs) and distribution network constraints are not modeled. In (Su et al., 2014), an MPC-based power dispatch approach is proposed to minimize the operational cost while accommodating the EV charging uncertainty. In (Zheng et al., 2018), an online optimal charging strategy is proposed for multiple EV charging stations (EVSs) in distribution systems in a time-receding manner aiming to minimize the total system energy cost with power flow and bus voltage constraints satisfied. A distributed MPC-based scheme is designed to solve the optimization problem regarding data privacy, individual economic interests and EV uncertainties. However, the EVS is modeled as a whole and the dispatchability of controllable EVs is not fully taken into account. In (Jiao et al., 2022), a two-stage optimal framework for the online dispatch of a grid-connected DC microgrid is proposed, where the first stage determines the schedule plans of the main grid, the energy storage unit and the EVS by a combined robust and stochastic MPC approach and the second stage allocates the charging power for every EV taking into account the max-min fairness of the charging power. In (Kou et al., 2019), a hierarchical MPC method is proposed to coordinate the optimal power reference of wind power and EV charging in the microgrid. In (Wang et al., 2019), aiming at the voltage problems caused by the increasing charging demand and high photovoltaic penetration in residential LVDNs, a two-level coordinated voltage control scheme for EV chargers is proposed to ensure the voltages are within the allowable range without affecting users’ charging demand. In (Sha’aban et al., 2017), the economic MPC-based decentralized optimization algorithm is proposed for EVs during the grid-to-vehicle and vehicle-to-grid operations, which utilizes the variability of energy prices at different times of the day to realize the charging and discharging of EVs within the optimal time zone. However, power flow constraints are not considered in these methods.
Most existing researches either take the EVS as a whole or neglect charging preferences and power flow constraints. The dispatchability of controllable EVs for flexibility improvement of LVDNs are not fully taken into account. In view of this, this paper proposes an adaptive model predictive scheduling method for flexible interconnected LVDNs considering charging preferences of electric vehicles (EVs). The contributions are summarized as follows:
(1) The steady-state models of flexible resources including voltage source converters (VSCs), energy storage systems (ESSs) along with AC and DC power flow models are established. An MPC-based rolling optimization model is formulated aiming to minimize the daily energy loss considering uncertainties of DGs, load and each EVS as a whole.
(2) To further explore the flexibility and dispatchability of each EVS, an adaptive MPC-based rolling optimization model is built considering three types of EVs with different charging preferences, i.e., uncontrollable EVs, charging-only EVs and vehicle-to-grid EVs. The scheduling window of the adaptive MPC-based scheduling is dynamically updated according to the maximum departure time of currently charging EVs which guarantees full charging at the departure time for each EV.
(3) Simulation results on a typical flexible LVDN show that the daily energy loss and total load fluctuation can be further reduced through real-time scheduling of controllable EVs in addition to existing flexible resources while fulfilling expected energy requirements of all EVs.
The rest of this paper is organized as follows. Section 2 presents the models of flexible interconnected LVDNs. Section 3 presents the MPC-based rolling scheduling method for LVDNs. Section 4 presents the adaptive MPC-based rolling scheduling method for LVDNs. Section 5 describes the simulation results. Conclusions are drawn in Section 6. Figure 1 shows the overall architecture of the paper.
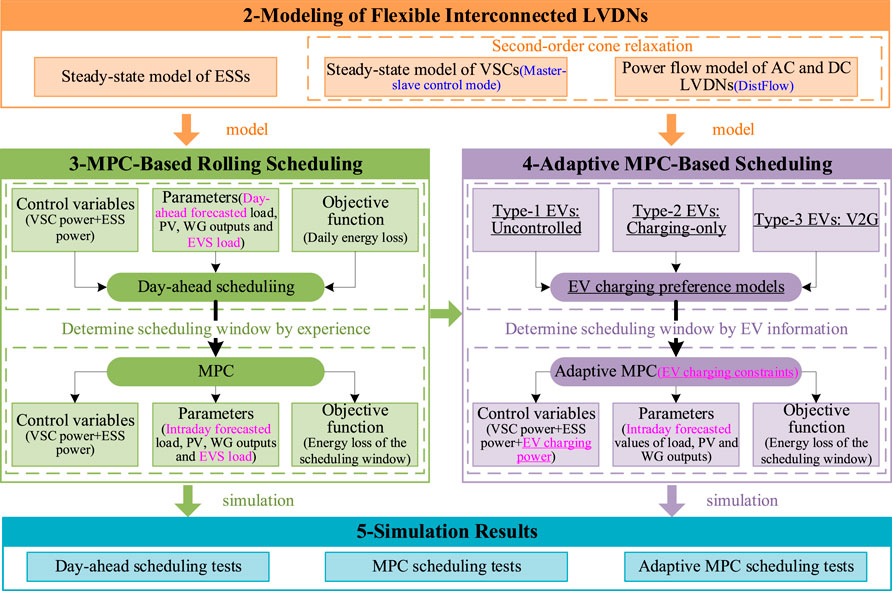
FIGURE 1. The main diagram.
Voltage control modes of VSCs for DC distribution networks can be divided into three types, naming master-slave control, droop control and margin control. The master-slave control mode is utilized in this paper due to its advantage in maintaining voltage stability of the DC distribution network. VdcQ control is used for the master VSC, i.e., the voltage at the DC side and the reactive power at the AC side is controlled to be constant. PQ control is used for all the slave VSCs, i.e., the real power at the DC side and the reactive power at the AC side are controlled to be constant. The control variables are the reactive power of the master VSC and the real, reactive power transmitted in all slave VSCs. Assuming that the power injection into the DC grid is positive, the following constraints should be satisfied for normal operation of a VSC:
where Pi,t,VSC, Qi,t,VSC are the real and reactive power of the VSC injected into bus i at time t, respectively; Aloss is the loss coefficient of VSC; Pmin,VSC, Pmax,VSC are the upper limit and lower limit of the real power transmitted by VSC, respectively; Qmin,VSC, Qmax,VSC are the upper limit and lower limit of the reactive power transmitted by VSC, respectively; Si,max is the maximum apparent power transmitted by the VSC at bus i; ΩVSC is the set of all AC buses with a VSC connected; ΩT is the set of all 96 optimization periods. The constraints make the transmitted real, reactive and apparent power of each VSC not exceed their maximum values at any time.
The following constraints should be satisfied for each ESS:
where
The DistFlow-based branch power flow model (Fourer et al., 1990; IBM, 2022) is used for AC distribution networks, where the power flow balance equation should be satisfied for each non-slack bus, i.e., the real and reactive power injection of a bus should be equal to the difference between the real and reactive power generation and load of the same bus. The real and reactive power flow balance constraints are as follows:
where Pi,t, Qi,t are the real and reactive power injection of bus i at time t; Vi,t is the voltage magnitude of AC bus i at time t; Pij,t, Qij,t, Iij,t are the real power, reactive power and current magnitude of AC branch i-j at time t, respectively; Pi,t,L, Pi,t,VSC are the real power extracted by the load and the real power injected by the VSC at the AC bus i at time t, respectively; Qi,t,L, Qi,t,VSC are the reactive power extracted by the load and the reactive power injected by the VSC at the AC bus i at time t, respectively; rij, xij are the resistance and reactance of the AC branch i-j, respectively; ΩACbus is the set of all AC buses; ΩREF is the set of all AC slack buses; ΩACbr is the set of all AC branches.
Similarly, the DistFlow-based branch power flow model is adopted by the DC distribution networks, where the real power flow balance equation should be satisfied for all DC buses (including the voltage-controlled bus at the master VSC), i.e., and the real power injection at a DC bus should be equal to the difference between the real power generation and the load at the same bus. The real power flow balance constraints are as follows:
where Vi,t is the voltage magnitude of DC bus i at time t; Pij,t, Iij,t are the real power and current magnitude of DC branch i-j at time t, respectively; Pi,t,L, Pi,t,EVS, Pi,t,VSC are the real power extracted by the load, EVS and the real power injected by VSC at the DC bus i at time t, respectively;
Aiming to minimize the daily energy loss of the LVDN, the scheduling model is formulated as follows:
where the total power loss of the network is equal to the sum of the real injection power of all AC buses and DC buses (including the AC slack bus), plus the VSC real power loss; Δt = 15min;
The above optimization model is a nonlinear programming problem, which is difficult to solve. Therefore, we convert it into a second-order cone programming (SOCP) problem through the big-M method and second-order cone relaxation. A lot of researches have been done on whether the optimal solution after the relaxation is consistent with the optimal solution of the original problem. Specifically, (Li et al., 2012; Taylor and Hover, 2012; Farivar and Low, 2013) strictly deduce the sufficient conditions for the accuracy of the second-order cone relaxation, i.e., (1) the objective function must be an increasing function of the branch current and (2) the network topology is a tree-like connected graph. Both conditions are exactly fulfilled by the multi-period optimization formulation in this paper, and therefore the accuracy of the second-order cone relaxation can be guaranteed. In fact, the second-order cone relaxation based on the DistFlow model has been widely used in the field of distribution system operation optimization (Liu et al., 2020); (Ji et al., 2018).
By introducing auxiliary variable ui,t, wij,t, to replace
Similarly, by introducing auxiliary variable ui,t, wij,t, to replace
(1), (4) can also be relaxed to the following second-order cone constraints:
By introducing auxiliary variable ui,t, wij,t, to replace
Using the day-ahead short-term forecasted DG and load values, the day-ahead optimal scheduling model for the whole 96 period is as follows:
where (2), (3), (28) and (29) include the VSC operation constraints; (5)∼(7) include the ESS related constraints; (8), (9), (21)∼(24) are the power flow constraints of the AC distribution network; (14), (25)∼(27) are the power flow constraints of the DC distribution network; (30), (31) include the voltage magnitude limit and branch current magnitude ampacity constraints.
At this time, the model has been converted to a SOCP problem, which can be efficiently solved by commercial solvers. If the true values of DG and load at all time periods are known, the solution is called the global optimum, which can be viewed as a reference for other scheduling strategies.
The key principle of MPC is to calculate the input sequence over a finite prediction horizon in future using predicted states of the system in the window, and applies the input of only the first time period to the system being controlled. And then, the time window is moved forward and the rolling control is repeated in a time-receding manner.
Intra-day rolling optimization strategy of the LVDN divides a day into 96 time periods by 15 min. According to the philosophy of MPC, at the starting time of any period t, a multi-period problem is formulated using the ultra-short-term forecasted DG and load value in a finite horizon, i.e., the scheduling window. Once the multi-period problem is solved, only the decision of the first period is delivered to the control devices while the decisions of other periods are discarded. At the starting time of period t + 1, the scheduling window is moved forward by one and a new multi-period problem is formulated and solved using newly updated DG and load forecasts of the current scheduling window. This process is repeatedly executed in a rolling and time-receding manner. When the length of the remaining periods of the day is less than the preset MPC step size, the scheduling window becomes all remaining periods of the day. The MPC scheduling window is shown in Figure 2.
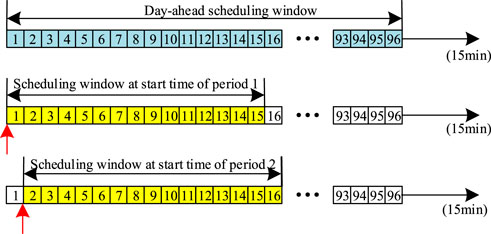
FIGURE 2. Scheduling window of the MPC.
Using the intra-day ultra-short-term forecasted DG and load values, the MPC-based rolling optimization model is as follows:
where all ΩT in the objective and constraints are replaced by ΩW, which is the set of periods in the current scheduling window.
In the MPC-based rolling scheduling formulation (33), the EVS is viewed as a single uncertain load with forecasted values, which neglects the dispatchability and flexibility of EVs. In this section the EVs in the EVSs are viewed as dispatchable flexible resources and are integrated into the multi-period problem aiming to obtain better performance by scheduling their charging power.
Firstly, all EVs are classified into three categories and modeled separately as follows.
The type-1 EVs require to not participate in scheduling and be charged at the rated power until the desired SOC is reached. After that, these EVs maintain physical connection with the charging piles until the EV user drives away although no power is delivered during the spare time. The following constraints should be satisfied for the k-th type-1 EV in the EVS located at DC bus i:
where tcur is the current period; Pk,t,EV1 is the charging power of the kth type-1 EV; Pc,k,rate is the rated charging power of the kth EV; Ek,t is the battery energy of kth EV at ending time of period t; Ek,cur-1 is the battery energy of the kth EV at starting time of the current scheduling window ΩW; Ek,ini is the initial battery energy of the kth EV at arrival time; Ek,exp is the expected energy set by the EV user; Ek,cap is the rated battery capacity of the k-th EV; ΩEV1(i) is the set of all type-1 EVs in the EVS located at DC bus i; ΩQ is the set of all periods between the starting time of the current scheduling window ΩW and t;ηk is the charging efficiency of the k-th EV.
The type-2 EVs can flexibly adjust the charging power during the charging cycle, but are not allowed to discharge. The following constraints should be satisfied for the k-th type-2 EV in the EVS located at DC bus i:
where Pk,t,EV2 is the charging power of the kth type-2 EV; ΩEV2(i) is the set of all type-2 EVs in the EVS located at DC bus i.
The type-3 EVs can be scheduled to charge or discharge during the charging cycle. The following constraints should be satisfied for the k-th type-3 EV in the EVS located at DC bus i:
where
In the adaptive MPC-based rolling scheduling, at the starting time of any period tcur, a multi-period problem is formulated using the ultra-short-term forecasted DG and load value in a horizon, i.e., the scheduling window. However, this scheduling window is not constant but determined based on the maximum departure time of all currently charging EVs at tcur. Once the multi-period problem is solved, only the decision of the first period is delivered to the control devices, i.e., VSCs, ESSs, type-2 and type-3 EVs, while the decisions of other periods are discarded. Then at the starting time of period tcur+1, the scheduling window is moved forward by one and a new multi-period problem is formulated and solved using newly updated DG and load forecasts of the current scheduling window. Note that the scheduling window is dynamically updated with EV arrivals and departures, therefore the periods of each multi-period problem can be very different. This process is repeatedly executed in a rolling and time-receding manner. When the length of the remaining periods of the day is less than the preset MPC step size, the scheduling window becomes all remaining periods of the day. The MPC scheduling window is shown in Figure 3.
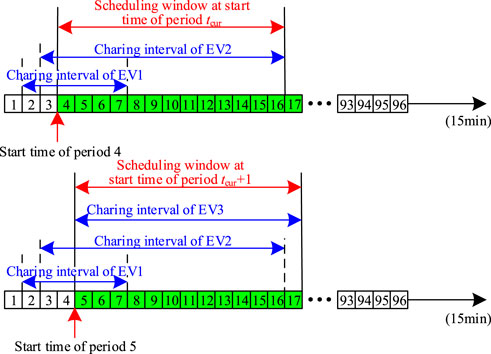
FIGURE 3. The scheduling window of the adaptive MPC.
As can be seen from Figure 3, the scheduling window ΩW at tcur is no longer constant but depends on the latest departure time of all currently charging EVs:
where tout,max is the maximum expected departure time of all currently charging EVs at tcur; NW is the length of the rolling window at tcur.
Using the intra-day ultra-short-term forecasted DG and load values, the adaptive MPC-based rolling optimization model is as follows:
where (36)∼(48) are the EV charging preference models for three types of EVs, respectively. The charging load Pi,t,EVS in (14) is no longer a fixed constant but is calculated by:
The proposed method is tested with a realistic AC/DC LVDN in Tianjin, China, as shown in Figure 4. The rated capacity of the 1# and 2# transformer is 1500 kVA. The secondary sides of the two transformers supply the AC residential load at AC buses 3 and 5, respectively. In addition, they are interconnected through a DC line and two VSCs. The VSC between AC bus 3 and DC bus 1 is the master VSC working in VdcQ control mode and the VSC between AC bus 5 and DC bus 2 is the slave VSC working in PQ control mode. The maximum apparent power transmitted by the master and slave VSCs is 1 MVA. The configuration of DC loads, PV, wind generation (WG), ESS and EVS in the DC system is shown in Figure 4, where the installed capacities of the PV, WG, ESS are 1 MW, 1.5 MW, 1 MW/2 MWh respectively and the rated capacity of the EVS is 1.8 MW with 30 DC chargers in it. The maximum charging power of each DC charger is 60 kW. The allowable voltage magnitude of each bus is 0.95–1.05 p.u. The AMPL (Kou et al., 2019) modeling language is used for programming and the CPLEX 12.7 solver (Zhao et al., 2020) is called to solve the problem. All the simulations are tested on a desktop computer with an i7-9700 CPU, 2.40 GHz working frequency and 16 GB RAM.
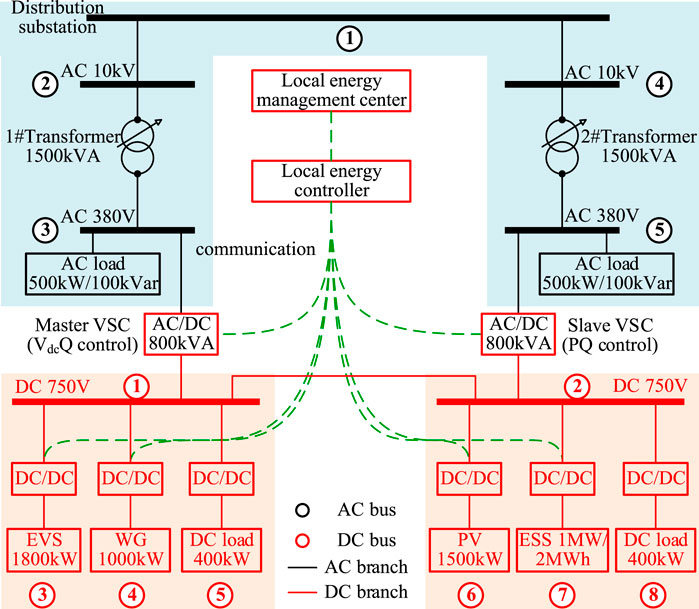
FIGURE 4. Configuration of the tested flexible LVDN.
The field daily load, PV, WG and EV charging data are used to generate the shape curves of normal load, PV and WG and EV charging load. The sampling periods of all kinds of data are 15 min. Multiplying the shape curves by the peak normal load, installed capacity of PV, WG and EVS capacity results in their true value curves. ±10%, ±20%, ±30%, and ±30% Gaussian errors are added to the true values of load, PV, WG and charging load to generate the day-ahead forecasted values, respectively. ±5%, ±10%, ±15%, and ±15% Gaussian errors are added to the true values of load, PV, WG and charging load to generate the intra-day forecasted values, respectively, as shown in Figures 5–8 The EVS is assumed to be uncontrolled in history and all EVs are charged at the rated power once connected, i.e., all EVs are type-1 EVs. The number of three types of EVs throughout the day are 69, 68 and 29, respectively.
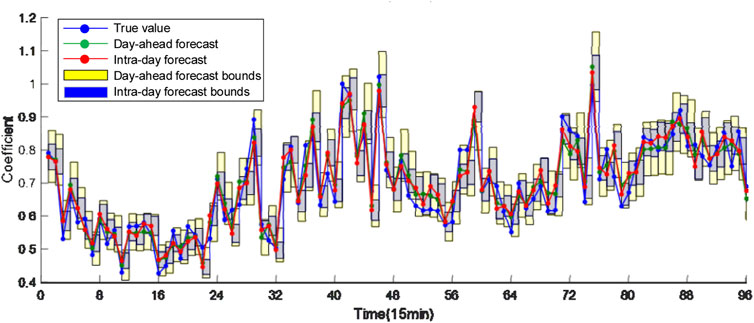
FIGURE 5. Day-ahead and intro-day forecasting curves of normal load.
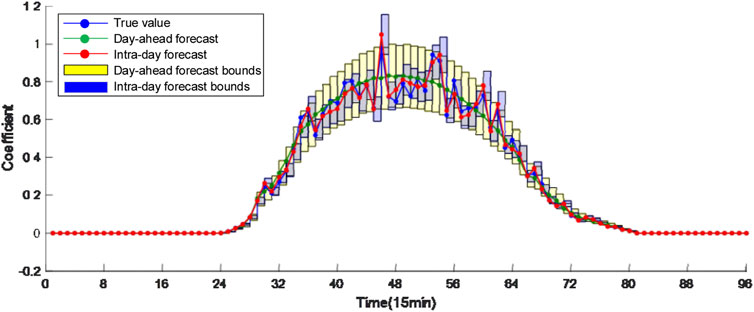
FIGURE 6. Day-ahead and intro-day forecasting curves of PV generation.
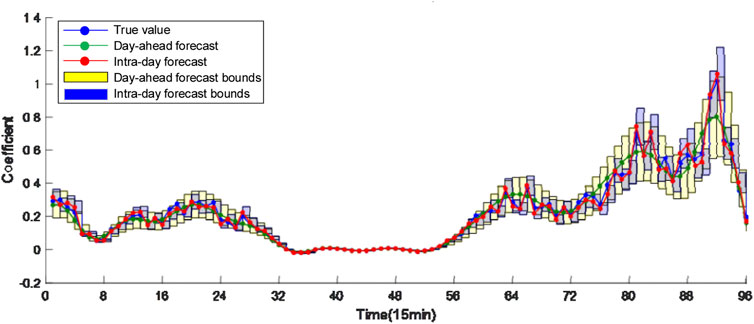
FIGURE 7. Day-ahead and intro-day forecasting curves of wind generation.
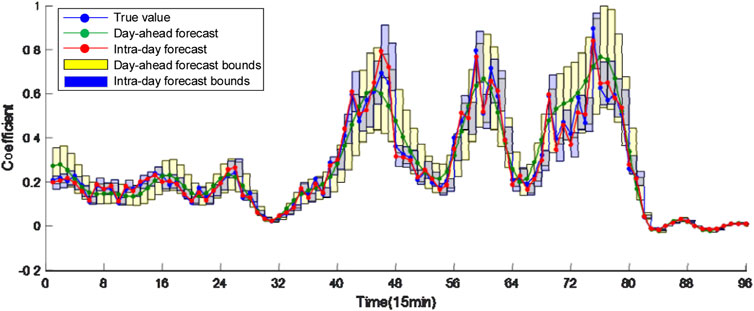
FIGURE 8. Day-ahead and intro-day forecasting curves of charging load.
Four scheduling strategies are tested for comparison:
(1) MPC scheduling strategy: Intraday rolling scheduling is performed with a fixed-length scheduling window, i.e., the MPC step size is fixed. The electric vehicle charging station participates in the optimal scheduling as a whole. The intraday ultra-short-term forecasted values of load, PV, WG and EVS load are used for all periods in the scheduling window.
(2) Adaptive MPC scheduling strategy: Intraday rolling scheduling is performed and the scheduling window is determined according to the maximum departure time of the currently charging EVs. The intraday ultra-short-term forecasted values of load, PV and WG are used for all periods in the scheduling window.
(3) Global optimization strategy: The EVS participates in the optimal scheduling as a whole. The 96-period optimal scheduling is carried out using true values of load, PV, WG and EVS load.
(4) Day-ahead scheduling strategy: The EVS participates in the optimal scheduling as a whole. The day-ahead 96-period scheduling is carried out using day-ahead forecasted values of load, PV, WG and EVS load.
Among the four strategies, the EVS is regarded as a single DC load in the MPC scheduling strategy, global optimal strategy and the day-ahead scheduling strategy. Therefore, the true value curve of the EVS load in these three strategies is equivalent to the EVS load curve in the adaptive scheduling strategy with only type-1 EVs throughout the day.
The detailed results of the four scheduling strategies are analyzed as follows.
The energy loss of the whole day and each period are shown in Figure 9. It can be seen that the daily energy loss of the day-ahead scheduling strategy is relatively low but its actual value is 152.5 kWh which is much higher. This is because the decisions made by the day-ahead scheduling are based on the day-ahead forecasted values of DGs and loads, which may differ much from the actual values in the second day due to forecast errors. The daily energy loss of the MPC scheduling strategy decreases from 137 kWh to 132 kWh with the MPC step size N increasing from 1 to 34. This is because more accurate intra-day forecasted DG and load of multiple periods in the future are used, resulting in more reasonable scheduling plans for the ESS and VSCs. As N continues increasing, the reduction of daily energy loss slows down and the final energy loss is close to the global scheduling strategy. Therefore, N is fixed to 34 for the MPC scheduling strategy in the following tests. On the other side, the daily energy loss of the adaptive MPC scheduling strategy is only 112.5 kWh, which is much lower than other strategies even the global optimization strategy. This because the EVS load in the other three strategies are uncontrollable while all type-2 and type3 EVs in the adaptive MPC scheduling strategy are dispatchable flexible resources, resulting in much lower energy loss by control of EV charging power. From the energy loss curves of each period in Figure 9B, it can be seen that the energy loss curve of the MPC scheduling strategy is very close to the global optimization strategy while the energy loss curve of the adaptive MPC scheduling strategy is reshaped to be gentler.
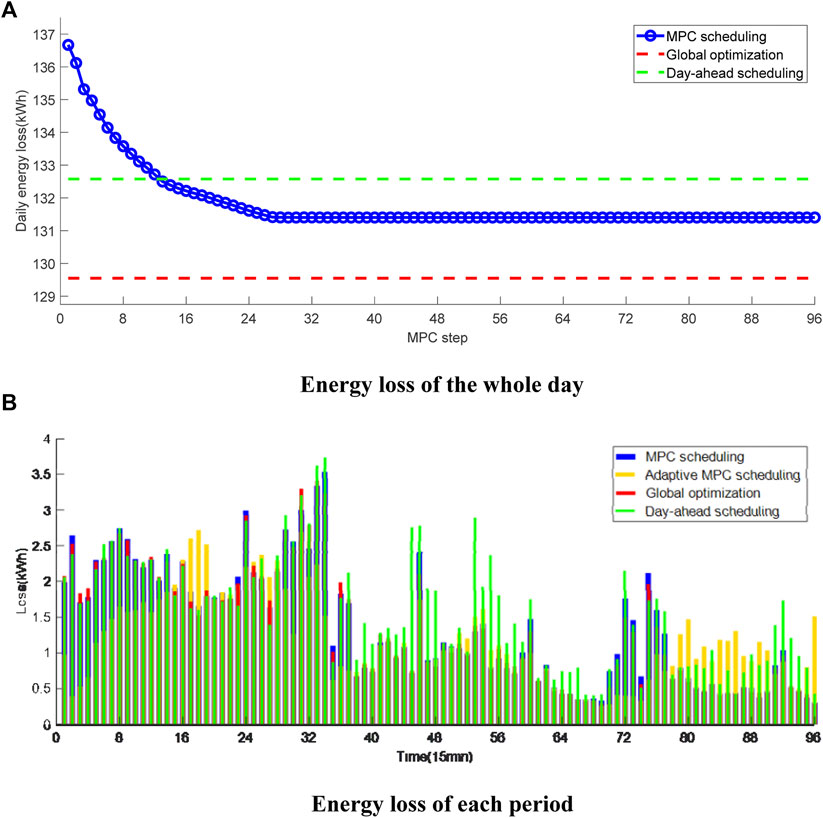
FIGURE 9. Energy loss of the LVDN under different scheduling strategies. (A) Energy loss of the whole day. (B) Energy loss of each period.
The charging power and SOC curves of the ESS under different scheduling strategies are shown in Figure 10. It can be seen that the ESS discharges in period 1–40 and charges in periods 41–70 for all scheduling strategies. This is because PV and WG outputs are low during period 1–40 and the ESS discharges to fulfill energy requirement of normal load and charging load. While during period 41–70, the PV and WG generation increases and the ESS is charged to consume extra DG power.
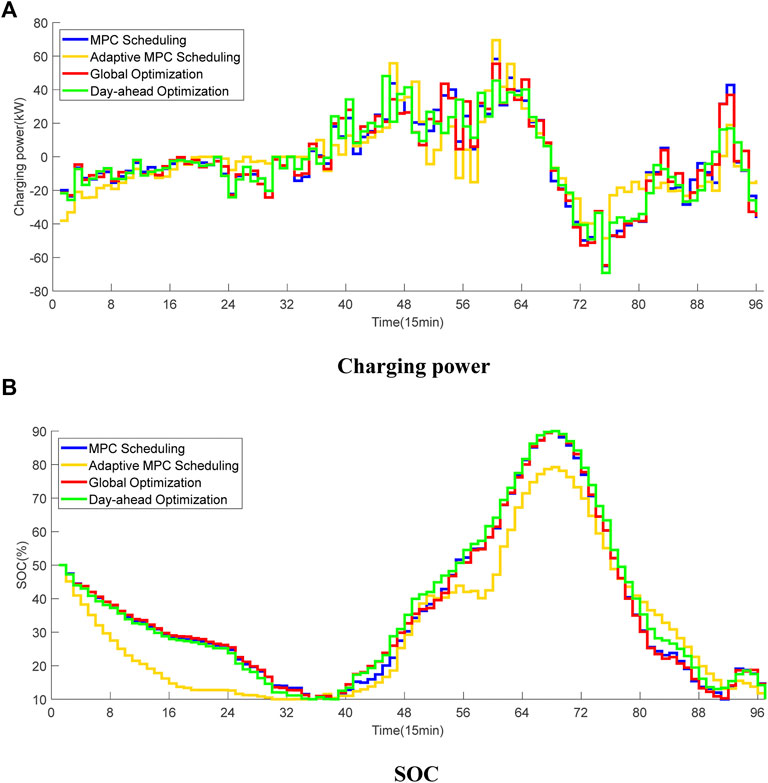
FIGURE 10. Charging power and SOC curves of the ESS under different scheduling strategies. (A) Charging power. (B) SOC.
The charging power curves of the EVS under different scheduling strategies are shown in Figure 11. It can be seen that the adaptive MPC scheduling strategy shifts much charging power to periods with high PV and WG generation to improve DG consumption. For example, during period 50–60, the charging load of the adaptive MPC scheduling strategy is relatively high due to high PV generation. On the other side, the increasing of the ESS’s SOC curve slows down in Figure 10 as part of PV generation are consumed by EV charging.
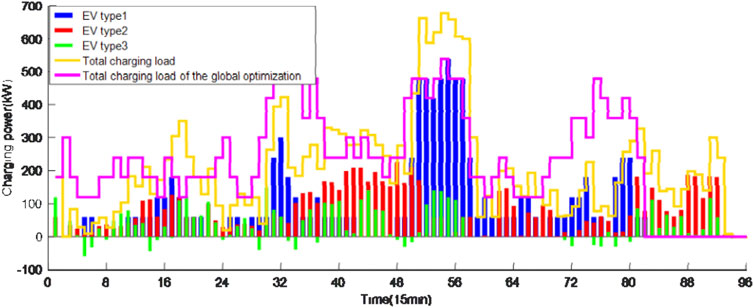
FIGURE 11. Charging power curves of the EVS under different scheduling strategies.
The power curves of the VSCs under different scheduling strategies are shown in Figure 12. It can be seen that the actual power of the master VSC under the day-ahead scheduling strategy shows violate fluctuation. This is because the actual values of DG and loads deviate from their day-ahead forecasted values and the extra beyond-the-plan power will be balanced by the master VSC, i.e., 1#VSC, which acts as a reference bus in the master-slave control-based DC distribution network. At the same time, it can be clearly seen that the real and reactive power curves under the adaptive MPC scheduling strategy is much flatter than other strategies. For example, during period 70–80, the charging load is large while the PV generation is still small and cannot fully supply the charging load. In this situation, the adaptive MPC scheduling strategy shifts the charging load to the subsequent period 80–90 when WG generation is large while other EV-uncontrolled strategies should extract power from the main AC grid.
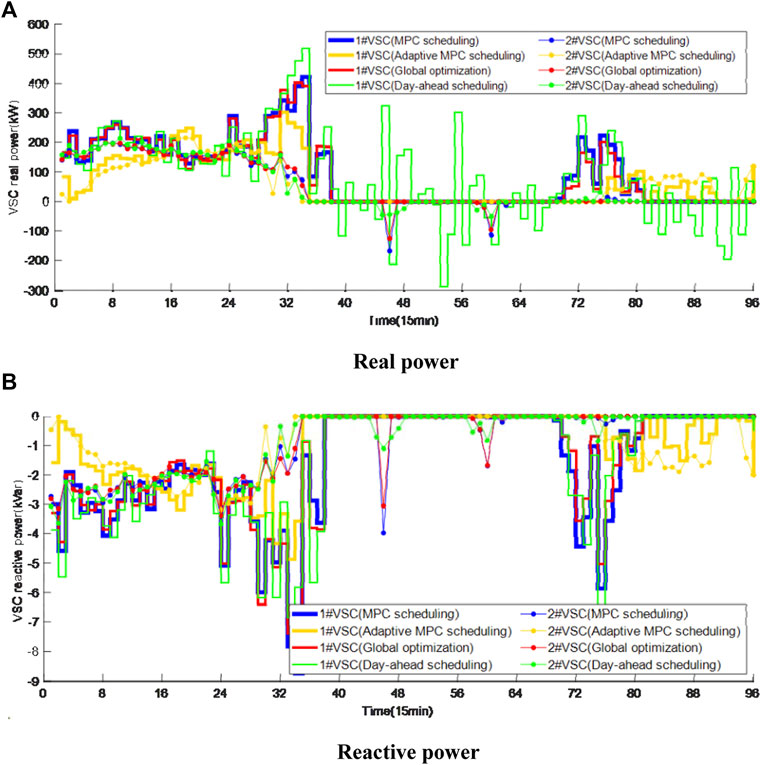
FIGURE 12. Power curves of the VSCs under different scheduling strategies. (A) Real power. (B) Reactive power.
The average voltage curves under different scheduling strategies are shown in Figure 13. It can be seen that the AC voltage fluctuates heavily during period 30–40 and 70–80 under the three EV-uncontrolled strategies due to high real power extraction of the DC grid from the main AC grid. While the voltage fluctuation of the adaptive MPC scheduling strategy is much smaller due to making full use of dispatchability of type-2 and type-3 EVs and reduced power transmission from the AC grid. On the other side, the DC voltage curves are high during period 30–65 for all the four strategies due to high PV generation in this period. However, the minimum DC voltage is raised in period 88–96 under the adaptive MPC scheduling strategy compared with other strategies, resulting better voltage stability. The actual AC and DC voltage curves of the day-ahead scheduling strategy fluctuate heavily as the real-time control is missing in response of real-time DG and load varying.
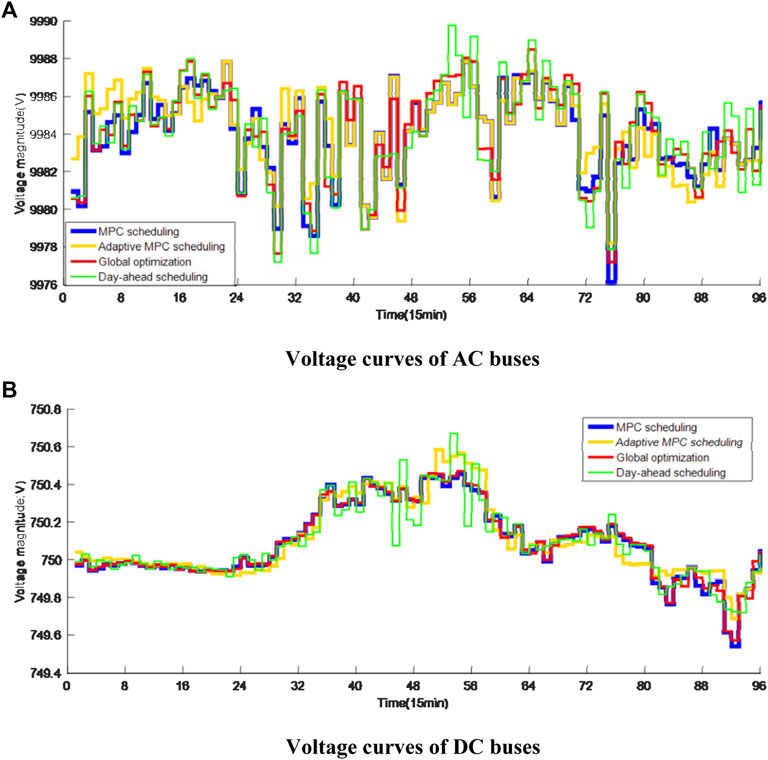
FIGURE 13. Average voltage curves under different scheduling strategies. (A) Voltage curves of AC buses. (B) Voltage curves of DC buses.
The loading rate curves of the transformers under different scheduling strategies are shown in Figure 14. It can be seen that the maximum loading rate curve during period 1–15, 25–40 and 70–80 under the adaptive MPC scheduling strategy is reduced to about 55%, 65%, 60% from about 65%, 75%, 70% compared with other strategies. The power fluctuation is also reduced, resulting a much smaller peak-valley ratio. The PCC power curves under different scheduling strategies are shown in Figure 15, where similar conclusion can be observed. The three EV-uncontrolled should extract much power from the main AC grid due to lack of flexibility, leading to higher power fluctuation. While the adaptive MPC scheduling strategy shifts power in these periods to other periods with much higher flexibility.
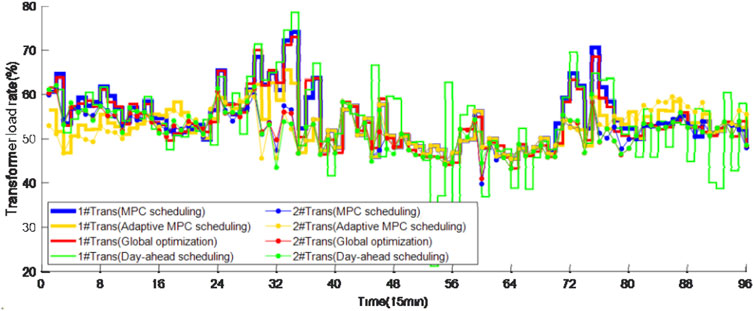
FIGURE 14. Loading rate curves of the transformers under different scheduling strategies.
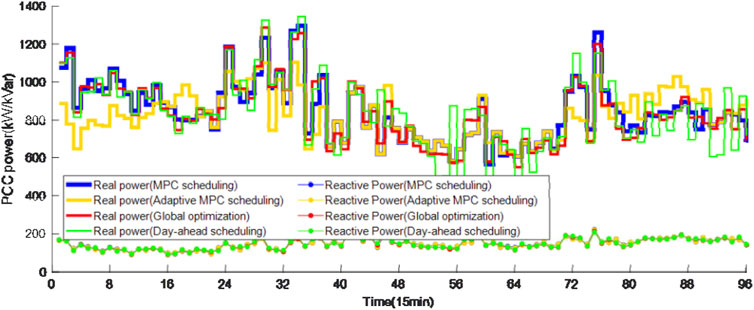
FIGURE 15. PCC power curves under different scheduling strategies.
The energy curves of the EVs under the adaptive MPC scheduling strategy are shown in Figure 16. It can be seen that the energy of all three types of EVs reach the expectation values at their departure time. The difference lies in that the charging power of the type-1 EVs are straight lines with much faster charging speed, while the energy curves of the type-2 EVs are flatter. The energy curves of the type-3 EVs can decrease in some periods due to discharging and participation of scheduling but will finally reach their expected values. Therefore, it is concluded that the DG, EV hosting capacity of the LVDN could be improved using the proposed adaptive MPC scheduling strategy.
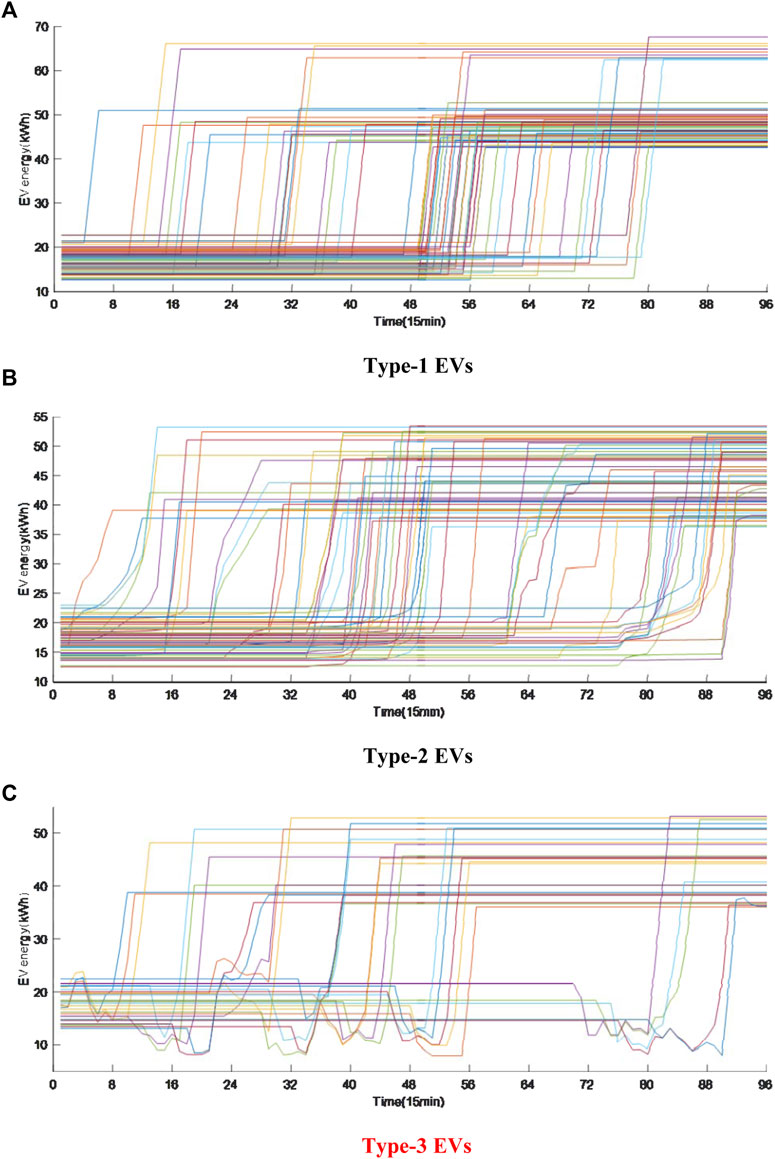
FIGURE 16. Energy curves of the EVs under the adaptive MPC scheduling strategy. (A) Type-1 EVs. (B) Type-2 EVs. (C) Type-3 EVs.
This paper proposes an adaptive model predictive scheduling method for flexible interconnected LVDNs considering charging preferences of EVs. An MPC-based rolling optimization model is formulated aiming to minimize the daily energy loss considering uncertainties of DG, load and each charging station as a whole. To further explore the flexibility and dispatchability of each charging station, an adaptive MPC-based rolling optimization model is built considering three types of EVs with different charging preferences, i.e., uncontrollable EVs, charging-only EVs and vehicle-to-grid EVs. The scheduling window of the adaptive MPC-based scheduling is dynamically updated according to the maximum departure time of currently charging EVs to fulfill expected energy requirements of all EV users. Simulation results on a typical flexible LVDN show that the daily energy loss and total load fluctuation can be further reduced through real-time scheduling of controllable EVs in addition to existing flexible resources.
Future work will be focused on designing distributed algorithm for multi-terminal LVDNs to reduce communication burden. The hosting capacity evaluation of LVDNs using the proposed adaptive MPC scheduling strategy is also a promising research direction.
The original contributions presented in the study are included in the article/Supplementary Material, further inquiries can be directed to the corresponding author.
HY contributed toward conceptualization and writing-review. SY contributed toward conceptualization and writing-review. ZW contributed toward conceptualization and writing-review. XQ contributed toward methodology, software, data curation, and writing-original draft. DL contributed toward supervision, methodology, software, data curation, writing-original draft and writing-review and editing.
This work is supported by the State Grid Hebei Electric Power Company (kj 2021-007).
Authors HY, SY, and ZW were employed by State Grid Hebei Electric Power Company Hengshui Power Supply Company.
Author HY was employed by Hengshui Electric Power Design Co., Ltd.
The remaining authors declare that the research was conducted in the absence of any commercial or financial relationships that could be construed as a potential conflict of interest.
All claims expressed in this article are solely those of the authors and do not necessarily represent those of their affiliated organizations, or those of the publisher, the editors and the reviewers. Any product that may be evaluated in this article, or claim that may be made by its manufacturer, is not guaranteed or endorsed by the publisher.
Farivar, M., and Low, S. H. (2013). Branch flow model: Relaxations and convexification—Part I. IEEE Trans. Power Syst. 28 (3), 2554–2564. doi:10.1109/TPWRS.2013.2255317
Fourer, R., Gay, D. M., and Kernighan, B. W. (1990). A modeling language for mathematical programming. Manage. Sci. 36 (5), 519–554. doi:10.1287/mnsc.36.5.519
He, Y., Venkatesh, B., and Guan, L. (2012). Optimal scheduling for charging and discharging of electric vehicles. IEEE Trans. Smart Grid 3 (3), 1095–1105. doi:10.1109/TSG.2011.2173507
IBM (2022). IBM ILOG CPLEX V 12.7. Available at: http://www-01.ibm.com/software/integration/optimization/cplex-optimizer/.
Ji, H., Wang, C., Li, P., Ding, F., and Wu, J. (2018). Robust operation of soft open points in active distribution networks with high penetration of photovoltaic integration. IEEE Trans. Sustain. Energy 10 (1), 280–289. doi:10.1109/TSTE.2018.2833545
Jiao, F., Zou, Y., Zhang, X., and Zhang, B. (2022). Online optimal dispatch based on combined robust and stochastic model predictive control for a microgrid including EV charging station. Energy 247, 123220. doi:10.1016/j.energy.2022.123220
Kou, P., Feng, Y., Liang, D., and Gao, L. (2019). A model predictive control approach for matching uncertain wind generation with PEV charging demand in a microgrid. Int. J. Electr. Power & Energy Syst. 105, 488–499. doi:10.1016/j.ijepes.2018.08.026
Li, N., Chen, L., and Low, S. H. (2012). “Exact convex relaxation of OPF for radial networks using branch flow model,” in IEEE Third Int. Conf. Smart Grid Commun. (SmartGridComm) (Tainan, Taiwan: IEEE), 7–12. doi:10.1109/SmartGridComm.2012.6485951
Liu, W., Fu, M., Yang, M., Yang, Y., Wang, L., Wang, R., et al. (2020). A bi-level interval robust optimization model for service restoration in flexible distribution networks. IEEE Trans. Power Syst. 36 (3), 1843–1855. doi:10.1109/TPWRS.2020.3038400
Ma, Q., Wang, H., Luo, P., Chen, H., Liang, J., and Guo, Q. (2022). Real-time control strategy of tractive load peak Clipping and valley filling based on model predictive control. IEEE Trans. Transp. Electrific. 8 (3), 3208–3218. doi:10.1109/TTE.2022.3163135
Minhas, D. M., and Frey, G. (2021). Rolling horizon based time-triggered distributed control for ac/dc home area power network. IEEE Trans. Ind. Appl. 57 (4), 4021–4032. doi:10.1109/TIA.2021.3074901
Mokgonyana, L., Smith, K., and Galloway, S. (2018). Reconfigurable low voltage direct current charging networks for plug-in electric vehicles. IEEE Trans. Smart Grid 10 (5), 5458–5467. doi:10.1109/TSG.2018.2883518
Pei, W., Deng, W., Zhang, X., Qu, H., and Sheng, K. (2014). Potential of using multiterminal LVDC to improve plug-in electric vehicle integration in an existing distribution network. IEEE Trans. Ind. Electron. 62 (5), 3101–3111. doi:10.1109/TIE.2014.2379219
Qiu, H., Gu, W., Xu, Y., Wu, Z., Zhou, S., and Wang, J. (2018). Interval-partitioned uncertainty constrained robust dispatch for ac/dc hybrid microgrids with uncontrollable renewable generators. IEEE Trans. Smart Grid 10 (4), 4603–4614. doi:10.1109/TSG.2018.2865621
Qiu, H., Gu, W., Xu, Y., and Zhao, B. (2018). Multi-time-scale rolling optimal dispatch for ac/dc hybrid microgrids with day-ahead distributionally robust scheduling. IEEE Trans. Sustain. Energy 10 (4), 1653–1663. doi:10.1109/TSTE.2018.2868548
Rana, M. J., Zaman, F., Ray, T., and Sarker, R. (2021). Real-time scheduling of community microgrid. J. Clean. Prod. 286, 125419. doi:10.1016/j.jclepro.2020.125419
Sha’aban, Y. A., Ikpehai, A., Adebisi, B., and Rabie, K. M. (2017). Bi-directional coordination of plug-in electric vehicles with economic model predictive control. Energies 10 (10), 1507. doi:10.3390/en10101507
Su, W., Wang, J., Zhang, K., and Huang, A. Q. (2014). Model predictive control-based power dispatch for distribution system considering plug-in electric vehicle uncertainty. Electr. Power Syst. Res. 106, 29–35. doi:10.1016/j.epsr.2013.08.001
Taylor, J. A., and Hover, F. S. (2012). Convex models of distribution system reconfiguration. IEEE Trans. Power Syst. 27 (3), 1407–1413. doi:10.1109/TPWRS.2012.2184307
Van Kriekinge, G., De Cauwer, C., Sapountzoglou, N., Coosemans, T., and Messagie, M. (2021). Peak shaving and cost minimization using model predictive control for uni-and bi-directional charging of electric vehicles. Energy Rep. 7, 8760–8771. doi:10.1016/j.egyr.2021.11.207
Wang, Y., John, T., and Xiong, B. (2019). A two-level coordinated voltage control scheme of electric vehicle chargers in low-voltage distribution networks. Electr. Power Syst. Res. 168, 218–227. doi:10.1016/j.epsr.2018.12.005
Wang, Z., Wang, J., Chen, B., Begovic, M. M., and He, Y. (2014). MPC-based voltage/var optimization for distribution circuits with distributed generators and exponential load models. IEEE Trans. Smart Grid 5 (5), 2412–2420. doi:10.1109/TSG.2014.2329842
Yang, Z., Li, K., and Foley, A. (2015). Computational scheduling methods for integrating plug-in electric vehicles with power systems: A review. Renew. Sustain. Energy Rev. 51, 396–416. doi:10.1016/j.rser.2015.06.007
Yao, S., Gu, W., Zhou, S., Lu, S., Wu, C., and Pan, G. (2018). Hybrid timescale dispatch hierarchy for combined heat and power system considering the thermal inertia of heat sector. IEEE Access 6, 63033–63044. doi:10.1109/ACCESS.2018.2876718
Zafar, R., Ravishankar, J., Fletcher, J. E., and Pota, H. R. (2018). Multi-timescale model predictive control of battery energy storage system using conic relaxation in smart distribution grids. IEEE Trans. Power Syst. 33 (6), 7152–7161. doi:10.1109/TPWRS.2018.2847400
Zhang, C., Xu, Y., Dong, Z., and Ravishankar, J. (2017). Three-stage robust inverter-based voltage/var control for distribution networks with high-level PV. IEEE Trans. Smart Grid 10 (1), 782–793. doi:10.1109/TSG.2017.2752234
Zhang, J., Li, Z., and Wang, B. (2021). Within-day rolling optimal scheduling problem for active distribution networks by multi-objective evolutionary algorithm based on decomposition integrating with thought of simulated annealing. Energy 223, 120027. doi:10.1016/j.energy.2021.120027
Zhao, H., Wang, X., Li, N., Kuang, Y., and Sun, Q. (2020). Adaptive time resolution rolling dispatch with high renewable penetration. J. Phys. Conf. Ser. 1585 (1), 012039. doi:10.1088/1742-6596/1585/1/012039
Keywords: optimal scheduling, flexible low-voltage distribution network, adaptive model predictive control, electric vehicles, charging preference
Citation: Yang H, Yuan S, Wang Z, Qiu X and Liang D (2022) Adaptive model predictive scheduling of flexible interconnected low-voltage distribution networks considering charging preferences of electric vehicles. Front. Energy Res. 10:1009238. doi: 10.3389/fenrg.2022.1009238
Received: 01 August 2022; Accepted: 02 September 2022;
Published: 23 September 2022.
Edited by:
Haoran Ji, Tianjin University, ChinaReviewed by:
Qiwei Zhang, The University of Tennessee, Knoxville, United StatesCopyright © 2022 Yang, Yuan, Wang, Qiu and Liang. This is an open-access article distributed under the terms of the Creative Commons Attribution License (CC BY). The use, distribution or reproduction in other forums is permitted, provided the original author(s) and the copyright owner(s) are credited and that the original publication in this journal is cited, in accordance with accepted academic practice. No use, distribution or reproduction is permitted which does not comply with these terms.
*Correspondence: Dong Liang, bGlhbmdkb25nQGhlYnV0LmVkdS5jbg==
Disclaimer: All claims expressed in this article are solely those of the authors and do not necessarily represent those of their affiliated organizations, or those of the publisher, the editors and the reviewers. Any product that may be evaluated in this article or claim that may be made by its manufacturer is not guaranteed or endorsed by the publisher.
Research integrity at Frontiers
Learn more about the work of our research integrity team to safeguard the quality of each article we publish.