 Wenwen Xu
 Shuting Chen
- Guangxi Beihai Power Supply Bureau of China Southern Power Grid, Beihai, China
Reasonable generator serial restoration sequence is a key issue to the system restoration following blackouts. This paper proposed an optimization method for the decision making of generator serial restoration sequence based on Monte Carlo tree search algorithm. First, the generator serial restoration sequence mechanism during the restoration process is analyzed. Considering the maximization of the total power generation capacity as the objective function, this paper also consider generator’s hot start. Second, the Monte Carlo tree search algorithm (MCTS) is applied to decide the generator serial restoration sequence. In the simulation stage of MCTS, the Dijkstra’s algorithm is utilized to determine the shortest path between the selected generator and the recovered power system. Finally, the IEEE 39 bus system and Hebei power grid system are used to validate the proposed algorithm. Simulation results show that the proposed method is efficiency and it can provide an reasonable generator serial restoration sequence to maximizing power generation during the restoration process.
1 Introduction
With the continuous growth of power demand, the scale of the power system continues to expand (Lindenmeyer et al., 2001). Once a large-scale power system is affected by internal and external factors, it is easy to lead to the occurrence of blackouts, causing serious losses to the society and economy (ANDERSSON et al., 2005). For example, on 14 February 2021, due to the influence of cold weather in Texas, the generated States, a large blackout occurred, resulting in a load cut of about 20,000 MW in Texas, affecting a population of about 4 million (Zhang et al., 2022); Argentina On 16 June 2019, a large-scale blackout occurred in the power grid. The accident caused blackouts in Argentina and Uruguay, and also affected parts of Brazil, Paraguay and Chile, affecting about 48 million people (Sharma et al., 2021). After a major blackout, lack of a reasonable generator restoration plan may prolong the blackout time of the system, or even expand the blackout range (ADIBI et al., 1987): For example, on 9 January 2021 in Pakistan, the failure of the Gudu power plant caused a chain reaction of the national power system, triggering the largest blackout accident in Pakistan since the founding of the country, causing all major cities in Pakistan to fall into darkness (Desai, 2021). Therefore, the decision of the generator restoration sequence after a blackout is an important research topic in power system restoration.
After a blackout, the restoration of the generator is mainly completed in the black start stage (Leng et al., 2022) and the network reconstruction stage (Chu et al., 1993). The decision-making problem of generator restoration sequence is usually formulated as a multi-stage, nonlinear, constrained optimization model problem (Riou et al., 2021), and the factors to be considered in the decision-making process are detailed in reference (ADIBI et al., 1992). Reference (KETABI et al., 2001) realizes the decision of the generator restoration sequence by establishing a mathematical model. However, only the goal of maximizing power generation is considered, and the influence of various factors of the system on the entire restoration process is ignored. Reference (ZENG et al., 2012) comprehensively considers the relationship between load location, node location, line restoration success rate and generator rated power generation, and proposes a decision-making method based on fuzzy set theory (FST) to optimize the restoration process of the power system. However, it is difficult to obtain clustering conclusions when the FST deals with the huge and mutually influencing generator restoration data.
In this paper, the Monte Carlo tree search (MCTS) algorithm and the Dijkstra’s algorithm (DA) are utilized to propose a decision-making method for the serial restoration sequence of the generator. MCTS is a tree search algorithm which obtains results based on the simulations on different possible processes of events and it has proven effective in domains of high complexity (Browne et al., 2012). DA can find shortest paths to all nodes from a single source node in a network (Johnson, 1973). Combined with DA, MCTS can better simulate the restoration process of the power system and make decisions on the serial restoration sequence of the generator faster. The proposed method takes maximizing the total power generation capacity of the system as the objective function, and comprehensively considers the hot start time limit and the power restoration path time of the generator to establish an optimization model for the decision-making of the generator serial restoration sequence. The effectiveness and accuracy of the proposed method were verified in the IEEE 39 bus system and the actual local power grid in Hebei.
The main Contributions and innovations are the following:
(1) Generator’s hot start is considered to speed up the process of power system restoration and reduce social and economic losses.
(2) Incorporate DA into the simulation stage of MCTS to reflect the power system restoration simulation process more realistically.
(3) A MCTS-based method for decision making of generator serial restoration sequence is proposed, which can provide the restoration scheme with the maximum power generation capacity during the restoration process.
The remainder of this paper is organized as follows. The modeling process for the decision making of generator restoration sequence are presented in Section 2. Method for decision making of generator serial restoration sequence are introduced in Section 3. Case studies on the IEEE 39-bus system and the Hebei power system are provided in Section 4. The conclusions are given in Section 5.
2 Model for the decision making of generator restoration sequence
The decision-making problem of the generator serial restoration sequence not only determines the generator restoration sequence, but also lays the foundation for the later load restoration (LIU et al., 2016).
2.1 Restoration model for generators
There are two types of generators in the power system, black-start (BS) generators and non-black-start (NBS) generators (Alassi et al., 2021). BS generators mainly refer to generators with self-starting capability after a large blackout, while NBS generators are generators that require external starting power to start.
The generator model used in this paper mainly considers factors such as the capacity, starting power, ramp rate and hot start time limit of the generator to be started. As shown in Figure 1. Among them, the maximum active power
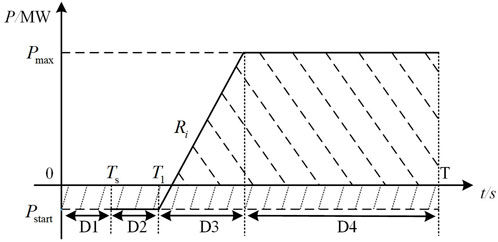
FIGURE 1. Power generation curve of generator.
While the real time
While
In the formula,
While
While
In order to show the modeling process more clearly, its flow chart can be seen in Figure 2.
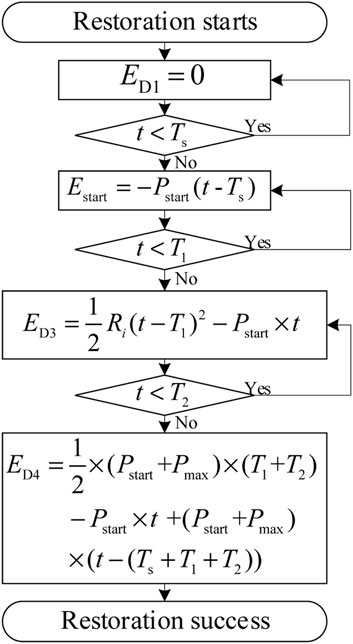
FIGURE 2. Flow chart of the restoration model for generator.
According to the above analysis, assuming that
In the formula, t represents the real-time time in the power system restoration process,
2.2 The objective function
The main goal of this paper is to hot start as many non-black start generators as possible, so that each generator can run with load as soon as possible to achieve the goal of maximizing power generation during the restoration process. Based on the above analysis, the power generation of the system can be simplified as the following formula.
In the formula,
2.3 Constraints
2.3.1 Startup power constraint
The starting power determines the success of the NBS generator’s start-up, and is the most critical factor that affects the start-up of the generator. The starting power sources provided in the system are mainly divided into two parts, one is the output power of the BS restoration in the power system in the initial stage after the blackout, and the other is the output power of the NBS generators that are restarted during the restoration process. The starting power constraint means that the starting power of the generator to be started cannot be greater than the power that the system can provide to it at any time. Its expression is:
in the formula,
2.3.2 Startup time limit
The start-up time limit is the maximum start-up time limit and the minimum start-up time limit of the generator. The maximum start-up time limit is the time limit that the generator can be hot started. If the time limit is exceeded, the generator will not be hot start. The minimum start time is the time the generator must wait to start after cooling down after missing a warm start. The constraint expression is as follows:
In the formula,
2.3.3 Node voltage constraints
The main research content of this paper is the decision-making of the restoration sequence of the generator set, rather than the dynamic balance of the system during the restoration process (Mahmoud et al., 2021). Therefore, the node voltage constraints representing the steady-state characteristics are selected:
In the formula,
3 Research on the decision-making method of serial restoration sequence of generators based on Monte Carlo tree search algorithm
The restoration of generators after a major power blackout requires not only the decision on the sequence of generator restoration and startup, but also the determination of the path for each generator to restore power supply. The restoration of the power system is gradually completed by restoring each generator through the power supply path in a reasonable and orderly manner.
3.1 Decision on the serial restoration sequence of generators
3.1.1 Introduction to Monte Carlo tree search algorithm
Game theory gradually becomes a powerful tool and methodology to solve complex decision-making issues, which is applied to smart energy and electric power systems (Cheng and Yu, 2019; Cheng et al., 2021). The Monte Carlo tree search algorithm is a heuristic search algorithm based on tree data structure, which is effective even when the search space is huge. Details can be found in (CAMERON et al., 2012).
As showed in Figure 3, a brief introduction to the process of Monte Carlo tree search algorithm named Monte Carlo tree search algorithm can be divided into 4 stages: selection, expansion, simulation and back propagation.
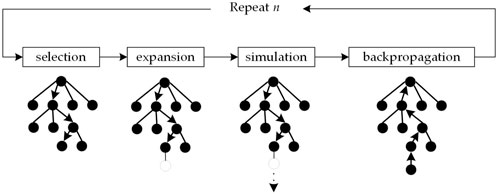
FIGURE 3. Introduction to the Monte Carlo tree search algorithm.
In the selection stage of the Monte Carlo tree search algorithm, starting from the root node, a decision is made by comparing the values of the nodes to be selected, and the child node with the greatest value is selected.
In the expansion stage of the Monte Carlo tree search algorithm, according to the value of its child nodes (Upper Confidence Bound Apply to Tree, UCT), after expanding the current node, a new node will be created in the decision tree as a new child node of the node.
In the simulation stage of the Monte Carlo tree search algorithm, the current node move selection is simulated to the end according to a random strategy. The result of the simulation can be any value, denoted as Q(v).
The value in the backpropagation stage of the Monte Carlo tree search algorithm is propagated in the reverse direction along the decision tree to the root node in turn, and the state of the node that started the Monte Carlo simulation changes to Visited.
The above four steps are one iteration of Monte Carlo search. After repeated iterations, the Monte Carlo tree search is ended after the number of simulation budgets is reached, and the final decision is made.
3.1.2 Application of Monte Carlo tree search algorithm
The flow chart of the Monte Carlo tree search algorithm for the decision-making of the serial restoration sequence of the generator is shown in Figure 4.
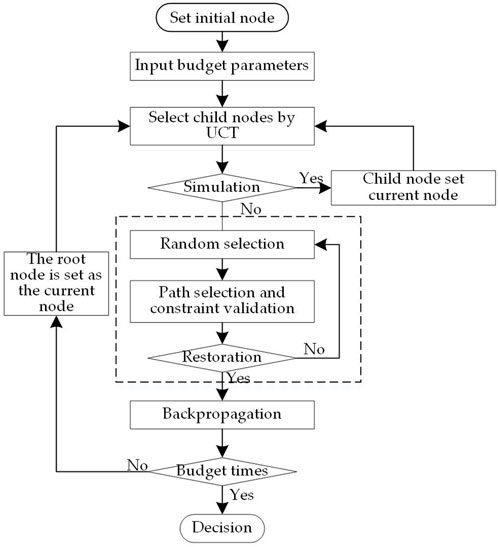
FIGURE 4. Flow chart of generator startup sequence decision-making.
In the figure, the steps in the dotted square are the Monte Carlo simulation part, and all the extended sub-node actions are performed randomly. Start the generator non-black and get all the relevant information about the restoration plan in this sequence.
The detailed steps are as follows:
Step 1: Initialize:
Step 1.1: Set the current node as the root node.
Step 1.2: Enter the budget number of Monte Carlo simulations.
Step 2: Tree Policy:
Step 2.1: Starting from the current node, search for the best child node according to the tree strategy principle of the Monte Carlo tree search algorithm.
Step 2.2: Check whether the selected best child node is an extensible node, if the node is an extensible node, the loop process goes to step 3.1. If it is not an expandable node, loop back to step 2.1 and start from the parent node of the selected node instead of the root node.
Step 3: Preset Policy:
Step 3.1: Randomly select a node from the list of optional nodes and expand it as a child node.
Step 3.2: Select the power supply path through Dijkstra’s algorithm, and then verify the constraints.
Step 3.3: Check if the optional node list is empty. If the optional list is empty, go to step 4. If there are still options in the list, go back to step 3.1.
Step 4: Backpropagation.
Step 5: Check whether the number of Monte Carlo simulations reaches the preset value If it reaches the preset value, go to step 6. If not, return to step 2 to continue the next expansion and simulation.
Step 6: Make a decision on the program.
3.2 Decision of restoration path
3.2.1 Introduction to Dijkstra’s algorithm
Dijkstra’s algorithm is a classic algorithm for solving the shortest path, which uses the greedy idea to search for the shortest distance between target nodes (Su et al., 2021). The decision-making process of the shortest path is shown in Figure 5 below, a brief description of Dijkstra’s algorithm:
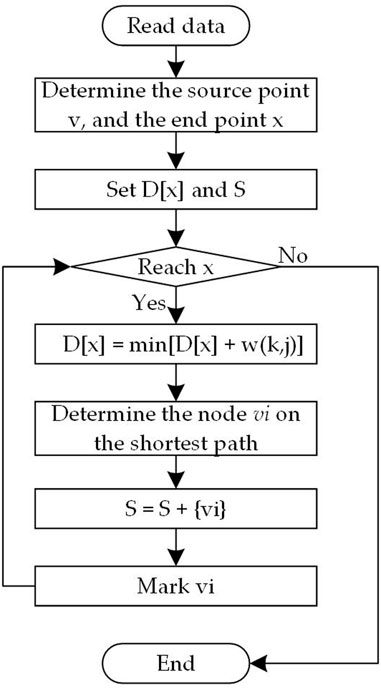
FIGURE 5. Flow chart of Dijkstra’s algorithm.
The basic flow of the algorithm is briefly described as follows: Assuming that the set of nodes in the system is
3.2.2 Application of Dijkstra’s algorithm
When the non-black-start generator to be started is determined, the corresponding power supply path is obtained through the Dijkstra’s algorithm, as shown in Figure 6.
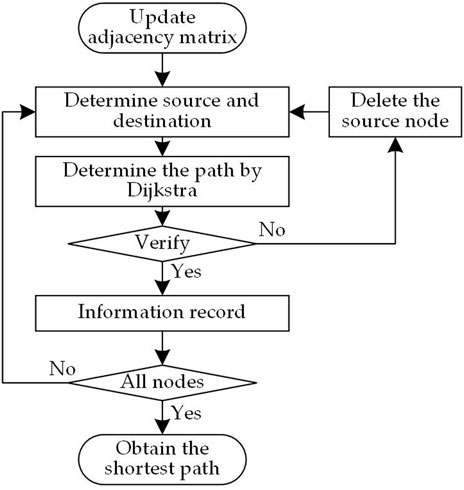
FIGURE 6. Flow chart of the decision making of restoration path.
The detailed steps are as follows:
Step 1: According to the actual power system, upload line information to form an adjacency matrix.
Step 2: Set the start and end nodes.
Step 3: Apply Dijkstra’s algorithm to search the shortest path to obtain the shortest path from the start node to the end node.
Step 4: Judge the constraints. If the constraints are satisfied, go to step 5. Otherwise, delete this startup node and return to step 2.
Step 5: Recording of information.
Step 6: Check if all optional nodes are selected as startup nodes. Yes, go to step 7. Otherwise, go back to step 2.
Step 7: According to the recorded information, get the final shortest path from the optional node to the end node.
3.3 Decision-making for serial restoration of generators
The complete decision-making process of generators restoration is shown in Figure 7 below:
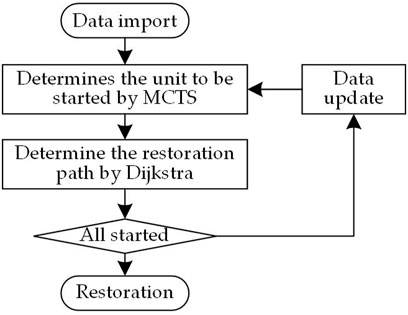
FIGURE 7. Flow chart of the offline decision making of the power system restoration.
First, upload the data of the power system to the decision-making program, including the number of generators, rated capacity, starting power and hot start time limit, and the connection relationship of the transmission lines. Then, the Monte Carlo tree search algorithm is applied to make the decision of the first generator to be started. After the restoration target is determined, the Dijkstra’s algorithm is applied to select the path from the recovered network to the target. It should be noted that the verification of constraints is carried out in the process of generator and path selection. Then, it is judged whether the generator is fully started. If so, the generator is restored. If not, the state of each component of the system is updated and the cycle is entered to determine the next generator to be started and its power restoration path. Finally, cycle until all generators are restarted successfully.
4 Example analysis
The IEEE 39 bus system is used to conduct simulation experiments to verify the effectiveness of the serial restoration sequence decision method proposed in this paper. The simulation experiment environment is a desktop computer with 3.7 GHz CPU and 16 GB RAM.
4.1 Simulation of the IEEE 39 bus system
The structure of the IEEE 39 bus system is shown in Figure 8 below, with a total of 10 generators, and the relevant parameters of each generator are listed in Table 1. Among them, G33 is a black-start generator, so there is no need to consider its starting power, starting time and hot-starting time limit. G39 is regarded as an external equivalent power supply, so its restoration is not considered. The hot start time limit of G30 and G34 is relatively small, 25 and 15 min respectively, and it should be considered to start them within the hot start time limit in the restoration sequence decision of the generator. The G31 has the maximum power rating and start-up time of 1,145.55 MW and 65 min, respectively.
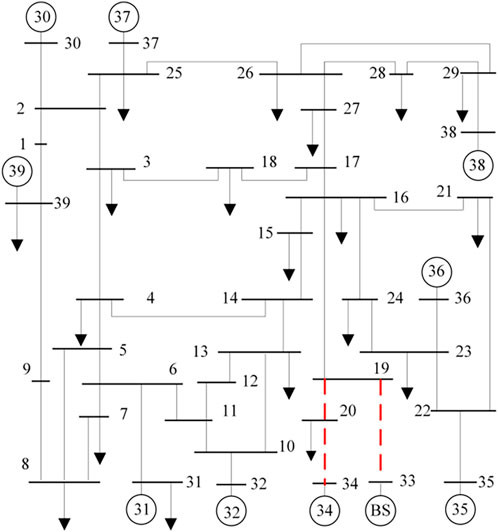
FIGURE 8. Backbone network of the IEEE 39 bus system.
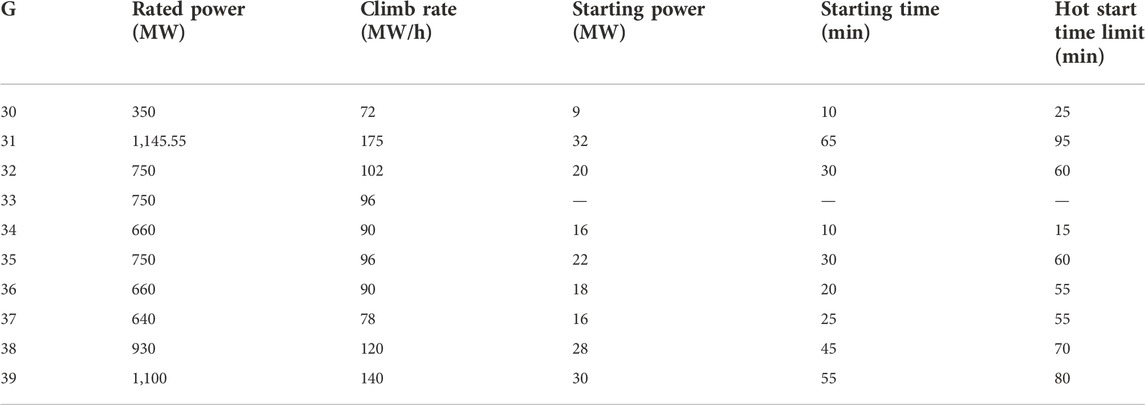
TABLE 1. Related parameters of the generators.
The above test system has a total of 46 transmission lines, and the restoration time of each transmission line is shown in Table 2. The restoration time between different transmission lines is not much different, the maximum restoration time is 4 min, and the minimum restoration time is 1 min.
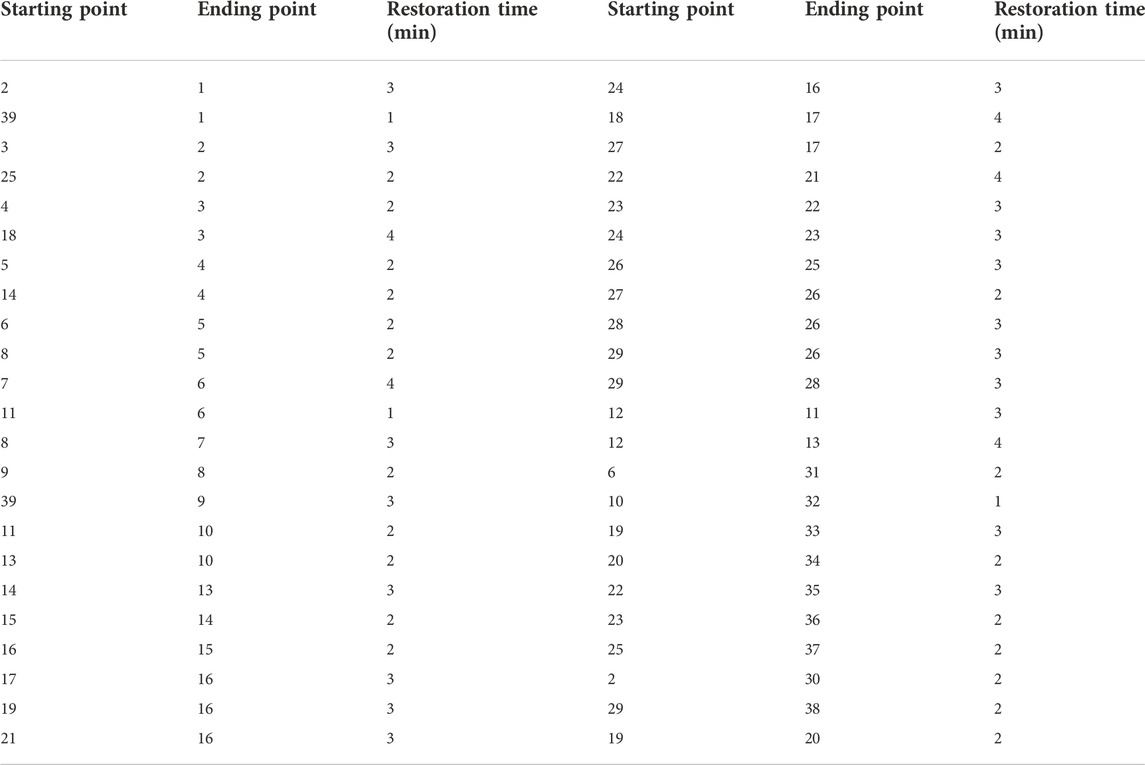
TABLE 2. The restoration time of transmission lines.
In this scenario, the initial conditions and related parameter settings of the power system are the same as in the literature (SUN et al., 2018): the generator located at the No. 33 bus is set as a black-start generator. Transmission lines, G33 and G34, represented by the dashed lines in Figures 4–10, have been restored. There are 7 non-black start generators left in this test system waiting to start. If a generator cannot be warm-started, it will be the last generator to be started by default. In order to improve the brevity of the article, the two generators G33 and G34 that have been started by default will not appear in the subsequent generator restoration sequence (the same below). The parameters are set as follows: Q(v) is defined as the power generation value of the scheme, c is 200000, T is 300 (minutes), the Monte Carlo simulation preset number is set to 10000, and the time required for each transmission line to be put into operation same as its expected value.
The decision-making process for the generator restoration sequence is as follows:
Step 1: Upload various parameters of the current power system to the decision-making system, and set the initial state of the power system after the blackout as the root node, which is also the current node.
Step 2: Decision:
Step 2.1: Determine a non-black-start generator to be started and its power supply path. During the first Monte Carlo tree search cycle, all non-black-started generators have not been searched, at which point they have the same UCT value, an infinite positive value. Therefore, a generator is selected as the best option by random selection and expanded as a child node of the current node, and the first Monte Carlo simulation is started with this child node as the starting point, and relevant parameters are obtained by simulating the entire restoration process and assign to this node. Through the seven Monte Carlo tree search cycles described above, all non-black-started generators each represent a child node of the root node and have the associated parameter assignments. Therefore, in the eighth cycle, in the expansion stage of the Monte Carlo tree search algorithm, all child nodes will be compared, and the child node with the largest UCT value will be found to expand the decision tree. Through the cyclic expansion decision tree of the above steps, it provides effective guidance for subsequent generator restoration decisions.
Step 2.2: Make a decision on the generator to be started. G32 and its corresponding power supply path (19-16-15-14-13-10-32) are the output results of the first decision. This decision is determined according to the objective function, and G32 is determined as the first generator to be started, which means that in the restoration sequence of all generators that have been detected, starting the generator first can generate the maximum power generation for the entire restoration process.
Step 2.3: Check whether the generator is fully started. The purpose of this step is to confirm whether all non-black-started generators have been restored successfully, if so, go to step 3, if not, go to step 2.1. Through the cycle of step 2, the sequence of the subsequent generators to be started is determined in turn: 31-36-35-38-37-30.
Step 3: The decision is made. It can be seen that the restoration scheme can generate 6,106.7 MW h of power generation for the whole restoration process.
Considering the influence of active power capacity, ramp rate, required starting power, required starting time, critical maximum interval, etc., G32 was decided to be the first generator to be started (the hot start time limit of G32 is 16 min). It can not only ensure that more generators can be hot-started in the future, but also bring the maximum power generation to the whole restoration process. The decision-making of subsequent generators is similar. In particular, because the hot start time limit of G30 is 9 min, and the hot start time limit of the remaining non-black start generators is more than 50 min, the hot start time limit has less binding force on the decision-making of the generators. The decision of subsequent generators mainly considers the power generation provided by each generator for the whole restoration process. Therefore, G31 with a maximum rated power of 1,145.55MW was decided as the second generator to be started. The power supply path is 10-11-6-31, and it takes 5 min to restore the path. Similarly, the restoration sequence of the remaining 6 non-black start generator sets is 36-35-38-37-30.
Because the power outage time of G30 is too long, the power outage is 11 min, and the maximum start-up time is less than 25 min, so the hot start of the generator cannot be realized even if it is used as the first generator to be started. The shortest path from the restored system to the G30 is 19-16-17-27-26-25-2-30, it takes 17 min to restore the path, and the startup power cannot be transferred to the G30 within the hot start time limit. Therefore, this generator was decided to be the last non-black start generator to be started.
In order to make the reader intuitively observe the result of the decision-making of the generator’s restoration sequence, the result of the decision-making of the whole generator’s restoration sequence is shown in Figure 9. The numbers in the transmission lines represent the order in which the lines are charged during the actual restoration process, while the red circles The numbers indicate the restoration sequence for non-black-started generators. For example, the number in G32 of the generator connected to No. 32 bus is 1, which means it is the first generator to be started (G33 and G34 are not counted). According to the number in the transmission line, it can be known that the power generator path is 19-16-15-14-13 -10-32.

FIGURE 9. Brief diagram of the result of offline decision making.
The simulation results are shown in Table 3. It can be seen from the experimental results that the combination of the Monte Carlo tree search algorithm and the Dijkstra’s algorithm can realize the decision of the generator restoration sequence.
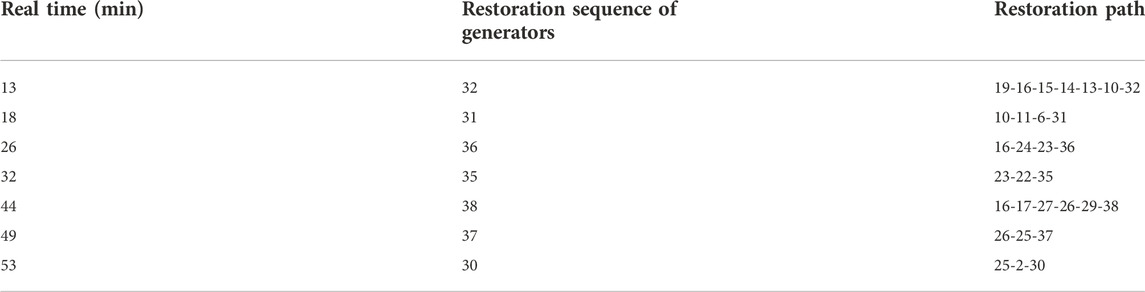
TABLE 3. The restoration scheme.
4.1.1 Comparison with some published works
To validate the effectiveness and accuracy of the proposed method, the results obtained by the proposed method are compared with those obtained by two methods in (Liu and Gu, 2007; SUN et al., 2018), as shown in Table 4. Method proposed by (SUN et al., 2018) is an online method which obtains a generator restoration sequence by searching the next transmission line to be restored based on real-time situation. Method proposed by (Liu and Gu, 2007) obtains a skeleton network based on the topological characteristics of power network. In the same initial situation as described in Figure 9, those two methods are also used to output a generator restoration sequence. The results of all methods are showed in Table 4: The total generation capability and the total restoration time of power system.
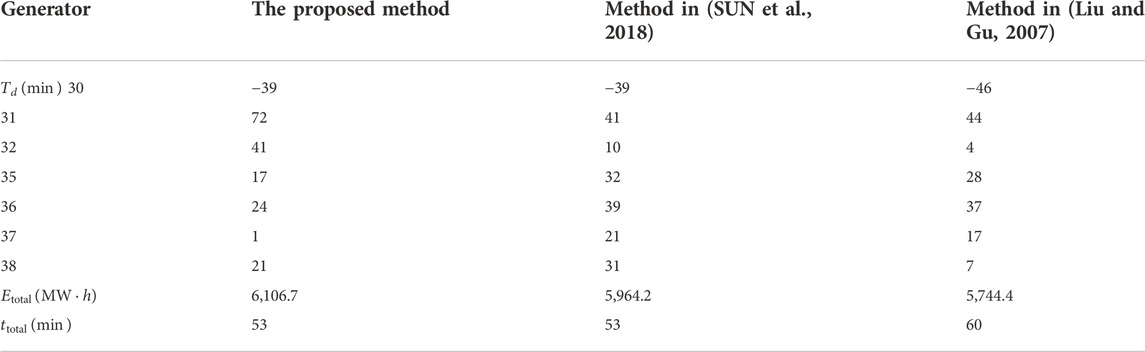
TABLE 4. Results provide by different methods.
In Table 4,
The difference between the wait time and hot-start time of generator and total generation capability are shown in Table 4. The wait time of generator refers to the duration form the time when the generator is outage to the time when the generator is connected to the recovered power system.
The restoration scheme provided by the proposed method has the maximum
4.2 Simulation of local actual power grid in Hebei
In this section, in order to verify the practicability of the method proposed in this paper, a simulation experiment is carried out by applying some actual power systems in Hebei Province. The system includes 16 units, 103 bus bars and 169 transmission lines (GU et al., 2016). The backbone network of the system is shown in Figure 10 below.
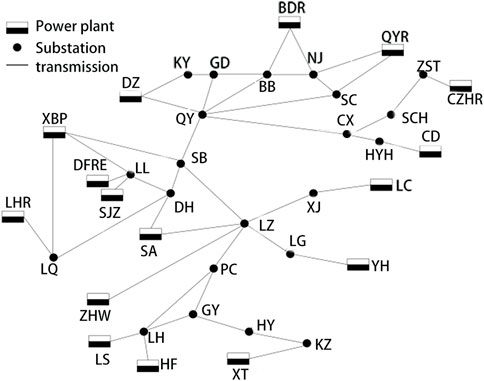
FIGURE 10. Backbone network of the part of Hebei power grid.
The following assumptions are made for the system: the power plant in ZHW is a BS generator, which restarts immediately after a major blackout in the power system to provide starting power for the system. BS generators need to run for 2 hours to reach rated power, with zero downtime for all NBS generators. For detailed data on the generator, refer to (GU et al., 2016). The recovery time of each transmission line is 5 min, and other parameter settings are the same as those in the case of no fault in the test system above. The restoration scheme of the actual system obtained according to the decision method in this paper is shown in Table 5.
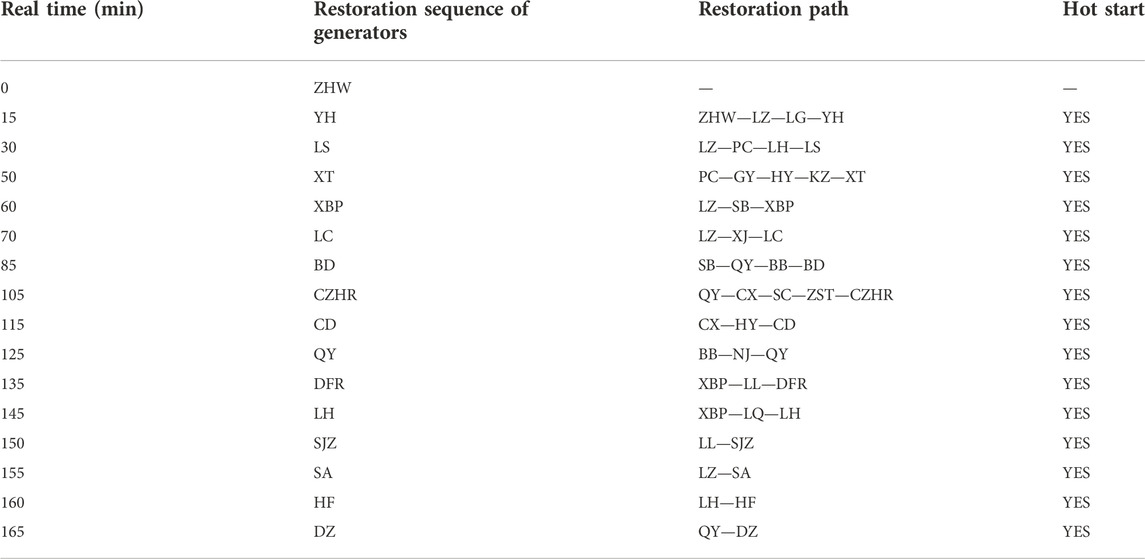
TABLE 5. The restoration schemes of the partial Hebei power system.
It can be seen from the experimental results that YH Thermal Power Plant is the best sub-node among all the schemes explored by the Monte Carlo simulation. By restoring the power supply path: ZHW—LZ—LG—YH. The restart of YH Thermal Power Plant can be started by external starting power 15 min after the blackout. Then, update the system data, mark YH Thermal Power Plant and its power restoration path, and start the next Monte Carlo tree search with the current state as the starting point. The decision results of other generator’s restoration are listed in Table 5 and will not be repeated.
According to the experimental results, it is of guiding significance to provide a system restoration plan for the actual power grid in Hebei. The 15 non-black start-up generators in the system follow the method proposed in this paper. The restoration plan not only satisfies various constraints, but also achieves an ideal power generation capacity of 4,406.4 MW h. And all non-black-started generators are hot-started.
5 Conclusion
In this paper, the objective function is to maximize the power generation during the restoration process, and various conventional constraints such as voltage, hot start, starting power and other factors are considered. Combined with Monte Carlo tree search algorithm and the Dijkstra’s algorithm, a method for sequence decision-making of generators serial restoration after large power blackout is proposed. Among them, the Monte Carlo tree search algorithm is utilized to study and determine the sequence of generator restoration, and the Dijkstra’s algorithm is utilized to search for the power supply path with the shortest restoration time. Finally, the effectiveness and accuracy of the proposed method were verified in the IEEE 39 bus system and the actual local power grid in Hebei.
Data availability statement
Publicly available datasets were analyzed in this study. This data can be found here: https://ieeexplore.ieee.org/document/8590687.
Author contributions
Conceptualization, WX; Methodology, GH; Software, SC; Validation, NY; Resources, GH; Writing—review and editing, WX; Project administration, HX. All authors have read and agreed to the published version of the manuscript.
Conflict of interest
Authors WX, SC, GH, NY, and HX were employed by the company Guangxi Beihai Power Supply Bureau of China Southern Power Grid.
Publisher’s note
All claims expressed in this article are solely those of the authors and do not necessarily represent those of their affiliated organizations, or those of the publisher, the editors and the reviewers. Any product that may be evaluated in this article, or claim that may be made by its manufacturer, is not guaranteed or endorsed by the publisher.
References
Adibi, M., Cellan, P., Fink, L., Happ, H., Kafka, R., Raine, J., et al. (1987). Power system restoration - a task force report. IEEE Trans. Power Syst. 2 (2), 271–277. doi:10.1109/tpwrs.1987.4335118
Adibi, M., Fink, L., Andrews, C., Arsanjani, F., Lanier, M. W., and Miller, J. M. (1992). Special considerations in power system restoration. IEEE Trans Power Syst. 7 (4), 1419–1424. doi:10.1109/MPER.1992.161433
Alassi, A., Ahmed, K., Egea-Àlvarez, A., and Ellabban, O. (2021). Innovative energy management system for MVDC networks with black-start capabilities. Energies 14 (8), 2100. doi:10.3390/en14082100
Andersson, G., Donalak, P., Farmer, R., Hatziargyriou, N., Kamwa, I., Kundur, P., et al. (2005). Causes of the 2003 major grid blackouts in north America and europe, and recommended means to improve system dynamic performance. IEEE Trans. Power Syst. 20 (4), 1922–1928. doi:10.1109/tpwrs.2005.857942
Browne, Cameron B., Powley, E., Whitehouse, D., Lucas, S. M., Cowling, P. I., Rohlfshagen, P., et al. (2012). A survey of Monte Carlo tree search methods. IEEE Trans. Comput. Intell. AI Games 4 (1), 1–43. doi:10.1109/tciaig.2012.2186810
Cameron, B., Edward, P., Daniel, W., Lucas, S. M., Cowling, P. I., Rohlfshagen, P., et al. (2012). A survey of Monte Carlo tree search methods. IEEE Trans. Comput. Intell. AI Games 4 (1), 1–43. doi:10.1109/tciaig.2012.2186810
Cheng, L. F., Yin, L. F., Wang, J. H., Shen, T., Chen, Y., Liu, G. Y., et al. (2021). Behavioral decision-making in power demand-side response management: A multi-population evolutionary game dynamics perspective. Int. J. Electr. Power & Energy Syst. 129, 106743. doi:10.1016/j.ijepes.2020.106743
Cheng, L. F., and Yu, T. (2019). A new generation of ai: A review and perspective on machine learning technologies applied to smart energy and electric power systems. Int. J. Energy Res. 43 (6), 1928–1973. doi:10.1002/er.4333
Chu, R. F., Holen, A. T., and Liu, C. C. (1993). Generation capability dispatch for bulk power system restoration: A knowledge-based approach. IEEE Trans. Power Syst. 8 (1), 316–325. doi:10.1109/59.221225
Desai, J. P. (2021). “Analysis of power swings and blackouts,” in Proceedings of the 2021 IEEE Congreso Estudiantil de Electrónica y Electricidad (INGELECTRA), Valparaíso, Chile, November 2021 (IEEE), 1–6.
Gu, X. P., Liu, W. X., Wang, J. Y., and Jia, J. H. (2016). An optimization approach based on multiple time-step coordination for decision making of unit restoration. Trans. China Electrotech. Soc. 31 (21), 114–124.
Johnson, Donald B. (1973). A note on Dijkstra's shortest path algorithm. J. ACM (JACM) 20 (3), 385–388. doi:10.1145/321765.321768
Ketabi, A., Asmar, H., Ranjbar, A., and Feuillet, R. (2001). “An approach for optimal units start-up during bulk power system restoration,” in Proceedings of the IEEE 2001 Large Engineering Systems Conference on Power Engineering (LESCOPE), Halifax, NS, Canada, July 2001, 190–194.
Leng, Y. J., Yue, X., Lu, Y. Q., and Zhao, S. P. (2022). Using information-theoretic Co-clustering for power system black-start decision making with incomplete information. Electr. Power Components Syst. 49 (6-7), 573–583. doi:10.1080/15325008.2021.1970056
Lindenmeyer, D., Dommel, H. W., and Adibi, M. M. (2001). Power system restoration — A bibliographical survey. Int. J. Electr. Power & Energy Syst. 23 (3), 219–227. doi:10.1016/s0142-0615(00)00061-2
Liu, Y., Sun, R., and Terzija, V. (2016). Power system restoration: A literature review from 2006 to 2016. J. Mod. Power Syst. Clean. Energy 4 (3), 332–341. doi:10.1007/s40565-016-0219-2
Liu, Y., and Gu, X. (2007). Skeleton-network reconfiguration based on topological characteristics of scale-free networks and discrete particle swarm optimization. IEEE Trans. Power Syst. 22 (3), 1267–1274. doi:10.1109/tpwrs.2007.901486
Mahmoud, M. A., Md Nasir, N. R., Gurunathan, M., Raj, P., and Mostafa, S. A. (2021). The current state of the art in research on predictive maintenance in smart grid distribution network: Fault’s types, causes, and prediction methods—a systematic review. Energies 14 (16), 5078. doi:10.3390/en14165078
Riou, M., Dupriez-Robin, F., Grondin, D., Le Loup, C., Benne, M., and Tran, Q. T. (2021). Multi-objective optimization of autonomous microgrids with reliability consideration. Energies 14 (15), 4466. doi:10.3390/en14154466
Sharma, N., Acharya, A., Jacob, I., Yamujala, S., Gupta, V., and Bhakar, R. (2021). “Major blackouts of the decade: Underlying causes, recommendations and arising challenges,” in Proceedings of the 2021 9th IEEE International Conference on Power Systems (ICPS), Kharagpur, India, December 2021, 1–2. doi:10.1109/ICPS52420.2021.9670166
Su, S., Wei, C., Li, Z., and Xia, D. (2021). Two-stage multi-period coordinated load restoration strategy for distribution network based on intelligent route recommendation of electric vehicles. World Electr. Veh. J. 12 (3), 121. doi:10.3390/wevj12030121
Sun, R., Liu, Y., and Wang, L. (2018). An online generator start-up algorithm for transmission system self-healing based on MCTS and sparse autoencoder. IEEE Trans. Power Syst. 34 (3), 2061–2070. doi:10.1109/tpwrs.2018.2890006
Zeng, S., Lin, Z., Wen, F., and Ledwich, G. (2012). A new approach for power system black-start decision-making with vague set theory. Int. J. Electr. Power & Energy Syst. 34 (1), 114–120. doi:10.1016/j.ijepes.2011.09.012
Zhang, G., Zhong, H., Tan, Z., Cheng, T., Qing, X., and Kang, C. (2022). Texas electric power crisis of 2021 warns of a new blackout mechanism. CSEE J. Power Energy Syst. 8 (1), 1–9. doi:10.17775/CSEEJPES.2021.07720
Nomenclature
Parameters
T The preset power system restoration time interval
D1 The standby state
D2 The start-up stage
D3 The climbing stage
D4 The stable operation state
Variables
t The real-time time in the power system restoration process
i The serial number of the generator to be restarted
J The serial number of the node in the power system
Q(v) The reward value in the backpropagation stage
Abbreviations
MCTS Monte Carlo tree search
FST Fuzzy set theory
BS Black-start
NBS Non-black-start
UCT Upper Confidence Bound Apply to Tree
DA Dijkstra’s algorithm
Keywords: generator restoration sequence, restoration path, serial restoration, hot start, Monte Carlo tree search, Dijkstra algorithm
Citation: Xu W, Chen S, Han G, Yu N and Xu H (2023) A Monte Carlo tree search-based method for decision making of generator serial restoration sequence. Front. Energy Res. 10:1007914. doi: 10.3389/fenrg.2022.1007914
Received: 31 July 2022; Accepted: 26 October 2022;
Published: 12 January 2023.
Edited by:
Dongming Fan, Beihang University, ChinaReviewed by:
Lefeng Cheng, Guangzhou University, ChinaBaoping Cai, China University of Petroleum, Huadong, China
Bin Liu, University of Strathclyde, United Kingdom
Copyright © 2023 Xu, Chen, Han, Yu and Xu. This is an open-access article distributed under the terms of the Creative Commons Attribution License (CC BY). The use, distribution or reproduction in other forums is permitted, provided the original author(s) and the copyright owner(s) are credited and that the original publication in this journal is cited, in accordance with accepted academic practice. No use, distribution or reproduction is permitted which does not comply with these terms.
*Correspondence: Wenwen Xu, NDcxNjA4OTA5QHFxLmNvbQ==