 Junhui Li
 Deyi Xu1,2
 Yongguang Zhu
94% of researchers rate our articles as excellent or good
Learn more about the work of our research integrity team to safeguard the quality of each article we publish.
Find out more
ORIGINAL RESEARCH article
Front. Energy Res., 27 September 2022
Sec. Sustainable Energy Systems
Volume 10 - 2022 | https://doi.org/10.3389/fenrg.2022.1007260
This article is part of the Research TopicCritical Energy Minerals: A Material Enabler for Carbon NeutralityView all 17 articles
Antimony is a type of critical metal for the energy transition. The antimony industry chain is distributed among the major developed and developing countries around the world. With the development of clean energy technology, the demand for antimony in photovoltaic and energy storage fields will increase significantly. Considering the significant changes in the global demand for antimony products and the serious supply shortage, people should pay more attention to the supply risk of related products of the antimony industry chain. In this paper, we propose a new integrated index to evaluate the supply risk of antimony industry chain related products, including Herfindahl Hirschman index, global governance index, human development index, global innovation index, and betweenness centrality in complex networks. Meanwhile, seven commodities in the antimony industry chain are selected for empirical analysis from 2011 to 2019. The results show that countries with high supply risks of the industry chain upstream include Canada, France, Germany, India, Japan, Thailand, and the United Kingdom. And, Australia, India, Japan, Thailand, and Vietnam are with high supply risks in the midstream of the industry chain. Meanwhile, Canada, India, Japan, and Thailand are with high downstream supply risks. Some countries, like China, the United States, and Germany, play a core role in different sectors of the industry chain. International competitive relations of countries have caused a high supply risk of products related to the antimony industry chain. The supply risk of the antimony industry chain shows that countries must strengthen industrial division and cooperation to maximize their interests. It is suggested to take the country-specific measures to mitigate supply risks, including establishing national inventories of critical materials, overseas investment, strengthening the guidance of industrial policies, and accelerating infrastructure construction.
Antimony is a non-renewable and valuable mineral with a wide range of industrial applications. Antimony is mostly used in the production of fire retardants, of which 20% is used in the manufacture of alloy materials, sliding bearings, and welding agents in batteries. Antimony also has many other uses. For example, antimony can form alloys with lead for various purposes, and the formed alloys are much higher in hardness and mechanical strength than antimony. Antimony can be used to make stabilizers and catalysts, as well as clarifiers. Antimony acetate can be used as a catalyst in the chemical fiber industry, and antimony chloride can be used in medicine. High purity antimony can be widely used in high-tech industries to produce semiconductors, far-infrared devices, and electric heating devices.
The unbalanced geographical distribution of antimony resources leads to differences in antimony resource types and reserves for different countries/regions. Specifically, the political instability and insufficient economic and social conditions in some mining countries pose a potential threat to antimony supply. In addition to political, economic and social factors, the technical impact on mining and metallurgical processes has also attracted more public attention. All these factors threaten the supply of related products of the antimony industry chain. Therefore, it is necessary to evaluate the supply risk of antimony industry chain related products.
Previous studies have focused on the criticality and supply risks of key metals, such as the reports from the United States National Research Council (Committee On Earth Council, 2008) and the US Department of energy, the assessment issued by Yale University and the EU study (Graedel and Nassar, 2015; Nuss et al., 2016). These studies define the metal supply risk based on various factors, such as consumption time based on production and reserves, recovery rate, market balance, substitutability, etc., These studies are mainly based on four main factors, namely geological availability, mining governance and policy stability, global market concentration and environmental sustainability.
However, as far as we know, the international trade and supply risks of related products of the antimony industry chain have received little attention so far. Most of the existing antimony research mainly focuses on the recycling of secondary antimony (Chancerel et al., 2013; Dupont et al., 2016; Anderson et al., 2019) and antimony substitutes (Henckens et al., 2016; Liu and Qiu, 2018). Some scholars have studied the trade flow of antimony ore in some specific countries.Chu et al. (2019) measured the import and export of antimony ore in China from 2006 to 2016. Adopt a complex network method to quantitatively analyze the evolution of international antimony ores trade patterns from 1993 to 2019.
We have not found any scholars that have studied international trade and supply risks of related products in the antimony industry chain. We believe that the two main reasons may have led to the neglect of trade in products related to the antimony industry chain in the past. One reason is that antimony is far less valued than other key metals (such as lithium, cobalt, nickel, and rare Earth) before it is widely used in clean energy. Another reason is that China has been the world’s Antimony mining center for decades, accounting for more than half of the world’s antimony production during the research period. However, these two situations have changed in the past decade. Antimony is becoming a clean energy metal, which has a wide application prospect in solar photovoltaic power generation and solar cells. With the decline of domestic antimony ore production, China’s import volume is also rising. Therefore, it is necessary to study international trade and supply risks of related products in the antimony industry chain.
The existing research has laid a solid foundation for analyzing the opportunities and challenges of the future development of the antimony industry. However, there is a lack of quantitative analysis of the trade status and supply risks of related products in the antimony industry chain. For important mineral resources with complex industry chains, supply risks should be comprehensively identified in the whole antimony industry chain. In the face of the current situation of rapid development of technology and industry, such an assessment becomes more important for those countries that hope to gain a firm foothold in the global antimony market in the future. To fill this research gap, this study quantitatively describes the current situation of the global antimony industry chain, systematically identifies the supply risks of related products in the antimony industry chain, and evaluates the import structure and risks of antimony-related products in 12 countries including Japan, China, and the United States from 2011 to 2019. The results show that there are significant supply risks in the global antimony industry chain, especially in the upstream antimony ore. This study has an in-depth understanding of the supply risk of commodities in the antimony industry chain. The full text is divided into five parts. After the introduction, these methods will be introduced in the next section. Then, it analyzes the current situation of the antimony industry chain and the supply risk of key commodities. On this basis, relevant policy recommendations are put forward. The last section summarizes the whole study.
Given the high degree of globalization of the antimony industry chain, this study selects 12 countries accounting for 80% of the global antimony product trade volume as the spatial boundary, and they are all major participants in the global antimony industry chain. The time boundary is set from 2011 to 2019. This period was chosen to reflect the latest state of the antimony industry chain.
The main processes in the antimony industry chain are shown in Figure 1. The industry chain can be divided into three main stages, namely antimony raw ore (upstream), antimony intermediate products (midstream), and antimony terminal products (downstream). In the upstream stage, Stibnite is the main source of antimony, and antimony mainly exists in Stibnite in nature. In the midstream stage, Antimony oxide is the main intermediate product of antimony. For the downstream stage, Pb-Sb alloy, lead-acid batteries, solders, fire retardants, and metal catalysts are the end products of antimony. The main use of antimony is to use its oxide (antimony trioxide) in the manufacture of refractory materials. Pb-Sb alloy is corrosion-resistant and is the preferred material for the production of vehicle and marine battery electrode plates; Antimony alloys with tin, aluminum, and copper have high strength and excellent wear resistance. They are excellent materials for manufacturing bearings, bushings, and gears. High purity antimony and antimony metal compounds (indium antimony, silver antimony, gallium antimony, etc.,) are also ideal materials for the production of semiconductors and thermoelectric devices. Among them, the antimony used in the production of fire retardants accounts for about 60% of the total consumption of antimony. The antimony consumed in the manufacture of alloy materials, sliding bearings, and welding agents in batteries accounts for about 20%, and the consumption of the other aspects is about 20%.
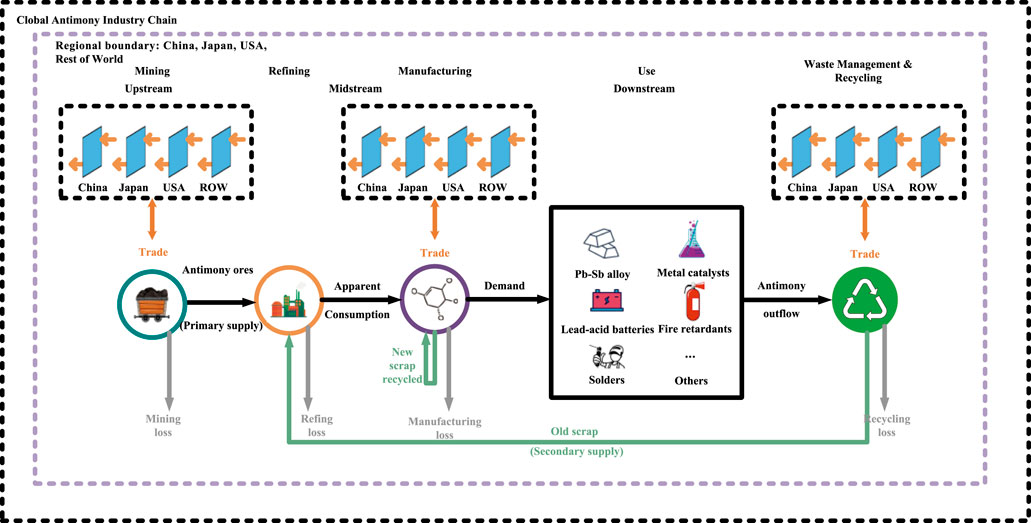
FIGURE 1. System definition of the antimony industry chain.
Supply risk refers to the probability of material supply interruption. Market concentration is widely used by economists and government regulators to describe supply risk. The research and development of antimony resources related technologies have a decisive impact on the supply of related products of the entire antimony industry chain. The government governance ability and social and economic development of the main exporting countries have a great impact on the supply of antimony resources. Some countries which are located in the important position of the antimony resource trade path controlled the supply lifeline of antimony resources. Therefore, the supply risk of antimony industry chain related products is analyzed from five aspects: market concentration, government management ability, social stability, technological innovation and trade control ability.
Market concentration. The Herfindal Hirschman index reflects the market concentration of the industry. The index is widely used in the market position and safety analysis of mineral resources in individual countries (Li et al., 2021; Gamarra et al., 2022; Xun et al., 2022; Yamamoto et al., 2022; Zhang et al., 2022). This study uses the HHI index of the global antimony product import (export) market to reflect the structural layout of the corresponding market. The theoretical value of HHI is between 0 and 1. The larger the index, the higher the market concentration. The lower the index, the lower the market concentration. Market concentration reflects the monopoly degree of the market. Markets with high concentration are usually dominated by a few countries, and markets with low concentration are more competitive.
where
Government’s management ability. WGI is a comprehensive indicator used to measure the six dimensions of governance of more than 200 countries and regions from 1996 to 2018, including Voice and Accountability (VA), Political Stability and Absence of Violence (PV), Government Effectiveness (GE), Regulatory Quality (RQ), Rule of Law and Control of Corruption (RC) (Henri, 2019; Gamarra et al., 2022). The range of all sub-indicators is from −2.5 (bad governance performance) to 2.5 (good governance performance). In these dimensions, PV has a significant correlation with the stability of the supply structure. For demonstration purposes, scale this value to 0e1 using Eq. 2.
Social stability. The social and economic development of antimony exporting countries (importing countries) affects the global supply of antimony products. The human development index (HDI) released by the United Nations Development Programme is a widely accepted standard to measure the social and economic development of countries since 1990. We calculate the social stability level of global antimony product supply according to the human development index of major exporting (importing) countries (Ebrahimi Salari et al., 2022; Zheng and Wang, 2022).
Technological innovation. Technological progress has a positive impact on the supply of antimony, especially the recovery and reuse technology of antimony. The global innovation index (GII) is an annual ranking jointly established by the world intellectual property organization, Cornell University, and the European School of business administration in 2007. It measures the performance of more than 120 economies in the world in innovation capacity (Hu et al., 2022; Jahanger et al., 2022; Kamguia et al., 2022; Lee and Wang, 2022). We use GII to measure the level of technological innovation in various countries. This indicator ranges from 0 to 100. For demonstration purposes, scale this value to 0e1 using Eq. 3.
Trade control. The control of each country (region) over cobalt resources is not only reflected on the terminal countries (regions) of resource flow, but also in the countries (regions) on the resource flow path that have an important impact on the overall material flow. Therefore, this study uses the betweenness centrality in complex networks to measure the trade control power of a country (region). Betweenness centrality refers to the number of shortest paths through a specified node (Chen et al., 2018; Wang et al., 2019; Chen et al., 2020; Chen et al., 2021; Zhang et al., 2021; Zheng et al., 2022). The higher the betweenness centrality is, the stronger the node’s control over the whole network is (Dong et al., 2020; Liang et al., 2020; Liu et al., 2020; Liu et al., 2022). The variable
The supply risk index (SRI) measures the relative interruption probability of different import combinations in a country, which is calculated by Eq. 5 (Xun et al., 2021). The index takes into account not only the import dependence and trade impact of the country, but also the political and technological environment of different importing countries. The higher the SRI, the higher the identifiable supply risk.
where
The data of this study is the trade data of products related to the antimony industry chain. Trade data comes from the United Nations commodity trade statistics database. Trade data include all import and export flows between countries and regions within the system boundary, and the unit of the trade volume is the kilogram.
Based on the three stages of the antimony industry chain, this study selected seven antimony-containing commodity trade volumes in 2011, 2013, 2015, 2017, and 2019. The upstream includes antimony ore (AO). Antimony in the middle reaches mainly exists in the form of an oxide (AOX). Downstream antimony-containing products include Pb-Sb alloy (PSA), lead-acid batteries (LAB), solders (SO), fire retardants (FR), and metal catalysts (MC). According to the HS code of commodities, these commodities are further divided into three categories: minerals, chemicals, and final products. The corresponding HS code is shown in Table 1.
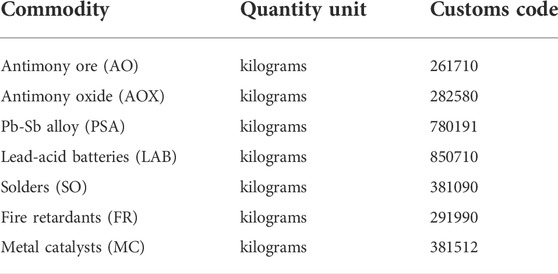
TABLE 1. International trade of commodities in the antimony industry chain.
The supply structure of key commodities in the global antimony industry chain from 2011 to 2019 is shown in Figure 2. In the upstream stage, due to the continuous fluctuation of Australian AO production, the supply structure of AO has also changed greatly in the past 9 years.
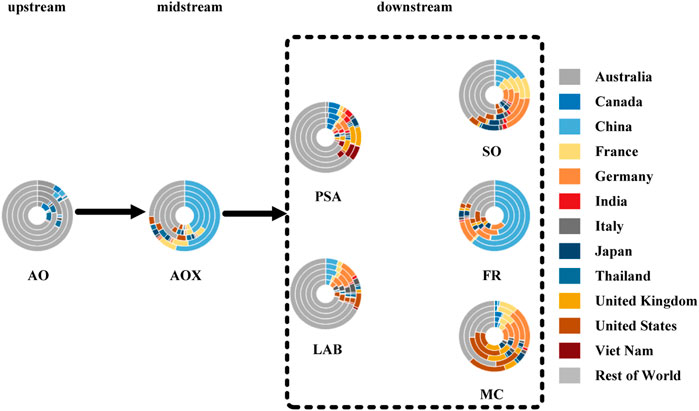
FIGURE 2. Supply structure in the global antimony industry chain.
In the midstream stage, the supply structure of AOX has not changed significantly from 2011 to 2019. The main supplier is China. Due to the rapid growth of China’s production, China has become a major source of AOX imports for all countries in the world.
In the downstream stage, the supply structure of LAB and SO has not changed significantly from 2011 to 2019. The main suppliers of PSA have changed greatly from 2011 to 2019, and their supply structure has been adjusted accordingly. From 2011 to 2019, the supply of FR in China maintained a steady growth. As for MC, the United States and Germany continue to maintain a high market share.
Figure 3 shows the import structure and risks of Germany, France, Italy and United Kingdom from 2011 to 2019. Germany, France, Italy and United Kingdom belong to European countries with similar economic environment and government system. The import structure and supply risk of antimony industry chain related products are similar.
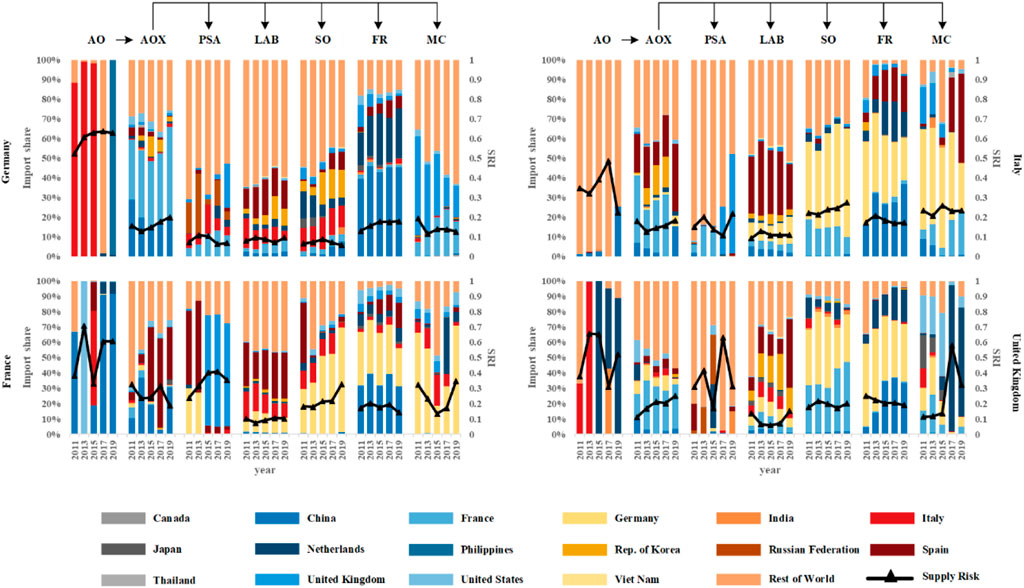
FIGURE 3. Import structures and risks of key commodities in the antimony industry chain in Germany, France, Italy and United Kingdom.
As far as Germany is concerned, in all stages of the antimony industry chain, there is a supply risk for commodities in the upstream stage. From 2011 to 2019, more than 88% of AO was imported from a single country, resulting in a high SRI. The supply risk of commodities in the middle and lower reaches is low and relatively stable. The SRI of AOX, FR, and MC are all maintained at about 0.15, while the SRI of PSA, LAB and the SO is relatively low, only about 0.07.
In the antimony industry chain of France, the supply risk, mainly exists in the upstream stage. The import structure of AO is relatively concentrated, and more than 60% of AO is imported from a single country, which leads to a high SRI. In the middle and lower reaches stage, the import structure remained relatively stable from 2011 to 2019, and the import share fluctuated slightly. The SRI of PSA, SO and MC increased in fluctuation. The SRI of PSA and FR decreased slightly. The supply risk of LAB is relatively low and stable, and there is little change in SRI value from 2011 to 2019.
In Italy’s antimony industry chain, supply risks mainly exist in the upstream stage. The import structure of AO is centralized, and more than 70% of AO is imported from a single country. In the middle and downstream stages, the supply risk of each commodity is relatively low. From 2011 to 2019, the supply risk of AOX, LAB, FR, and MC is relatively stable. The SRI of AOX, LAB, FRs, and MC is about 0.18, 0.09, 0.17, and 0.23 respectively. The supply risk of PSA and SO in the downstream stage is rising in fluctuation. From 2011 to 2019, the SRI of PSA increased from 0.15 to 0.22, and the SRI of SO increased from 0.22 to 0.27.
In the UK’s antimony industry, from 2011 to 2019, supply risks mainly lie in commodities in the upstream stage, PSA, and MC on the downstream stage. In the upstream stage, the import structure of AO is relatively concentrated, and the import share is constantly changing, resulting in SRI fluctuations at a high level. The supply risk of AOX in the midstream stage gradually increased due to the gradual reduction of import sources, and the SRI increased from 0.11 in 2011 to 0.25 in 2019. In the downstream stage, the import structure of PSA and MC is constantly changing, the SRI of PSA remains relatively stable in fluctuations, and the SRI of MC rises in fluctuations. The supply risk of LAB and SO in the downstream stage from 2011 to 2019 is relatively stable. The import structure of the FR has gradually changed from centralized to decentralized, resulting in a decrease in SRI from 0.25 in 2011 to 0.19 in 2019.
Figure 4 shows the import structure and risks of Australia, Canada, and the United States from 2011 to 2019. For Australia, Canada, and the United States, the whole antimony industry chain is relatively complete, but the supply risk of AO, AOX, and FR is relatively high.
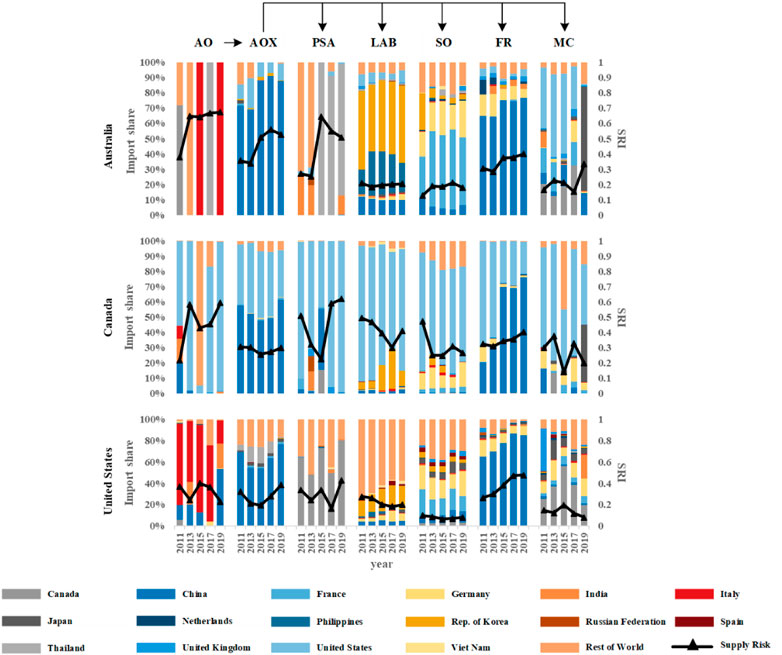
FIGURE 4. Import structures and risks of key commodities in the antimony industry chain in Australia, Canada, and the United States.
In Australia’s antimony industry chain, supply risks mainly exist in commodities in the upstream and midstream stages and PSA in the downstream stage. By weight, most AO is imported from a single country, resulting in a high SRI of more than 0.6. As the main producer of AO is China, the vast majority of AO is imported from China, resulting in a high SRI. From 2015 to 2019, the import mix of PSA changed, and the import share from Thailand decreased by about 15%. The less centralized import structure has reduced SRI by 14% in these 3 years. Due to the relatively stable import structure and import share, the SRI of LAB and SO does not fluctuate much. From 2011 to 2019, the share of FR imported from China increased by about 10%, which led to a small increase in SRI. As the import structure of MC changed in 2019, the import sources decreased, and Japan became the main import source country, resulting in a sharp rise in SRI.
As far as Canada is concerned, in all stages of the antimony industry chain, there are supply risks for commodities in the upstream stage and PSA in the downstream stage. In the upstream stage, the supply structure of AO is the most concentrated. Since 2013, more than 80% of AO has been imported from a single country, which leads to higher supply risks. Due to the fluctuation of supply share, the SRI of AO first decreased by 15% from 2013 to 2019, and then rose to a higher level. The supply risk of PSA is similar. Due to the change of import structure, SRI first fell sharply, then rose sharply and remained at a high level. Due to the fluctuation of import share, the SRI of LAB and MC are also fluctuating. In the middle and downstream stages, the supply risk of AO, SO and FR is significantly lower than that of upstream commodities.
As far as the United States is concerned, in all stages of the antimony industry chain, there are supply risks for commodities in the upstream and midstream stages, PSA and FR in the downstream stage. In the upstream and midstream stages, the import structure and import share have been changed from 2011 to 2019, resulting in the supply risk of AO and AOX also fluctuating. The import sources of PSA in the downstream stage are relatively concentrated, and SRI is also constantly fluctuating due to the changing import share. In the downstream stage, the share of FR imported from China continues to rise, with about 65% of FR imported from China, resulting in SRI rising from 0.27 in 2011 to 0.48 in 2019. The import structure of LAB and MC has gradually changed from centralized to decentralized, and the supply risk has gradually decreased. The import source and structure of SO remain relatively stable, and the SRI remains around 0.09.
Figure 5 shows the import structure and risks of Japan, India, and Thailand from 2011 to 2019. For Japan, India, and Thailand, the domestic antimony industry chain is weak in the upstream and midstream stages, and the supply risk of FR is high.
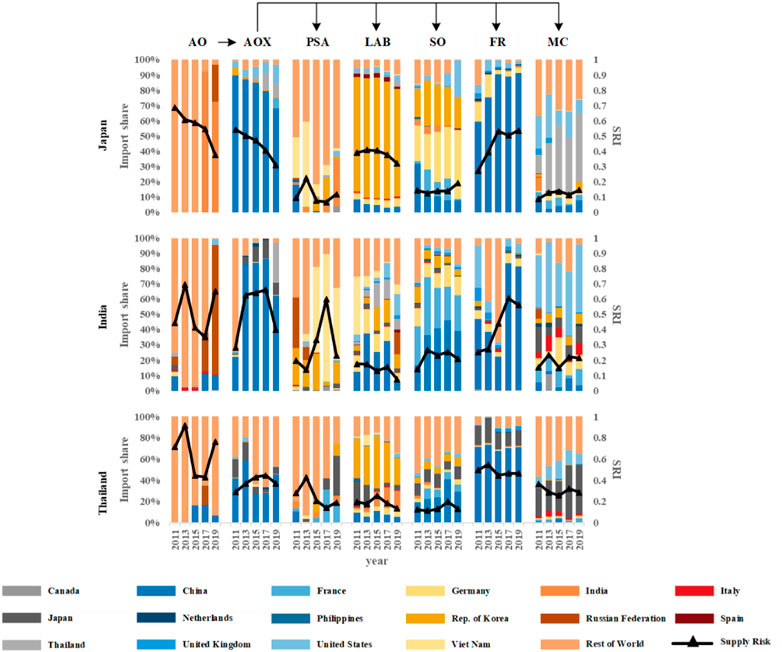
FIGURE 5. Import structures and risks of key commodities in the antimony industry chain for Japan, India, and Thailand.
As far as Japan is concerned, in all stages of the antimony industry chain, there are supply risks for commodities in the upstream and midstream stages, LAB and FR in the downstream stage. In the upstream and midstream stages, from 2011 to 2019, the import structure of AO and AOX has changed from relatively centralized to decentralized. Although the supply risk is still relatively high, SRI has decreased significantly. The SRI of LAB decreased slightly, from 0.39 in 2011 to 0.32 in 2019. The import sources of the FR are relatively concentrated, mainly from China, and the import quota gradually increased from 2011 to 2019, resulting in a doubling of SRI. In the downstream stage, the supply risk of PSA and MC also fluctuated due to the change in import share. The supply risk of SO increased slightly, from 0.14 in 2011 to 0.19 in 2019.
In India, from 2011 to 2019, supply risks mainly lie in commodities in the upstream and midstream stages, as well as PSA and SO in the downstream stage. In the upstream stage, the import structure of AO is relatively concentrated and the import source is single. Due to the change in import share, SRI rises in fluctuation, from 0.45 in 2011 to 0.65 in 2019. In the midstream stage, the main import source of AOX is China. Due to the fluctuation of import share, SRI first increased and then decreased, rising from 0.28 in 2011 to 0.4 in 2019. The supply risk of PSA and SO in the downstream stage changes similarly. Due to the change in import share, SRI first increases and then decreases. In the downstream stage, the supply risk of LAB, SO and MC is relatively stable. The SRI of LAB decreased by 10% from 2011 to 2019, while the SO and MC increased by about 6%.
In terms of Thailand, from 2011 to 2019, supply risks mainly lie in commodities in the upstream and midstream stages, as well as FRs in the downstream stage. In the upstream stage, the import structure of AO is relatively concentrated, and more than 75% of AO is imported from a single country, resulting in a high SRI. Due to the change of import share in the midstream stage, the supply risk of AOX first increased and then decreased from 2011 to 2019, and the SRI increased from 0.29 in 2011 to 0.37 in 2019. In the downstream stage, from 2011 to 2019, about 65% of FR were imported from China, resulting in higher supply risks. In the downstream stage, the SRI of LAB and MC fluctuated slightly due to the change in import share. The import structure of PSA has changed since 2013, with the increase of import sources and the gradual decline of supply risk. The supply risk of SO is relatively stable, and the SRI remains around 0.13.
Figure 6 shows the import structure and risks of Vietnam from 2011 to 2019. In Vietnam, from 2011 to 2019, supply risks mainly focused on PSA and MC in the upstream, midstream, and downstream stages. In the upstream stage, the import structure of AO in 2011 was single, and the supply risk was high. Since 2013, Thailand and Russia have become the main import sources, and the supply risk has decreased. In the midstream stage, the SRI of AOX first increased and then decreased due to the change in import structure. In the downstream stage, the import structure and source of PSA are constantly changing, resulting in the continuous fluctuation of supply risk. In the downstream stage, the import structure of LAB has become relatively concentrated from 2011 to 2019, with SRI rising from 0.19 in 2011 to 0.25 in 2019. The import structure of SO and FR has gradually become decentralized, resulting in a gradual decline in supply risk. From 2011 to 2019, the import sources of MC gradually increased, and the import structure gradually dispersed. Although the supply risk is still relatively high, SRI decreased by about 40%.
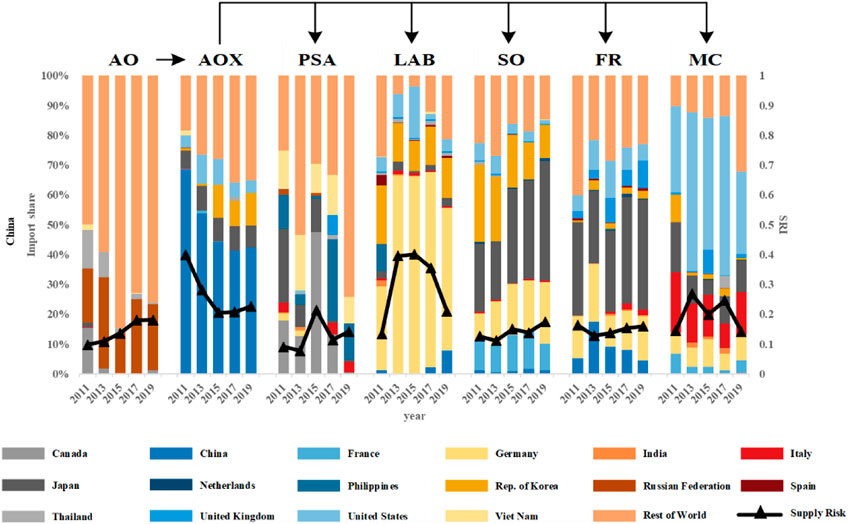
FIGURE 6. Import structures and risks of key commodities in the antimony industry chain in Vietnam.
Figure 7 shows the import structure and risks of China from 2011 to 2019. In China, from 2011 to 2019, supply risks were mainly identified in LAB in the antimony industry chain. Most labs are imported from Germany. During this period, the SRI of LAB experienced a small fluctuation, gradually rising from 0.13 to 0.21. In the upstream stage, the SRI of AO increased slightly to about 0.18. The decline of AO production in China has reduced the SRI of AOX by about half, from 0.4 in 2011 to 0.22 in 2019. In the downstream stage, the supply risk of PSA, SO, FR and MC are relatively low.
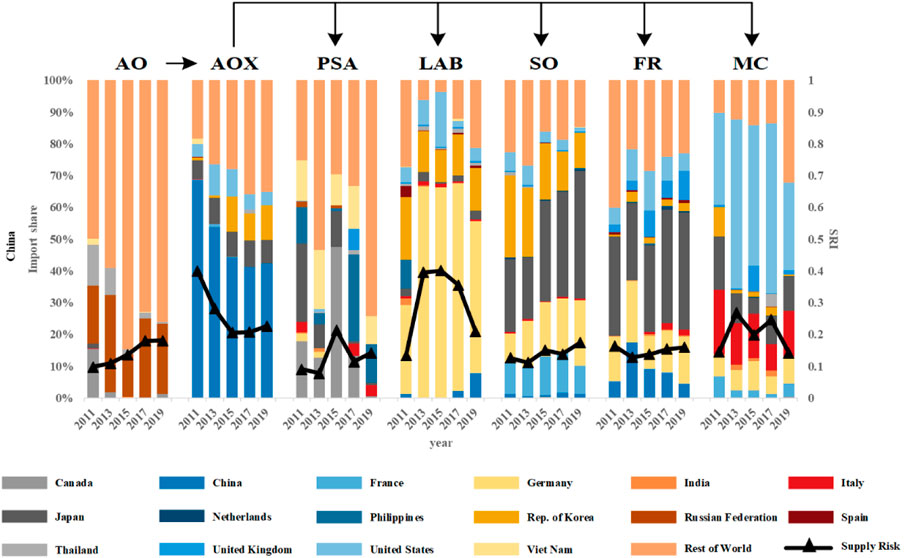
FIGURE 7. Import structures and risks of key commodities in the antimony industry chain in China.
Country-specific recommendations can be made based on the actual supply conditions of representative countries shown in Figure 3. In Germany, France, Italy, and United Kingdom, although the antimony industry chain is relatively complete and mature, the supply risk of AO urgently needs to be reduced. According to the EU 2020 list of key mineral resources, antimony is regarded as a key mineral. The defense industry and decarbonization strategies of the European Union and the United Kingdom describe the national objectives of promoting the development of the antimony industry. Under the guidance of these strategies, a large number of technology development and demonstration projects have been launched, providing strong support for the commercialization of antimony products. The long-term and clear development strategy has promoted the formation of a complete antimony industry chain in Germany, France, Italy, and the United Kingdom, making the four countries become the world leaders in antimony-related technologies. However, the lack of critical metal resources has seriously affected the safety of the antimony industry chain. The global antimony supply structure is difficult to change. The geographical distribution of antimony is too concentrated. For economic reasons, there is little international trade in antimony. The effective way to reduce risks in Germany, France, and the UK is to establish domestic inventories of refined antimony and increase the investment of overseas antimony mining companies. Italy can increase the mining volume of domestic antimony mines.
For Australia, Canada, and the United States, the whole antimony industry chain is relatively complete, but the supply risk of AO, AOX, and FR is relatively high. Australia, Canada, and the United States have successively listed antimony as a key mineral. As a well-established developed country, the long-term development strategy has promoted the formation of the antimony industry chain. As a powerful country in science and technology, high value-added industries gradually dominate, while low value-added industries are gradually eliminated, and even transferred abroad, resulting in the imbalance in the development of the domestic antimony industry chain. Antimony mining is closely related to the production of AOX and FR. Usually, antimony mining companies can take into account the mining of AO and the production of AOX and FR. Although Australia, Canada, and the United States are rich in antimony resources as large resource countries, the development of this industry has been stagnant due to the high cost of antimony mining, resulting in relatively high supply risks of AO, AOX, and FR. The effective way to reduce risks in Australia, Canada, and the United States is to improve policy and financial support for antimony mining companies and strengthen the research and development of antimony mining and beneficiation technology.
For Japan, India, and Thailand, the domestic antimony industry chain is weak in the upstream and midstream stages, and the supply risk of FR is high. Japan, India, and Thailand do not have sufficient antimony resources, resulting in the uneven development of the antimony industry chain, and the supply risk of AO, AOX, and FR is relatively high. The effective way to Japan, India, and Thailand to reduce risks is to increase investment in overseas antimony mining companies and establish a solid trade partnership with major antimony mining countries.
For Vietnam, the whole antimony industry chain is relatively complete, and there are supply risks in terms of MC. Vietnam has attracted a large number of foreign-funded enterprises to invest and build factories in its country because of cheap labor and preferential policies for foreign investment. Many foreign-funded enterprises have not only promoted the development of local antimony-related technology in Vietnam, but also established a complete antimony industry chain in Vietnam. Due to the high technical content involved in MC, the relevant technologies are firmly in the hands of a few countries. Moreover, due to the vigorous development of Vietnam’s industry and manufacturing industry, Vietnam has an increasing demand for MC, resulting in higher supply risks. At the national level, the government needs to strengthen the introduction of foreign investors and increase the R&D and application of new technologies to reduce supply risks. At the enterprise level, increase R&D investment and establish joint ventures to reduce supply risks.
For China, it is necessary to optimize and stabilize the whole antimony industry chain. At present, the domestic antimony industry chain is still in the stage of rapid development and maintains its development momentum with the strong support of the Chinese government. However, the production process of some antimony products in developed countries still lags far behind that in China. It is necessary to fully understand and evaluate the supply risks of commodities at all stages. At the national level, China must further establish a safe and reliable domestic production system. The government needs to improve the localization rate of key commodities in the antimony industry chain, such as LAB and MC. Specific measures can be taken, including strengthening policy support for the industry, increasing financial support for new technology research and development, demonstration, and application, and strengthening infrastructure construction. At the enterprise level, relevant manufacturers can digest, absorb, and rebuild the introduced technology, establish joint ventures, and speed up independent innovation to strengthen the weak nodes in the antimony industry chain.
Antimony will be widely used in new energy vehicles and energy storage devices and will play an important role in the energy transition. The risk of antimony supply will have a great impact on the energy transition. In this paper, we assess the antimony supply risk through the industry chain. This study has an in-depth understanding of the supply risk of commodities in the antimony industry chain from 2011 to 2019. The results show that there are significant supply risks in the current antimony industry chain. First, countries with high upstream supply risks in the industry chain include Canada, France, Germany, India, Japan, Thailand, and the United Kingdom. And, countries with high supply risks in the midstream include Australia, India, Japan, Thailand, and Vietnam. Meanwhile, countries with high downstream supply risks include Canada, India, Japan, and Thailand.
Some countries, like China, the United States, and Germany, play a key core role in different sectors of the industry chain. As different countries have advantages in different sectors of the industry chain, it is difficult for a single country to get rid of supply risks. The competitive advantage of the major developed countries lies in the terminal sector, while China’s competitive advantage lies in the upstream and middle industrial sectors. So, countries must strengthen industrial division and cooperation to maximize benefits. The supply risk of the industry chain will eventually be passed on to various countries and sectors. The governance of the antimony industry chain needs the active participation and open cooperation of governments all over the world. Establishing an open and cooperative trade environment is the best way to reduce the supply risk of antimony industry chain.
Publicly available datasets were analyzed in this study. This data can be found here: https://comtrade.un.org/.
YZ proposed the idea of this research; JL conducted research, analyzed data and wrote a paper; All authors discussed the results and revised the manuscript.
This research was jointly sponsored by Major Project of the National Social Science Foundation of China (No. 21&ZD106), Natural Science Foundation of China (Nos 71991482, 72204235, 72074197, 71991480, and 72164002), the Open Fund Project of Hubei Provincial Research Base for Regional Innovation Capacity Monitoring and Analysis Soft Science (No. HBQY 2022z11), and the Major Research Projects of Guangxi Department of Natural Resources in 2019 (Sub-bid C) (No. GXZC2019-G3-25122-GXGL-C).
The authors declare that the research was conducted in the absence of any commercial or financial relationships that could be construed as a potential conflict of interest.
All claims expressed in this article are solely those of the authors and do not necessarily represent those of their affiliated organizations, or those of the publisher, the editors and the reviewers. Any product that may be evaluated in this article, or claim that may be made by its manufacturer, is not guaranteed or endorsed by the publisher.
The Supplementary Material for this article can be found online at: https://www.frontiersin.org/articles/10.3389/fenrg.2022.1007260/full#supplementary-material
Anderson, C. G. (2019). Antimony production and commodities. Englewood: Society for Mining, Metallurgy, and Exploration, 1557.
Chancerel, P., Rotter, V. S., Ueberschaar, M., Marwede, M., Nissen, N. F., and Lang, K. D. (2013). Data availability and the need for research to localize, quantify and recycle critical metals in information technology, telecommunication, and consumer equipment. Waste Manag. Res. 31, 3–16. doi:10.1177/0734242x13499814
Chen, B., Li, J., Wu, X., Han, M., Zeng, L., Li, Z., et al. (2018). Global energy flows embodied in international trade: A combination of environmentally extended input-output analysis and complex network analysis. Appl. Energy 210, 98–107. doi:10.1016/j.apenergy.2017.10.113
Chen, F., Wu, B., and Lou, W. (2021). An evolutionary analysis on the effect of government policies on green R & D of photovoltaic industry diffusion in complex networkect of government policies on green R & D of photovoltaic industry diusion in a complex network. Energy Policy 152, 112217. doi:10.1016/j.enpol.2021.112217ffff
Chen, G., Kong, R., and Wang, Y. (2020). Research on the evolution of lithium trade communities based on the complex network. Phys. A Stat. Mech. its Appl. 540, 123002. doi:10.1016/j.physa.2019.123002
Chu, J., Mao, J., and He, M. (2019). Anthropogenic antimony flow analysis and evaluation in China. Sci. Total Environ. 683, 659–667. doi:10.1016/j.scitotenv.2019.05.293
Committee On Earth Council (2008). National, minerals, critical minerals, and the. Washington, DC: U.S.Economy.
Dong, G., Qing, T., Du, R., Wang, C., Li, R., Wang, M., et al. (2020). Complex network approach for the structural optimization of global crude oil trade system. J. Clean. Prod. 251, 119366. doi:10.1016/j.jclepro.2019.119366
Dupont, D., Arnout, S., Jones, P. T., and Binnemans, K. (2016). Antimony recovery from end-of-life products and industrial process residues: A critical review. J. Sustain. Metall. 2 (1), 79–103. doi:10.1007/s40831-016-0043-y
Ebrahimi Salari, T., Naji Meidani, A. A., Shabani Koshalshahi, Z., and Ajori Ayask, A. A. (2022). The threshold effect of HDI on the relationship between financial development and oil revenues. Resour. Policy 76, 102537. doi:10.1016/j.resourpol.2021.102537
Gamarra, A. R., Lechon, Y., Escribano, G., Lilliestam, J., Lazaro, L., and Caldes, N. (2022). Assessing dependence and governance as value chain risks: Natural Gas versus Concentrated Solar power plants in Mexico. Environ. Impact Assess. Rev. 93, 106708. doi:10.1016/j.eiar.2021.106708
Graedel, Harper, and Nassar, Philip (2015). “Criticality of metals and metalloids,” in Proceedings of the national academy of sciences of the United States of America.
Henckens, M. L. C. M., Driessen, P. P. J., and Worrell, E. (2016). How can we adapt to geological scarcity of antimony? Investigation of antimony's substitutability and of other measures to achieve a sustainable use. Resour. Conservation Recycl. 108, 54–62. doi:10.1016/j.resconrec.2016.01.012
Henri, P. A. O. (2019). Natural resources curse: A reality in africa. Resour. Policy 63, 101406. doi:10.1016/j.resourpol.2019.101406
Hu, D., Jiao, J., Tang, Y., Xu, Y., and Zha, J. (2022). How global value chain participation affects green technology innovation processes: A moderated mediation model. Technol. Soc. 68, 101916. doi:10.1016/j.techsoc.2022.101916
Jahanger, A., Usman, M., Murshed, M., Mahmood, H., and Balsalobre-Lorente, D. (2022). The linkages between natural resources, human capital, globalization, economic growth, financial development, and ecological footprint: The moderating role of technological innovations. Resour. Policy 76, 102569. doi:10.1016/j.resourpol.2022.102569
Kamguia, B., Keneck-Massil, J., Nvuh-Njoya, Y., and Tadadjeu, S. (2022). Natural resources and innovation: Is the R&D sector cursed too? Resour. Policy 77, 102725. doi:10.1016/j.resourpol.2022.102725
Lee, C., and Wang, C. (2022). Financial development, technological innovation and energy security: Evidence from Chinese provincial experience. Energy Econ. 112, 106161. doi:10.1016/j.eneco.2022.106161
Li, X., Qu, J., Zhao, Z., Zhao, Y., Xie, H., and Yin, H. (2021). Electrochemical desulfurization of galena-stibnite in molten salts to prepare liquid Sb–Pb alloy for liquid metal battery. J. Clean. Prod. 312, 127779. doi:10.1016/j.jclepro.2021.127779
Liang, X., Yang, X., Yan, F., and Li, Z. (2020). Exploring global embodied metal flows in international trade based combination of multi-regional input-output analysis and complex network analysis. Resour. Policy 67, 101661. doi:10.1016/j.resourpol.2020.101661
Liu, L., Cao, Z., Liu, X., Shi, L., Cheng, S., and Liu, G. (2020). Oil security revisited: An assessment based on complex network analysis. Energy 194, 116793. doi:10.1016/j.energy.2019.116793
Liu, M., Li, H., Zhou, J., Feng, S., Wang, Y., and Wang, X. (2022). Analysis of material flow among multiple phases of cobalt industrial chain based on a complex network. Resour. Policy 77, 102691. doi:10.1016/j.resourpol.2022.102691
Liu, T., and Qiu, K. (2018). Removing antimony from waste lead storage batteries alloy by vacuum displacement reaction technology. J. Hazard. Mater. 347, 334–340. doi:10.1016/j.jhazmat.2018.01.017
Nuss, P., Graedel, T., Alonso, E., and Carroll, A. (2016). Mapping supply chain risk by network analysis of product platforms. Sustain. Mater. Technol. 10, 14–22. doi:10.1016/j.susmat.2016.10.002
Wang, X., Yao, M., Li, J., Ge, J., Wei, W., Wu, B., et al. (2019). Global embodied rare earths flows and the outflow paths of China's embodied rare earths: Combining multi-regional input-output analysis with the complex network approach. J. Clean. Prod. 216, 435–445. doi:10.1016/j.jclepro.2018.12.312
Xun, D., Sun, X., Geng, J., Liu, Z., Zhao, F., and Hao, H. (2021). Mapping global fuel cell vehicle industry chain and assessing potential supply risks. Int. J. Hydrogen Energy 46 (29), 15097–15109. doi:10.1016/j.ijhydene.2021.02.041
Xun, D., Sun, X., Liu, Z., Zhao, F., and Hao, H. (2022). Comparing supply chains of platinum group metal catalysts in internal combustion engine and fuel cell vehicles: A supply risk perspective. Clean. Logist. Supply Chain 4, 100043. doi:10.1016/j.clscn.2022.100043
Yamamoto, T., Merciai, S., Mogollon, J. M., and Tukker, A. (2022). The role of recycling in alleviating supply chain risk–Insights from a stock-flow perspective using a hybrid input-output database. Resour. Conservation Recycl. 185, 106474. doi:10.1016/j.resconrec.2022.106474
Zhang, H., Wang, Y., Yang, C., and Guo, Y. (2021). The impact of country risk on energy trade patterns based on complex network and panel regression analyses. Energy 222, 119979. doi:10.1016/j.energy.2021.119979
Zhang, L., Chen, Z., Yang, C., and Xu, Z. (2022). Global supply risk assessment of the metals used in clean energy technologies. J. Clean. Prod. 331, 129602. doi:10.1016/j.jclepro.2021.129602
Zheng, J., and Wang, X. (2022). Impacts on human development index due to combinations of renewables and ICTs --new evidence from 26 countries. Renew. Energy 191, 330–344. doi:10.1016/j.renene.2022.04.033
Keywords: antimony, industry chain, supply structure, supply risk, ensemble index
Citation: Li J, Xu D and Zhu Y (2022) Global antimony supply risk assessment through the industry chain. Front. Energy Res. 10:1007260. doi: 10.3389/fenrg.2022.1007260
Received: 30 July 2022; Accepted: 12 September 2022;
Published: 27 September 2022.
Edited by:
Xiaoqi Sun, Shenzhen University, ChinaReviewed by:
Yanxin Liu, Capital University of Economics and Business, ChinaCopyright © 2022 Li, Xu and Zhu. This is an open-access article distributed under the terms of the Creative Commons Attribution License (CC BY). The use, distribution or reproduction in other forums is permitted, provided the original author(s) and the copyright owner(s) are credited and that the original publication in this journal is cited, in accordance with accepted academic practice. No use, distribution or reproduction is permitted which does not comply with these terms.
*Correspondence: Yongguang Zhu, emh1eW9uZ2d1YW5nQGN1Zy5lZHUuY24=
Disclaimer: All claims expressed in this article are solely those of the authors and do not necessarily represent those of their affiliated organizations, or those of the publisher, the editors and the reviewers. Any product that may be evaluated in this article or claim that may be made by its manufacturer is not guaranteed or endorsed by the publisher.
Research integrity at Frontiers
Learn more about the work of our research integrity team to safeguard the quality of each article we publish.