 Yongming Li1
 Yitao Huang
- 1State Key Laboratory of Oil and Gas Reservoir Geology and Development Engineering, Southwest Petroleum University, Chengdu, China
- 2No.1 Cementing Company, CNPC Bohai Drilling Engineering Company Limited, Renqiu, China
- 3Shale Gas Research Institute, PetroChina Southwest Oil & Gasfield Company, Chengdu, China
The research area of tight sandstone oil reservoirs was selected, a numerical model of the oil reservoir was developed, and a study of the development options and influencing factors was carried out to analyze the influence of different development methods, physical and engineering parameters on the development dynamics. Study shows that the two main factors limiting the efficient development of tight sandstone reservoirs are reservoir properties and formation energy. Fractured horizontal well injection huff and puff development can effectively improve reservoir physical properties and timely replenish formation energy, which is suitable for the development of such oil reservoirs. In dense sandstone reservoirs, its impact on production capacity is also relatively small when the permeability ratio is small. Due to both gravity and reservoir physical properties, the permeability ratio increases, the cumulative oil production of positive rhythm reservoirs decreases and that of reverse rhythm reservoirs increases, and the location of high-quality reservoirs in the upper part of producing wells is conducive to increasing the final recovery rate. A lower oil to water viscosity ratio can significantly increase the swept volume and improve development effect. Hydrophilic reservoirs can reduce the injection pressure and increase the spread range, effectively improving the problem of inability to inject, and improving reservoir hydrophilicity through surface activators can increase reservoir recovery. The water injection rate determines the recovery rate of formation energy. Generally, the faster the rate, the higher the cumulative oil production. Therefore, the rate of water injection should be increased as much as possible, taking into account construction conditions and economic evaluation. Additionally, the effect of water injection on the development effect is different at different stages, so the appropriate timing of water injection is very important to the water injection huff and puff development effect, and the use of early water injection in this research area is not conducive. Soaking can promote pressure and fluid redistribution and improve water injection huff and puff development effect, but soaking for a long time can lead to reservoir contamination and reduce crude oil production, so the preferred time for a soaking is about 20 days.
Introduction
In recent years, the rapid development of the global economy has led to an increasing demand for oil and gas resources. Since tight oil and gas is widely distributed around the world (Liu; Shi et al.,; Zhang et al., 2022a; Zou, 2014), it has attracted widespread attention worldwide due to its resource potential and exploration value, and the exploration and development of oil and gas is striding from conventional to unconventional oil and gas fields (Hu et al., 2018; Zou et al., 2018; Sun et al., 2019). As a typical tight sandstone oil reservoir with low porosity, low permeability and complex pore roar structure, the H oil reservoir of Liaohe oilfield is a low-porosity and low-permeability reservoir (Wang et al., 2014; Ji, 2016; Wu et al., 2018), and has remarkable characteristics of tight reservoir development. Its production is high in the early stage of development, but it decreases rapidly, with the rate of decrease reaching more than 50% (Liu, 2022). Therefore, the efficient and sustainable development of tight oil reservoirs has become the focus and difficulty of current study.
At present, horizontal well technology combined with segmented multi-stage fracturing technology is commonly used worldwide to achieve efficient development of tight oil reservoirs (Jiang et al., 2017; Zhang, 2020; Guo et al., 2021; Zheng et al., 2021), and the recovery rate can be improved by increasing the stimulated reservoir volume. However, the fracture expansion of tight oil reservoirs is influenced by their own geological conditions with diverse situations (Zhao et al., 2015; Peng et al., 2016; Zhao et al., 2017; Li et al., 2020; Peng et al., 2020), some reservoirs are strongly heterogeneity with positive and reverse rhythm in the vertical direction (Li et al., 2019a; Zhang et al., 2022b), and the two-phase or even three-phase seepage is superimposed on the influence of engineering factors on the development process (Ma et al., 2021; Shen et al., 2022), which makes the seepage mechanism and development law of tight reservoirs very complex (Zafar et al., 2020; Zhao et al., 2021), and the dominant seepage channel is not clear (Li et al., 2019b). At present, the relevant research is still at the core scale (Jing et al., 2021) (Figure 1), and the lack of understanding of the development rules and factors influencing production capacity cannot effectively guide the preparation of development plans for such reservoirs. Based on the numerical model of H reservoir in Liaohe oilfield and comprehensively considered the effects of gravity, capillary force and imbibition, this paper extracts the characteristic wells in typical blocks and conducts a study on the selection of development methods and factors affecting production capacity through the control variables approach to analyze the production performance and remaining oil distribution of characteristic wells in tight oil reservoirs under different development methods, different geological conditions and different engineering conditions, optimize a reasonable development method, analyze the influence laws of different factors, put forward reasonable development strategy suggestions, and provide certain technical support for the preparation of tight oil reservoir development plans.
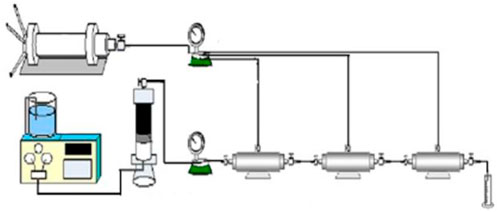
FIGURE 1. Core-scale experimental device for tight oil reservoirs.
Typical reservoir characteristics
The top depth of the H reservoir in the Liaohe field is 2,759.4 m and the bottom depth is 5,507.35 m, with a total thickness of 2,747.95 m. Generally, the reservoir thickness is large and the effective thickness is 100–500 m. The lithology of the block is mainly fine sandstone, siltstone, oil shale and dark red mudstone, with a small amount of sand conglomerate (Figure 2), and the reservoir space is mainly primary pore space, with a very small amount of secondary pore space formed by dissolution (intergranular pores and intra-grain pores, Figure 3). It was found through the porosity and permeability statistics of 203 rock samples from the H reservoir that the reservoir rock gas test permeability was mainly distributed in the range of 1 μm2 × 10−7 μm2∼16.5 μm2 × 10−3 μm2, with an average permeability of 0.1 μm2 × 10−3 μm2, which belonged to the ultra-low permeability type, and the porosity was generally distributed between 2 and 18%, with an average porosity of 7.13%, and the reservoir porosity evaluation was poor. Influenced by sedimentation, diagenesis, dissolution and the degree of filling, the reservoir not only has extremely low porosity and permeability, but also exhibits strong reservoir inhomogeneity, with the local reservoir showing obvious positive and reverse rhythmic features in the longitudinal direction.
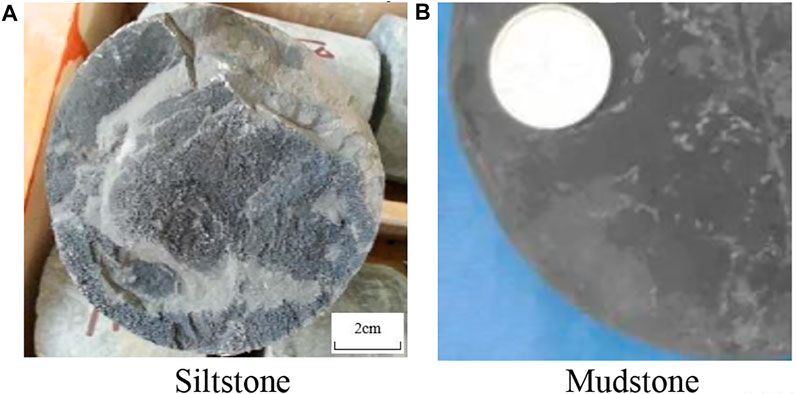
FIGURE 2. Photographs of representative rock samples from the H oil reservoir in the Liaohe Oilfield.
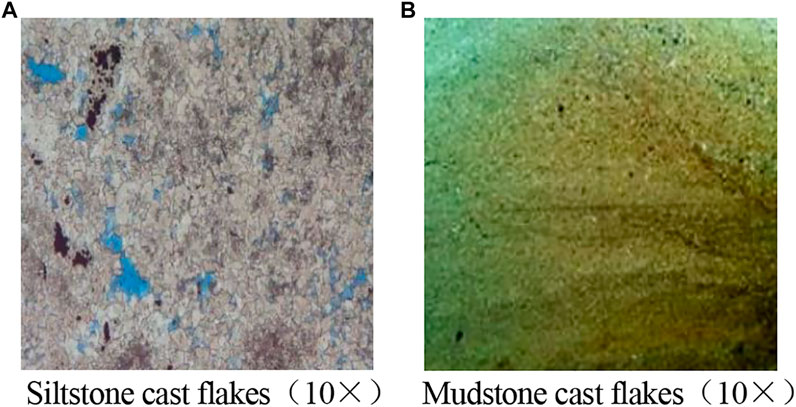
FIGURE 3. Rock cast flake of tight oil reservoir in H reservoir of Liaohe oilfield.
Model building and development solution optimization
A numerical oil reservoir model of the H oil reservoir in the Liaohe oilfield was established, and the characteristic well of the target block-W well was selected for a single well numerical simulation after historical fitting to ensure the accuracy of the model, and a rectangular reservoir with I × J × K of 600 m × 300 m × 100 m was intercepted as the research area (Figure 4), with a grid step of 10 m and a total grid number of 18,000 (60 × 30×10), and the detailed geological parameters are shown in Table 1. In the middle of the research area, there is a horizontal well with a length of 380m, which is both a production well and an injection well.
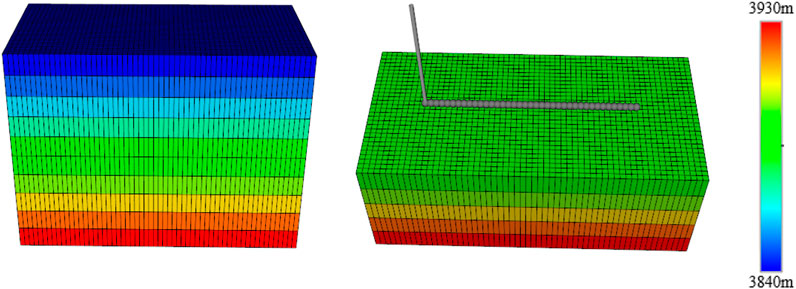
FIGURE 4. Schematic diagram of the burial depth and well location in the research area of well W in the H oil reservoir of the Liaohe oilfield.
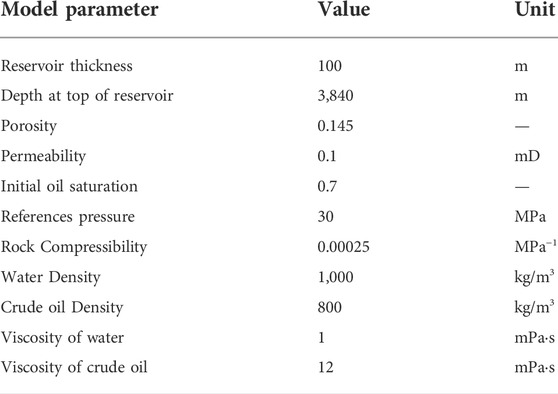
TABLE 1. Values of reservoir properties and fluid properties parameters in the research area.
The research area is being developed with horizontal wells without fracturing for depletion development, horizontal wells after fracturing for depletion development and horizontal wells after fracturing for water injection huff and puff, their development scheme and fracture parameters are listed in Table 2 and Table 3, respectively. As shown in Figure 5, the daily production and cumulative oil production of W wells under three different development methods, from which it can be seen that the effect of reservoir physical properties on production capacity is significant in the early stages of development, with the daily production rate of a single well in a fractured horizontal well being more than five times the capacity of the well in a horizontal well without fracturing measures, but as development progresses this difference decreases rapidly with the decay of formation energy, with better reservoir physical properties and faster decay of daily production in fractured horizontal wells.
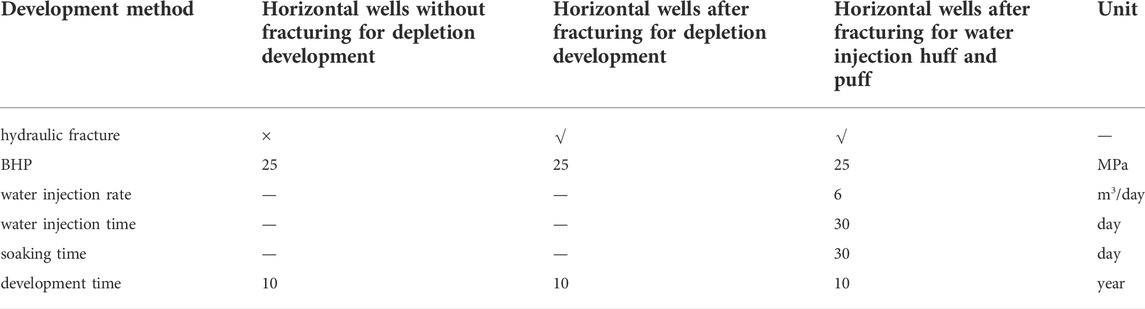
TABLE 2. Specific parameters for different development methods.
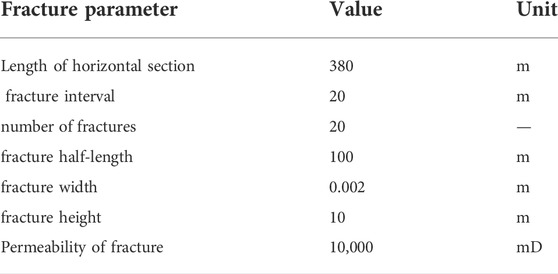
TABLE 3. Fracture parameters of fractured horizontal Wells.
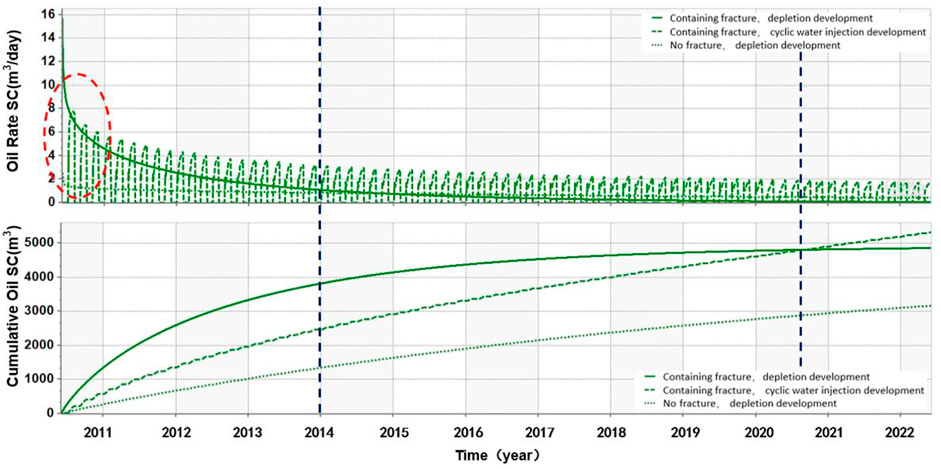
FIGURE 5. Daily and cumulative oil production curves for well W under different development methods.
Significantly, the formation pressure drops rapidly in the horizontal well fracturing followed by depletion development (Figure 6) in the middle and late stages. Because the depletion development cannot replenish the bottom energy timely and the formation is not supplied with enough fluid, the daily production rate of horizontal wells after fracturing for depletion development decreases rapidly and the daily production rate is extremely low, just like horizontal wells without fracturing for depletion development, and even appears to be lower in the middle and late stages. In contrast, the adoption of horizontal well fracturing followed by water injection huff and puff development can effectively and timely replenish the formation energy, and the high pressure fluid around the fracture timely replenishes the formation pressure deficit and delays the formation pressure drop, which can relatively steadily keep a certain daily production continuous production and thus obtain the highest cumulative oil recovery. In the early stage of development, reservoir energy is sufficient and reservoir physical properties are the main factor controlling single well production. But in the middle and late stages of development, the formation energy becomes the main factor limiting the production. Therefore, water injection huff and puff development after horizontal well fracturing can effectively improve the reservoir properties of tight reservoirs and timely replenish the underlying energy to achieve stable production in the block.
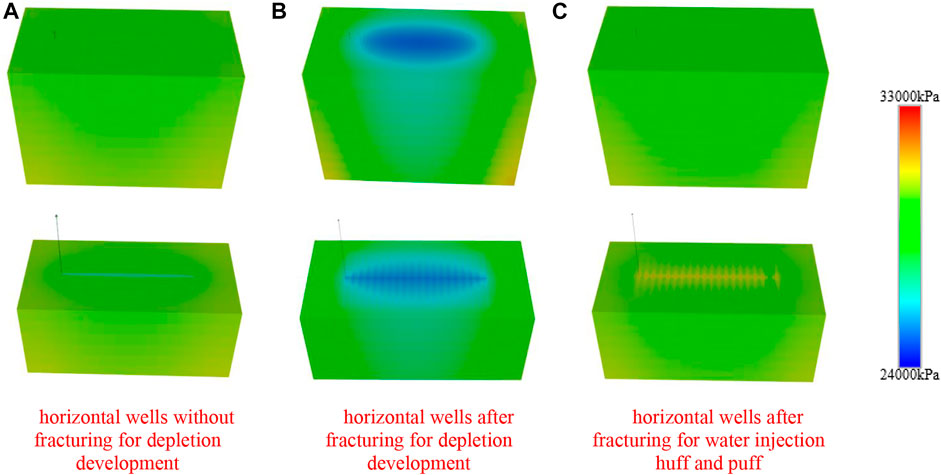
FIGURE 6. Pressure distribution under different development methods in metaphase development.
Impact of physical parameters on water injection huff and puff development
The main physical parameters that affect the effectiveness of water injection huff and puff in tight sandstone reservoirs include reservoir permeability distribution, oil to water viscosity ratio and reservoir wettability (Sun et al., 2021; Zhu et al., 2021).
Impact of permeability on development effectiveness
Usually speaking, tight sandstone oil reservoirs exhibit strong reservoir inhomogeneity, and the local reservoirs show positive rhythm and reverse rhythm characteristics in the longitudinal direction. According to the reservoir physical conditions of H reservoir in Liaohe oilfield, the influence of different permeability ratios (Table 4) on the development effect under positive and reverse rhythm conditions was designed in conjunction with the permeability statistics of reservoir rock samples.
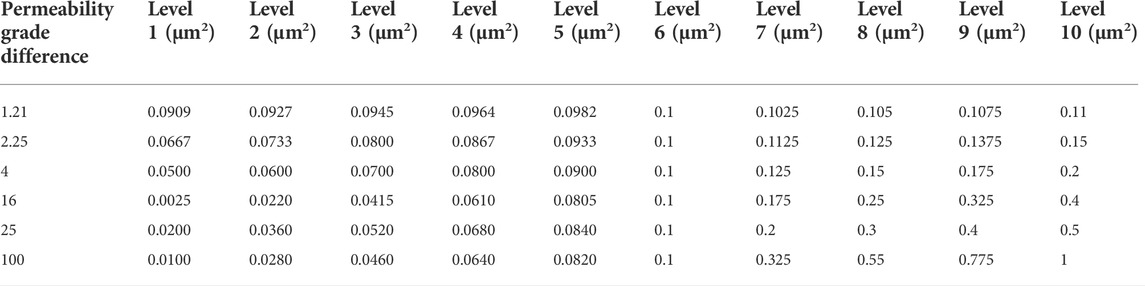
TABLE 4. Distribution of oil reservoir permeability at different permeability ratios.
As shown in Figure 7, the two curves are the cumulative oil production for different permeability ratios under positive and reverse rhythm conditions respectively. It can be seen, from the figure, that the positive rhythm reservoirs, with increasing permeability ratios, show a decreasing trend in cumulative oil recovery and overall show a negative phase relationship. Conversely, cumulative oil recovery from reverse rhythm reservoirs increases with increasing permeability ratio in a positive correlation. Bounded by a permeability ratio of 4, when the permeability ratio is less than 4, production is less affected by permeability, and when the permeability ratio is greater than 4, production capacity varies significantly with permeability. The main reason for this is that the permeability of tight reservoirs is extremely small, and changes in permeability ratio in the range 0–4 have a small effect on permeability; when the permeability ratio is greater than 4, the permeability of the upper part of the reservoir is reduced by an order of magnitude and the permeability of the lower part of the reservoir is significantly improved, resulting in significant changes in cumulative production.
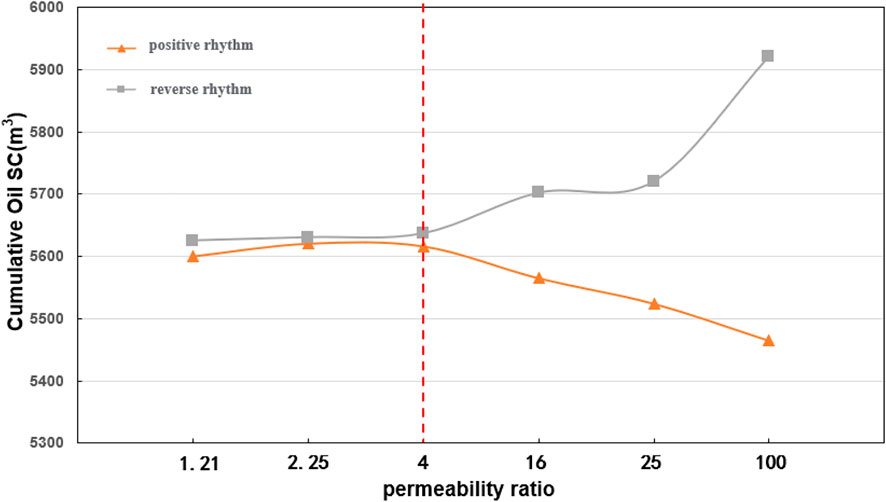
FIGURE 7. Cumulative oil production from W wells under different permeability ratios in positive and reverse rhythm.
Statistics on the ratio of the production in the upper and lower parts of the reservoir to the geological reserves under different permeability ratios (Figure 8) show that the production share of both the upper and lower part of the positive rhythm reservoir decreases to different degrees as the permeability ratio increases. As the producing wells are in the middle of the reservoir, the decrease in the production share in the lower part of the reservoir is more pronounced due to the influence of gravity. Although the physical properties of the lower part of the reservoir become better, no effective seepage channel is established between the reservoir and the wellbore, so it cannot make an effective contribution to production; with the increase in permeability ratio, the physical properties of the upper part of the reverse rhythm reservoir are significantly improved, and the production share of the lower part of the reservoir decreases, but the decrease is smaller, making the overall trend of reservoir production increase.
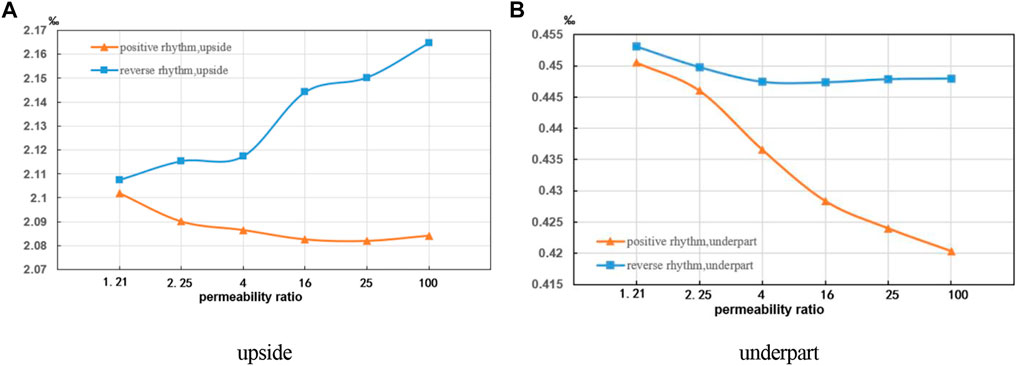
FIGURE 8. Production ratio of upper and lower reservoirs under different permeability ratios of positive and reverse rhythms.
Impact of oil to water viscosity ratio on development effectiveness
The oil to water viscosity ratio is the ratio of the viscosity of the crude oil in the reservoir to the viscosity of the replacement fluid (water is used in this research), which not only affects the area swept efficiency but also the volume swept coefficient. In order to investigate the effect of different viscosity ratios on the development effect of tight oil reservoirs, the influence law of oil-water viscosity ratio from 1 to 60 on the cumulative oil production of H oil reservoir was designed. Figure 9 shows the cumulative oil production for different oil-water viscosity ratios, which is clear that the cumulative oil production is negatively related to the oil-water viscosity ratio, and the cumulative oil production corresponding to different oil-water viscosity ratios varies greatly. When the crude oil viscosity changes from 1 mPa s to 60 mPa s, the cumulative oil production corresponding to an oil-water viscosity ratio of 60 is less than 1/4 of the oil production corresponding to an oil-water viscosity ratio of 1. From the start of production, the low oil-water viscosity ratio shows an obvious production advantage, laying the foundation for the highest recovery rate in the end.
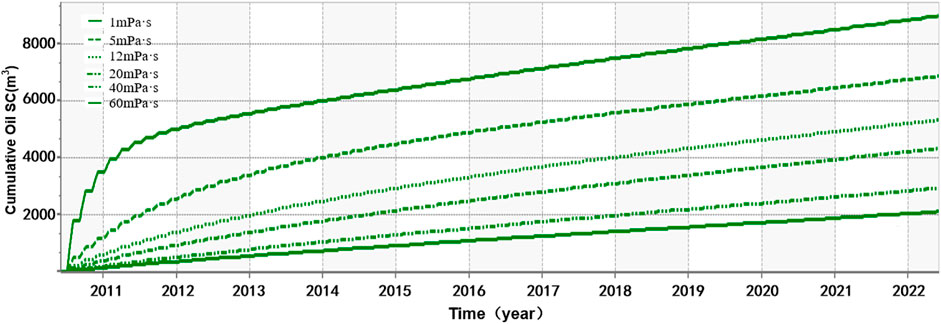
FIGURE 9. Cumulative oil production versus oil to water viscosity ratio curve.
Comparing the pressure distribution in the layer with wellbore at the completion of the oil recovery phase of the first water injection huff and puff cycle under different oil-water viscosity ratios (Figure 10), it can be found that the pressure spreading range gradually decreases with the increase of oil-water viscosity ratio, only the four corners of the reservoir are difficult to spread under 1 mPa s condition, while under 40 mPa s, and 60 mPa s conditions, the pressure can only spread to a very small part of the area near the wellbore and the fracture. During the injection stage (Figure 11), reservoirs with low oil-water viscosity ratios are able to spread the energy replenished to the formation relatively evenly throughout the reservoir, while the larger the oil-water viscosity ratio, the smaller the spread of replenished energy, holding pressure near the wellbore and fractures, making the injection water repeatedly flush near the well and near the fractures, which cannot effectively improve the final recovery. In practice, the oil to water viscosity ratio can be reduced by reducing the viscosity of the crude oil or increasing the viscosity of the replacement fluid, thereby increasing the recovery of the reservoir.
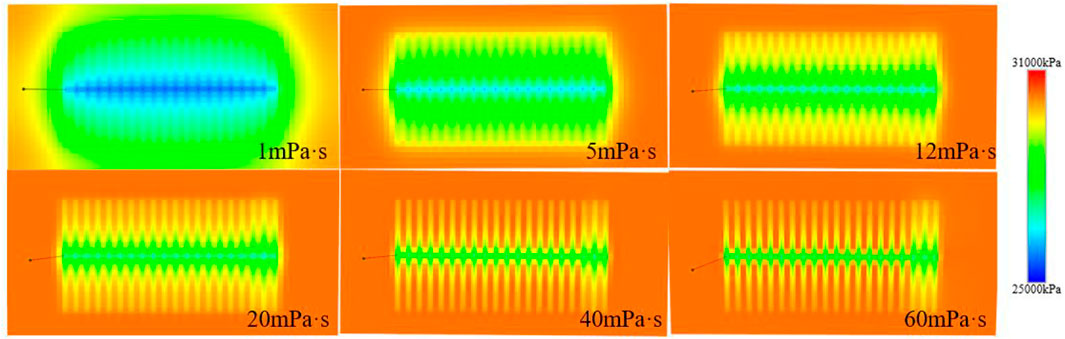
FIGURE 10. Pressure sweep range for different oil to water viscosity ratios at the end of the first production phase.
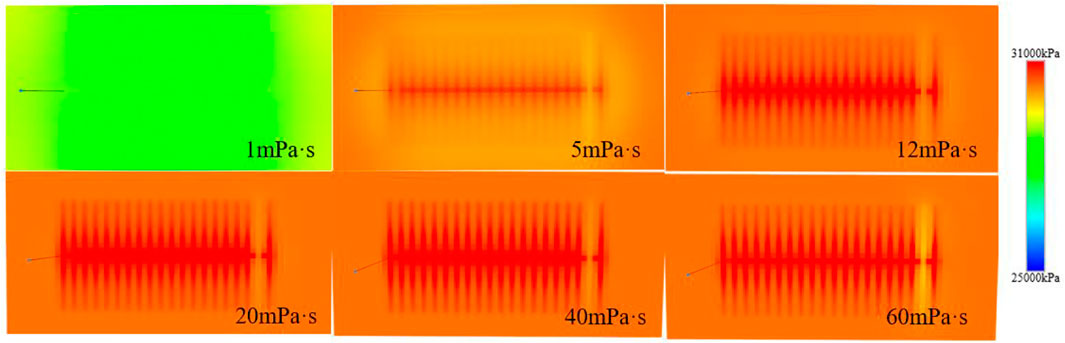
FIGURE 11. Pressure sweep range for different oil to water viscosity ratios at the end of the second injection phase.
Impact of wettability on development effectiveness
Reservoir wettability will affect the distribution of reservoir fluids within the pores of the rock and the ability of the oil and water phases to percolate through the reservoir porous media. When the oil and water saturation in the reservoir are the same, the wettability of the reservoir rock will have a decisive influence on the final effect of water injection huff and puff development. The relative permeability curves (Figure 12) of different wettability obtained experimentally were substituted into the numerical model, and the cumulative oil recovery results obtained for the research area under different wettability conditions are shown in Figure 13, with the final oil recovery from hydrophilic reservoirs being significantly higher than that from oleophilic reservoirs. It is easy to see, combined with the bottom well flow pressure (Figure 14) and the pressure distribution of the different wetting reservoirs at the end of the second injection phase (Figure 15), that the bottom well flow pressure of the oil-wet reservoir is always higher than the bottom well flow pressure of the water-wet reservoir during water injection, and the high-pressure zone near the wellbore and fracture of the reservoir is more widely distributed; while the pressure ripple range is smaller than that of the water-wet reservoir during production. When water is injected, water in the oil-wet reservoir as a non-wetting phase has a greater resistance to percolation, which is not conducive to pressure diffusion to replenish the energy deficit of the formation. In the actual production process, surface activators can be used to change the reservoir wettability to achieve the purpose of improving the water injection huff and puff effect.
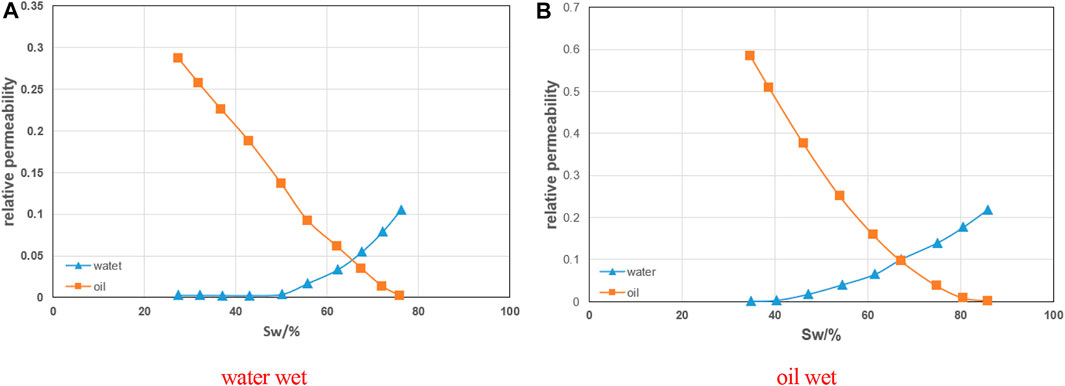
FIGURE 12. The relative permeability curves of different wettability.
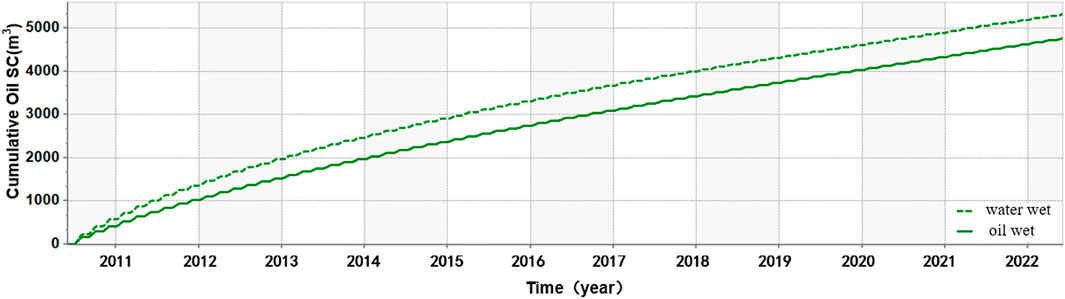
FIGURE 13. Cumulative oil recovery of reservoirs with different wettability.
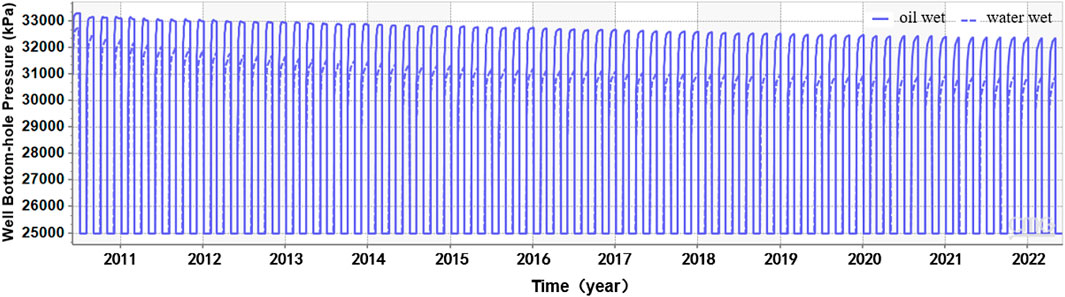
FIGURE 14. Bottom flow pressure in well W under different wettability conditions.
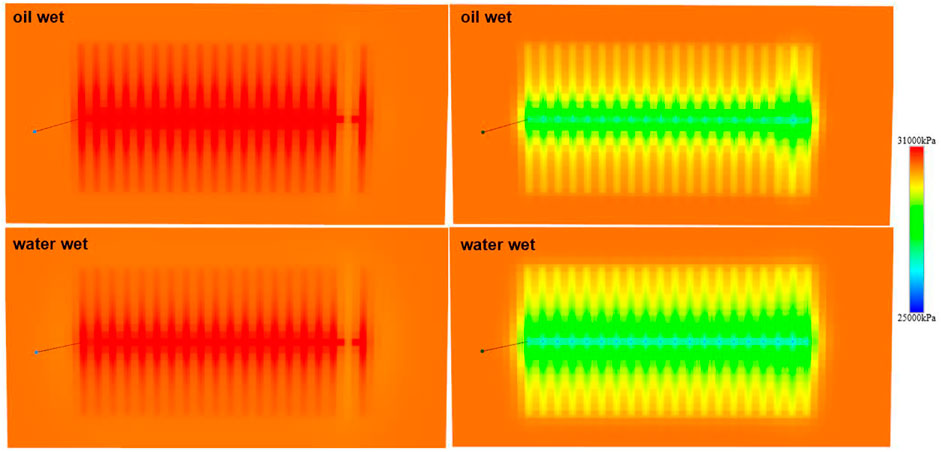
FIGURE 15. Pressure distribution in reservoirs with different wettability at the end of the second phase of water injection.
Impact of engineering parameters on water injection huff and puff development
The main engineering parameters that affect the effect of water injection huff and puff in tight sandstone reservoirs include injection rate, injection volume and soaking time (Wang et al., 2021), and the effect of these engineering parameters on the development effect was studied for the sixth round of water injection huff and puff.
Impact of water injection rate on development effectiveness
Keeping the water injection volume and production pressure differential constant, the production of a single well in round six was simulated at water injection rates of 3 m3/d, 6 m3/d, 9 m3/d, 12 m3/d, 15 m3/d, 18 m3/d and 30 m3/d respectively. It is easy to see from Figure 16 that if the water injection rate is kept constant, the higher the water injection rate is, the greater the cumulative oil production from the reservoir, and the rate of increase in cumulative oil production gradually slows down as the water injection rate increases; while when the water injection rate is 30 m3/d, the rate of increase in cumulative oil production is already very small, and increasing the water injection rate has less impact on the increase in production. The flow pressure at the bottom of the producing well increases gradually with the rate of water injection, which effectively replenishes the formation energy and is an important reason for increasing the rate of water injection to increase production, and the injection rate can be increased as much as possible to increase crude oil production while meeting the construction pressure conditions.
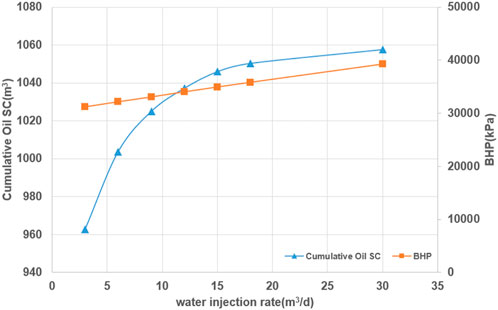
FIGURE 16. Cumulative oil recovery for the first six rounds and bottomhole flow pressure for the sixth round at different injection rates.
Impact of water injection volume on development effectiveness
Holding the injection rate and production pressure differential constant, the reservoir production was simulated for injection volumes of 90 m3, 180 m3, 360 m3, 540 and 720 m3 respectively. As shown in Figure 17, the relationship between cumulative oil production, cumulative water production and water injection, i.e., cumulative oil production from the reservoir gradually decreases with increasing water injection, and the two are negatively correlated, but cumulative water production rises rapidly with increasing water injection, and the two are positively correlated. This phenomenon is due to the turns of water injection selected for this research was at the pre-development stage, with high remaining recoverable reserves and sufficient formation energy. Excessive injection water formed a high pressure zone near the wellbore and fractures (Figure 18), which impeded the percolation of crude oil into the wellbore and fractures, while the extremely poor physical properties of the dense reservoir made it difficult for both injection water and energy to spread to the far well zone. When the well is opened up again, the injection water is rapidly produced to the surface along the fracture and wellbore, resulting in ineffective circulation of the injection water. In the later stages of development, after a long period of production, the reservoir energy deficit, when water injection can effectively replenish the formation energy, the cumulative oil production within a round rises gradually with the increase of water injection (Figure 19). Although water injection can effectively replenish the energy of the formation, the right timing and volume of water injection should be selected in the actual production process.
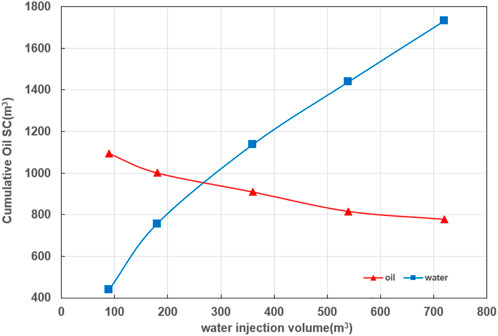
FIGURE 17. Sub-cumulative oil and water production from the first six rounds (pre-development) under different water injection conditions.
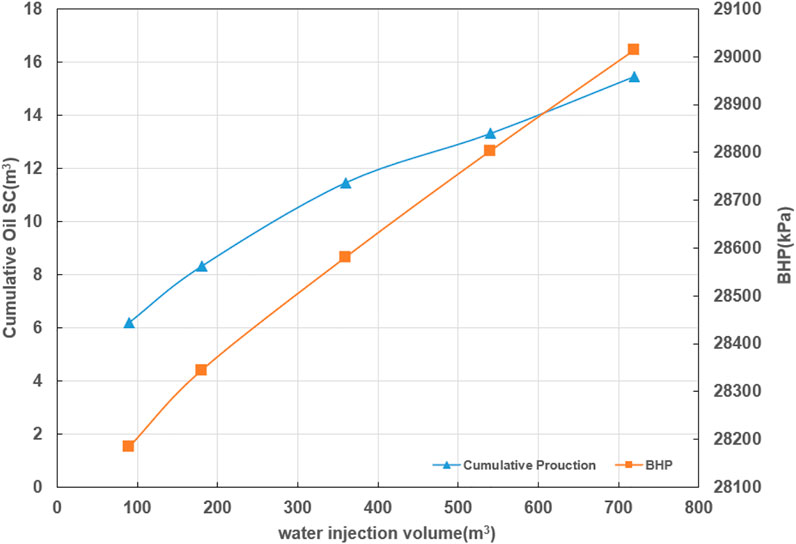
FIGURE 18. Reservoir pressure distribution after the sixth round of water injection under different water injection conditions.
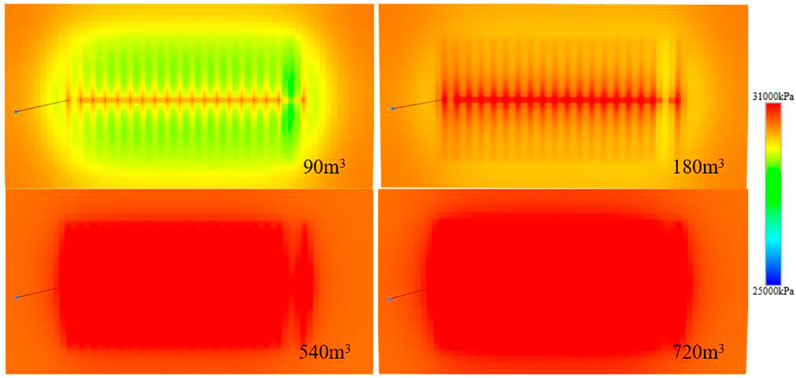
FIGURE 19. Cumulative oil production and bottomhole pressure in late development rounds under different water injection conditions.
Impact of soaking time on development effectiveness
The water injection rate, water volume and production pressure differential were kept constant, and soaking times of 0, 10, 20, 30, 60, and 90 days were designed to investigate the effect of it on the development effect.
The relationship between oil recovery and soaking time for the sixth round is shown in Figure 20, which shows that as the soaking time increases, the cumulative oil recovery first increases, then decreases and finally plateaus. When the soaking time is less than 20 days, the time for pressure and fluid redistribution in the reservoir is more adequate as the soaking time increases, avoiding the accumulation of injection water and supplementary formation energy in the near-well zone (Figure 21), which is conducive to improving the water injection huff and puff effect. However, with the further increase of the soaking time, influenced by the capillary force, the injection water enters the deep part of the formation and contaminates the reservoir, which is not conducive to improving the recovery rate. The optimal soaking time for this research area is 20 days.
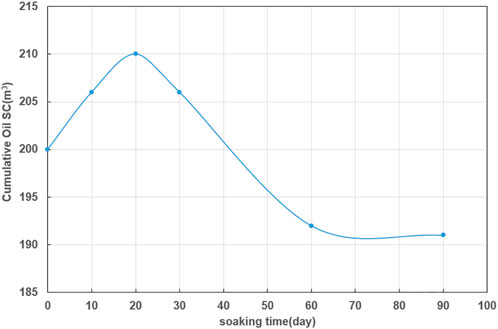
FIGURE 20. The sixth round of oil recovery with different soaking time.
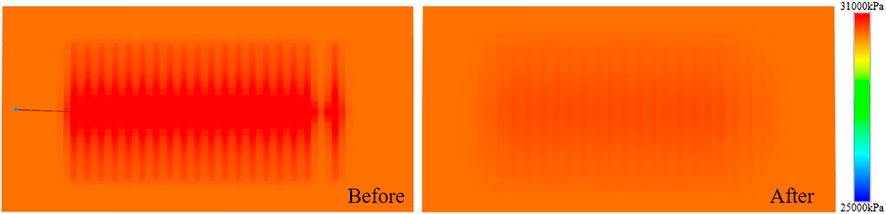
FIGURE 21. Reservoir pressure distribution before and after soaking.
Conclusion
1) Reservoir physical properties and formation energy are the two key factors limiting the efficient development of tight sandstone reservoirs; water injection huff and puff development of fractured horizontal wells can effectively improve reservoir physical properties and timely replenish the formation energy deficit, which is the optimal development method for H oil reservoirs in Liaohe oilfield.
2) The cumulative oil production in positive rhythm reservoirs is negatively correlated with the permeability ratio, while it in reverse rhythm reservoirs is positively correlated with the permeability ratio. In tight reservoirs, when the permeability ratio is lower than 4, the effect of permeability ratio on production capacity can be ignored. In the actual development process, formation classification should be based on reverse rhythm as far as possible. The oil-water viscosity ratio is negatively correlated with cumulative oil production, the larger the oil-water viscosity ratio, the smaller the spread area, in the actual development process, the oil-water viscosity ratio can be reduced by reducing the viscosity of the crude oil or increasing the viscosity of the replacement fluid to improve recovery. Hydrophilic reservoirs can effectively reduce water injection pressure and expand the swept area, which is conducive to water injection huff and puff development.
3) The injection rate determines how quickly the formation energy is replenished and is also an important factor affecting the construction cycle, the best injection rate for this research area is 15 m3/d∼18 m3/d. Water injection can effectively replenish the formation energy, but in the actual production process should choose the right timing of water injection, this research area can try to replenish the formation energy by water injection in the middle and late stages. Soaking can promote the redistribution of pressure and fluid in the reservoir and improve the development effect of water injection huff and puff, but shutting in the well for too long can lead to reservoir contamination and reduced crude oil production. The optimum soaking time for the research area is 20 days.
Data availability statement
The raw data supporting the conclusions of this article will be made available by the authors, without undue reservation.
Author contributions
YH, YL, and CC contributed to conception and design of the study. WX organized the database. HM performed the statistical analysis. YH wrote the first draft of the manuscript. YH and YL wrote sections of the manuscript. All authors contributed to manuscript revision, read, and approved the submitted version.
Funding
This study was supported by the Science and Technology Cooperation Project of the CNPC-SWPU Innovation Alliance, the National Natural Science Foundation of China (Grant no. U19A2043, U21B2071, and 52174033), and Natural Science Foundation of Sichuan Province (NSFSC) (No. 2022NSFSC0971).
Conflict of interest
Author HM was employed by the company CNPC Bohai Drilling Engineering Company Limited. Authors CC and WX were employed by PetroChina Southwest Oil & Gasfield Company.
The remaining authors declare that the research was conducted in the absence of any commercial or financial relationships that could be construed as a potential conflict of interest.
Publisher’s note
All claims expressed in this article are solely those of the authors and do not necessarily represent those of their affiliated organizations, or those of the publisher, the editors and the reviewers. Any product that may be evaluated in this article, or claim that may be made by its manufacturer, is not guaranteed or endorsed by the publisher.
References
Guo, J., Zhou, F., Hu, X., Liu, X., and Wang, B. (2021). Mechanical mechanism of enhanced fracturing of tight oil horizontal Wells in Santanghu Basin. Fault-block oil gas fields 28 (01), 57–62. doi:10.6056/dkyqt202101010
Hu, S., Zhu, R., Wu, S., Bai, B., Yang, Z., and Cui, J. (2018). Profitable exploration and development of continental tight oil in China. Petroleum Explor. Dev. 45 (4), 737–748. doi:10.11698/PED.2018.04.20
Ji, T. (2016). Characteristics of tight oil accumulation in Leijia area, Liaohe Depression. East China: China University of Petroleum.
Jiang, T., Teng, X., and Yang, X. (2017). Integrated techniques for rapid and highly-efficient development and production of ultra-deep tight sand gas reservoirs of Keshen 8 Block in the Tarim Basin. Nat. Gas. Ind. B 4 (1), 30–38. doi:10.1016/j.ngib.2017.07.005
Jing, L., Li, X., Song, M., Liu, H. M., Feng, Y. C., and Liu, C. (2021). Investigating microscopic seepage characteristics and fracture effectiveness of tight sandstones: a digital core approach. Pet. Sci. 18, 173–182. doi:10.1007/s12182-020-00464-8
Li, Z., Duan, Y., Mingqiang, W., Peng, Y., and Chen, Q. (2019). Pressure performance of interlaced fracture networks in shale gas reservoirs with consideration of induced fractures. J. Petroleum Sci. Eng. 178, 294–310. doi:10.1016/j.petrol.2019.03.048
Li, X. Z., Lu, D. T., Luo, R. L., Sun, Y., Shen, W., Hu, Y., et al. (2019). Quantitative criteria for identifying main flow channels in complex porous media. Petroleum Explor. Dev. 46 (5), 998–1005. doi:10.1016/s1876-3804(19)60256-9
Li, Z., Duan, Y., Peng, Y., Wei, M., and Wang, R. (2020). A laboratory study of microcracks variations in shale induced by temperature change. Fuel 280, 118636. doi:10.1016/j.fuel.2020.118636
Liu, M. Logging evaluation technology and development direction of tight reservoir. Special oil gas reservoirs, 1–12.
Liu, Y. (2022). Study on seepage law and production prediction of multi-stage fracturing of horizontal well in tight reservoir. Beijing: University of Science and Technology Beijing.
Ma, T. R., Zhang, K. N., Shen, W. J., Guo, C., and Xu, H. (2021). Discontinuous and continuous Galerkin methods for compressible single-phase and two-phase flow in fractured porous media. Adv. Water Resour. 156, 104039. doi:10.1016/j.advwatres.2021.104039
Peng, Y., Li, Y., and Zhao, J. (2016). A novel approach to simulate the stress and displacement fields induced by hydraulic fractures under arbitrarily distributed inner pressure. J. Nat. Gas Sci. Eng. 35, 1079–1087. doi:10.1016/j.jngse.2016.09.054
Peng, Y., Zhao, J., Sepehrnoori, K., and Li, Z. (2020). Fractional model for simulating the viscoelastic behavior of artificial fracture in shale gas. Eng. Fract. Mech. 228, 106892. doi:10.1016/j.engfracmech.2020.106892
Shen, W. J., Ma, T. R., Li, X. Z., Sun, B., Hu, Y., and Xu, J. (2022). Fully coupled modeling of two-phase fluid flow and geomechanics in ultra-deep natural gas reservoirs. Phys. Fluids 34 (4), 043101. doi:10.1063/5.0084975
Shi, X., Sun, L., Zhan, J., Li, B., Han, X., Lu, H., et al. . Carbon dioxide hubbub technology and its application in tight oil horizontal Wells in northern Songliao Basin. Acta Pet. Sin., 1–9. doi:10.7623/syxb202207010
Sun, L., Zou, C., Jia, A., Wei, Y., Zhu, R., Wu, S., et al. (2019). Development characteristics and orientation of tight oil and gas in China. Petroleum Explor. Dev. 46 (6), 1015–1026. doi:10.1016/S1876-3804(19)60264-8
Sun, Y., Xin, Y., Lyu, F., and Dai, C. L. (2021). Experimental study on the mechanism of adsorption-improved imbibition in oil-wet tight sandstone by a nonionic surfactant for enhanced oil recovery. Petroleum Sci. 18 (4), 1115–1126. doi:10.1016/j.petsci.2021.07.005
Wang, Y., Dong, Y., Chen, N., Wang, Q., and Zheng, X. (2014). Formation conditions and resource potential of tight oil in Ludong Sag. Special oil gas reservoirs 21 (04), 53–57+153. doi:10.3969/j.issn.1006-6535.2014.04.012
Wang, J., Liu, H., Qian, G., and Peng, Y. C. (2021). Mechanisms and capacity of high-pressure soaking after hydraulic fracturing in tight/shale oil reservoirs. Pet. Sci. 18, 546–564. doi:10.1007/s12182-020-00524-z
Wu, L., Guo, X., Luo, W., Zhang, Z., and Zhang, W. (2018). Study on influencing factors of productivity of fractured horizontal wells in tight oil reservoirs: A case study of damintun tight oil horizontal wells in Liaohe oilfield. Unconv. oil gas 5 (03), 56–62. doi:10.3969/j.issn.2095-8471.2018.03.009
Zafar, A., Su, Y., Li, L., Fu, J. G., Mehmood, A., Ouyang, W. P., et al. (2020). Tight gas production model considering TPG as a function of pore pressure, permeability and water saturation. Pet. Sci. 17, 1356–1369. doi:10.1007/s12182-020-00430-4
Zhang, D., Zhang, L., Tang, H., and Zhao, Y. (2022). Fully coupled fluid-solid productivity numerical simulation of multistage fractured horizontal well in tight oil reservoirs. Petroleum Explor. Dev. 49 (2), 338–347. doi:10.1016/S1876-3804(22)60032-6
Zhang, L., Wang, T., Albouzedy, I., Wang, W., and Ren, X. (2022). Factors influencing the horizontal inter-well interference in tight gas reservoirs. Nat. Gas. Ind. B 9 (3), 308–317. doi:10.1016/j.ngib.2022.06.003
Zhang, K. (2020). Research on influencing factors of productivity after multistage fracturing of tight oil horizontal Wells. China Petroleum Chem. Stand. Qual. 40 (17), 39–40. doi:10.3969/j.issn.1673-4076.2020.17.020
Zhao, J., Peng, Y., Li, Y., and Xiao, W. (2015). Analytical model for simulating and analyzing the influence of interfacial slip on fracture height propagation in shale gas layers. Environ. Earth Sci. 73 (10), 5867–5875. doi:10.1007/s12665-015-4360-4
Zhao, J., Peng, Y., Li, Y., and Tian, Z. (2017). Applicable conditions and analytical corrections of plane strain assumption in the simulation of hydraulic fracturing. Petroleum Explor. Dev. 44 (3), 454–461. doi:10.1016/s1876-3804(17)30052-6
Zhao, Y., Liu, X., Zhang, L., Tang, H., Xiong, Y., Guo, J., et al. (2021). Laws of gas and water flow and mechanism of reservoir drying in tight sandstone gas reservoirs. Nat. Gas. Ind. B 8 (2), 195–204. doi:10.1016/j.ngib.2020.09.018
Zheng, Y., Han, X., Zeng, J., Zhou, C., Zhou, L., and Chen, W. (2021). Practice of high-intensity volume fracturing in the Shaximiao Formation tight sandstone gas reservoirs of the Qiulin Block, central Sichuan Basin. Nat. Gas. Ind. B 8 (4), 367–375. doi:10.1016/j.ngib.2021.07.007
Zhu, C., Guo, W., Wang, Y., Li, Y., Gong, Y., Xu, L., et al. (2021). Experimental study of enhanced oil recovery by CO2 huff-n-puff in shales and tight sandstones with fractures. Pet. Sci. 18, 852–869. doi:10.1007/s12182-020-00538-7
Keywords: tight sandstone oil reservoir, numerical simulation, development mode, geological factor, engineering factor
Citation: Li Y, Huang Y, Ma H, Chang C and Xie W (2022) Study on the development options of tight sandstone oil reservoirs and their influencing factors. Front. Energy Res. 10:1007224. doi: 10.3389/fenrg.2022.1007224
Received: 30 July 2022; Accepted: 15 August 2022;
Published: 07 September 2022.
Edited by:
Daoyi Zhu, China University of Petroleum, ChinaReviewed by:
Liwu Jiang, University of Regina, CanadaChangan Shan, Xi’an Shiyou University, China
Tao Huang, Zhejiang Ocean University, China
Copyright © 2022 Li, Huang, Ma, Chang and Xie. This is an open-access article distributed under the terms of the Creative Commons Attribution License (CC BY). The use, distribution or reproduction in other forums is permitted, provided the original author(s) and the copyright owner(s) are credited and that the original publication in this journal is cited, in accordance with accepted academic practice. No use, distribution or reproduction is permitted which does not comply with these terms.
*Correspondence: Yitao Huang, aHVhbmd5aXRhbzUxOEAxNjMuY29t