- Hubei Engineering Research Center for Safety Monitoring of New Energy and Power Grid Equipment, Hubei University of Technology, Wuhan, China
The epoxy resin is the main solid insulating material for electrical equipment. PD (partial discharge) is an important factor leading to epoxy resin aging or failure. Fault detection technology based on audible acoustic imaging has the advantages of real-time monitoring, visibility, and flexibility and is gradually being used in the field of electrical equipment insulation state monitoring. However, the audible voiceprint features of epoxy resins with typical PD defects are not clear, which is not conducive to effective detection and fault diagnosis. Therefore, in this study, the study of audible voiceprint features of epoxy resins with a metal burr, pollution, metal foreign matters, and surface discharge defects was carried out. The discharge audible signals were obtained, and their time and frequency domain features were analyzed. The results show that the discharge audible signals of four PD defects can reflect the occurrence of PD simultaneously with pulse current signals. But the characteristics are obviously different in the time domain, which are embodied in listening perception, persistence, amplitude, and phase. In the frequency domain, the frequency spectra of discharge audible signals of four defects are mainly 5–10 and 13–24 kHz. Furthermore, the three feature vectors of frequency spectrum complexity, high-frequency energy factor, and maximum frequency point are extracted, which can well distinguish the discharge audible signals of four PD defects.
1 Introduction
In the future, the development of power systems puts forward higher voltage levels, large capacity, and compact requirements for new energy power system equipment such as AC and DC transmission equipment. Therefore, the insulation system of electrical equipment may face a more serious test (Zhu et al., 2019). The epoxy resin is the main solid insulating material in important electrical equipment such as transformers, reactors, switch cabinets, and insulators due to its excellent electrical, mechanical, and thermal properties (Ding et al., 2022; Liu et al., 2022). However, the long-term thermal, mechanical, and electrical stress may cause aging of the structure and create a variety of PD defects. PD can accelerate the aging of epoxy resins and finally result in surface flashover or breakdown (Zhang et al., 2018; Muneaki et al., 2021). Therefore, it is very important for the monitoring and fault diagnosis of electrical equipment solid insulation (Lei et al., 2017).
For different characteristic phenomena (sound, light, electricity, heat, etc.,) produced by PD, there are many PD detection methods such as the pulse current method (Li et al., 2015), ultra-high frequency (UHF, 300–3 GHz) method (He et al., 2021), ultrasonic method (Lv et al., 2013), and induced charge tomography (ICT) (Liang et al., 2020). The pulse current method is a traditional PD detection method. It can monitor PD in real time and judge the severity of defects through the discharge quantities. But it is easy to be disturbed and difficult to be applied in the electric power field. The UHF method judges the occurrence of PD by detecting the UHF electromagnetic wave excited by PD. It is a non-contact detection method, which can monitor and locate PD in real time. However, a UHF antenna sensor is vulnerable to high-frequency electromagnetic signals such as corona discharge and communication. The ultrasonic method has a strong ability to resist electromagnetic interference and can realize the PD source location. However, the shortcomings are also obvious; it is easy to be disturbed by low-frequency sound waves, and the sensitivity is low. ICT is a new detection method, which can realize the visual detection of defects. However, it is still in the stage of simulation research. For the structural change and aging of epoxy resins caused by PD, there are detection methods such as the insulation resistance test (Xie et al., 2020), dielectric loss test (Wang et al., 2019), and X-ray (Xu et al., 2017). They have mature industry standards, and the change of the insulation state can be clearly judged by the test data but are mostly used for offline detection (Tu et al., 2013).
When PD occurs, audible signals (20–20,000 Hz) can be generated. For different PD defects, their voiceprint characteristics are also different (Xiao et al., 2017; Yun et al., 2020; Zhou et al., 2022). Therefore, the PD detection of epoxy resins based on audible signals has research value. The detection method based on audible acoustics is a non-contact detection method with high security. It has no interference with the normal operation of equipment and can detect multiple pieces of equipment in unison (Zhao et al., 2018). In addition, based on the rapidly developing acoustic imaging technology, the detection, location, and diagnosis technology of PD defects based on audible acoustics are gradually applied in electrical equipment insulation state monitoring (Fu et al., 2019; Shao et al., 2021). However, nowadays, the time and frequency domain characteristics of audible signals of epoxy resins with typical PD defects are not clear, which will hinder the development of PD detection and fault diagnosis of epoxy resins.
In this study, the research on the audible acoustic characteristics of epoxy resins with typical PD defects was carried out. An audible acoustic test platform of epoxy resins with PD defects was built, and typical PD defects of metal burr, pollution, metal foreign matters, and surface discharge were constructed. Then, the characteristics of the collected discharge audible signals of different defects were analyzed in the time and frequency domains. Finally, the voiceprint characteristics of discharge audible signals were summarized. The research provides a certain reference for the development of epoxy resin insulation condition, monitoring, and diagnosis based on audible acoustics.
2 Test platform and method
2.1 Test platform
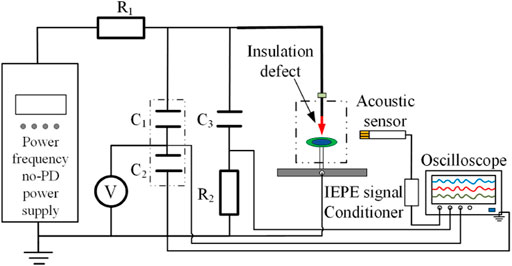
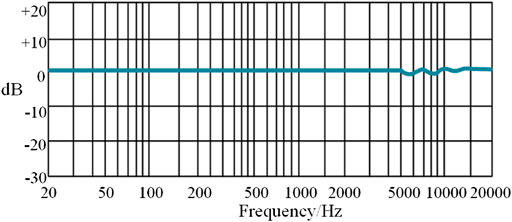
The audible acoustic test platform of epoxy resins with PD defects is shown in Figure 1, and R1, C1/C2, C3, and R2 are protection resistance (4 kΩ), coupled capacitance (413.7 pF/415.3 nF), dividing capacitance (408.9 pF), and detection impedance (8.2 kΩ), respectively. The acoustic sensor is an electret condenser type, and its frequency response, sensitivity (E), and dynamic range are 10 Hz–20 kHz, 50 mV/Pa, and 16–146 dB, respectively. Its frequency response curve is shown in Figure 2, particularly the curve representing the gain of the acoustic sensor under different frequencies. The ideal frequency response curve is straight so that the audible signal cannot produce distortion after passing through the sensor. It was arranged 1 m away from the tested object according to the standard GB/T 1094.101-2008 (GB/T 1094.101-2008, 2008). An IEPE signal conditioner is responsible for providing a 4 mV constant current power supply to the acoustic sensor and serves as the transmission hub of audible signals. Its input terminal is connected to the acoustic sensor, and its output terminal is connected to the oscilloscope. All equipment is connected to one grounding terminal.
2.2 Simulation of typical insulation defects
According to the field application of the epoxy resin in electrical equipment and relevant research (Xiao et al., 2015; Xie et al., 2018; Wang et al., 2021), four typical PD defects were finally constructed, namely, metal burr, pollution, metal foreign matters, and surface discharge defects. The specific setting methods were as follows:
1) Metal burr defect
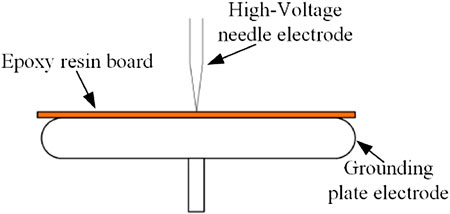
The metal burr defect was simulated by the needle-plate electrode, and the electrodes were made of brass. The tip included an angle, and the radii of the needle electrode were 15 and 0.2 mm, respectively. The tip of the needle electrode contacted the epoxy resin board surface without being pierced. The thickness of the epoxy resin board was 1 mm and was placed on the 6-mm thick grounding plate electrode, as shown in Figure 3.
2) Pollution defect
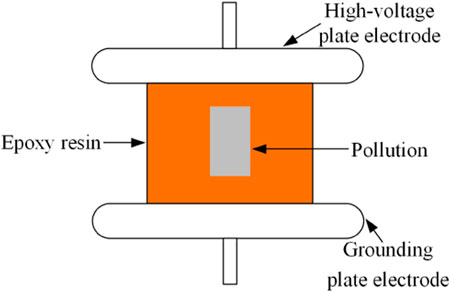
The method of simulating pollution defects was as follows: NaCl and diatomite were used as pollution salt and ash, respectively. Referring to the standard GB/T 26,218.1-2010 (GB/T 26218.1-2010, 2010), the pollution level is selected as level IV. Therefore, ESDD and NSDD were set as 0.281 mg/cm2 and 1.686 mg/cm2, respectively. As shown in Figure 4, after humidifying the pollution with a spray, it was evenly coated on the designated experimental area on the epoxy resin. Essentially, it simulated the surface discharge.
3) Metal foreign matter defect
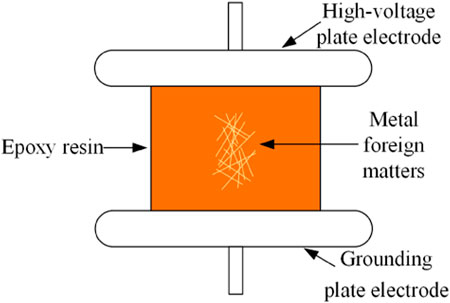
Figure 5 shows the method of simulating the metal foreign matter defect. A certain amount of copper wires (radius: 0.075 mm) with different lengths (0.5–10 mm) were coated on the epoxy resin using an epoxy resin adhesive. Essentially, it also simulated the surface discharge.
4) Surface discharge defect
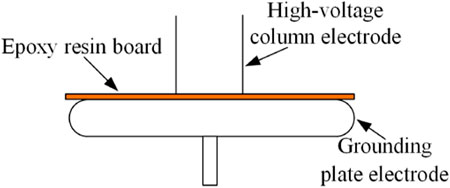
When simulating the surface discharge defect, a cylindrical electrode was used at the high-voltage terminal, and the grounding plate electrode was unchanged. A new epoxy resin board was placed between the two electrodes, and the diameter of the cylindrical electrode was 20 mm, as shown in Figure 6.
3 Analysis of test results
3.1 Background noise
3.1.1 Noise analysis of the substation
Figure 7 shows the frequency spectrum distribution of audible signals of the main noise sources (transformers, buses, and dry-type reactors) in the electric power field during operation (Ning et al., 2015). It is to be noted that the noise spectrum of each equipment is mainly within 300 Hz, and the proportion of high-frequency components above 1 kHz can be ignored.
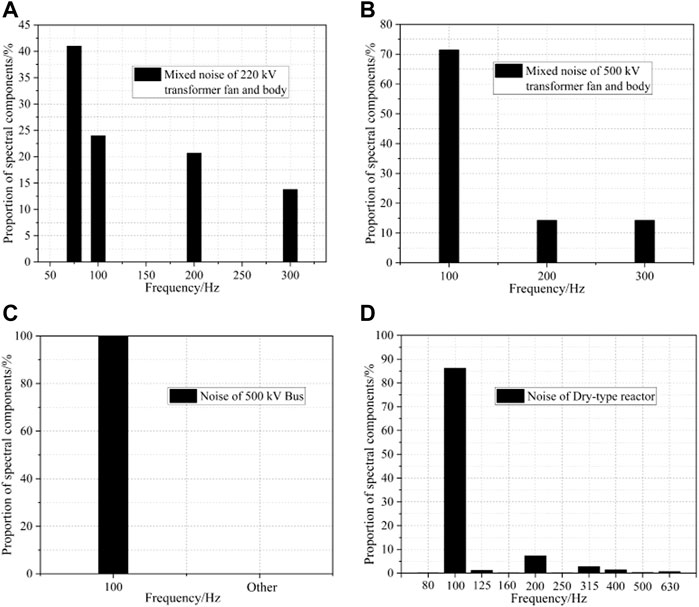
FIGURE 7. Frequency spectrum distribution of operation acoustic signals of the transformer, bus, and dry-type reactor.
3.1.2 Analysis of environmental noise
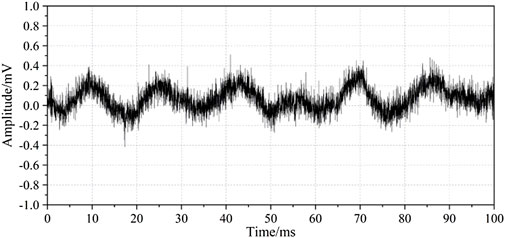
Figures 8, 9 show the environmental noise collected before the test and its FFT analysis, respectively. The environmental noise is mainly within 200 Hz. The amplitude of environmental noise fluctuates around 0.15 mV (Lp = 43.5 dB), and the fluctuation is relatively stable. The multiple groups of environmental noise obtained before the test have consistent characteristics.
where Lp is the sound pressure level, U is the measured voltage (mV), and P0 is a constant (20 × 10−6 Pa).
3.2 Test results and analysis
Acoustic tests for the four PD defects are carried out in the air. Before the test, the initial discharge voltage (PDIV) values of metal burr, pollution, metal foreign matters, and surface discharge defect were 4.2, 11.6, 6.8, and 6.1 kV, respectively. The amplitude of audible signals with PD defects under the PDIV is relatively small, and the effective characteristics are mostly submerged by environmental noise. Therefore, in order to observe the time-domain characteristics of audible signals more clearly, the definitive test voltage levels of the four defects are 7, 15, 9, and 8 kV, respectively. In addition, the state of the circuit needed to be checked before the test. Under these test voltages and without defects, no abnormal PD signal was detected.
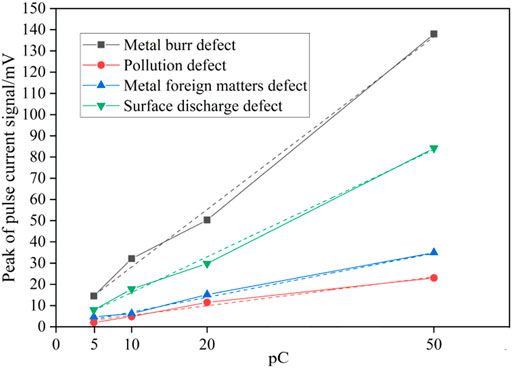
In order to calculate the discharge quantities of the PD defects, a PD calibrator was used to calibrate the discharge quantities of the circuit with different PD defects. The calibration results and their fitting curves under different calibrated discharge quantities are shown in Figure 10. The curves have high linearity, which can be used in calculating the discharge quantities of the four PD defects.
3.2.1 Time-domain feature analysis of voiceprint
1) Metal burr defect
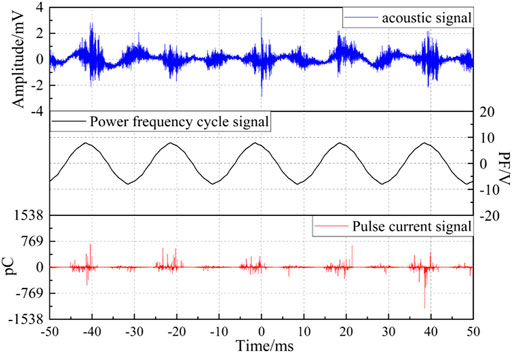
According to Figure 11, the PD of the metal burr defect has cyclicity and sustainability, and the cycle is 20 ms (one power frequency cycle). The PD occurs in 60°–120° and 240°–300° at each cycle, especially on the positive half cycle. The Lp of audible signals fluctuates between 1 mV (60.0 dB) and ∼ 3 mV (69.5 dB), and an audible sizzling sound can be heard during the discharge. Due to the influence of environmental noise, the audible signal curve is not flat. Moreover, when the test voltage continues to rise, the audible signal appearing at the negative half cycle disappears. In this study, the positive and negative half cycles with audible signals at the same time are collected for subsequent analysis. The integrity of signal characteristics can be guaranteed in this way.
2) Pollution defect
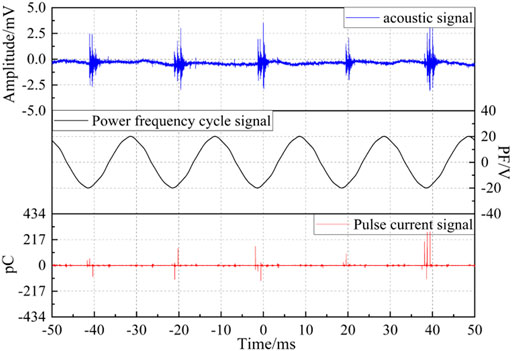
Under long-term observation, the pollution defect discharge has an intermittent characteristic, and there is no cyclicity. However, when there is discharge, the discharge signals have cyclicity and sustainability, as shown in Figure 12, and the discharge only occurs near 270° at the negative half cycle. The Lp level is stable at around 2.5 mV (67.9 dB). One single-discharge audible signal of the pollution defect is composed of several peaks, which is because the pulse current signal is relatively sparse, resulting in the discontinuity of its audible signal.
3) Metal foreign matter defect
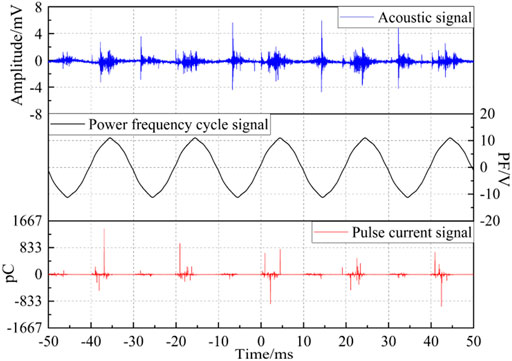
It can be seen from Figure 13 that the metal foreign matter defect discharge occurs in 60°–120° at each cycle and is continuous. Its time-domain characteristics of audible signals and pulse current signals are similar to those of a metal burr defect in the positive half cycle. Compared with the other three PD defects, although the test voltage of the metal foreign matter defect is the highest, the discharge is the weakest. The Lp level of the audible signal is stable at around 0.75 mV (57.5 dB).
4) Surface discharge defect
As shown in Figure 14, the surface discharge defect discharge is continuous. There are audible signals and pulse current signals in 0°–90° and 180°–270° of power frequency cycles. The discharge audible signal sounds “crackling” and unstable. The Lp level is 6 mV (75.6 dB) at 120 pC, but when the discharge quantities are up to 900 pC, Lp is only 3 mV (69.5 dB), which has an obvious difference to the metal burr defect discharge.
The appearance of one single audible signal is the result of the superposition of multiple discharge signals. In general, the audible signal of four PD defects can reflect the occurrence of PD simultaneously with the pulse current signal. But the acoustic time-domain characteristics of each defect discharge are significantly different in terms of listening perception, persistence, amplitude, and phase.
3.2.2 Speech enhancement
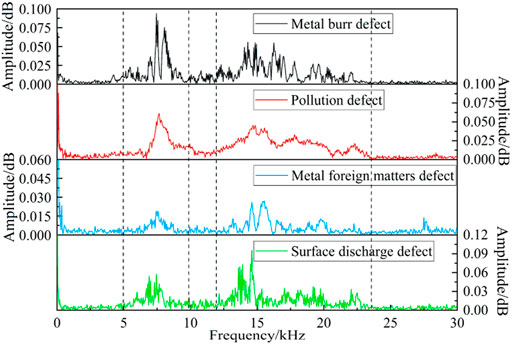
Figure 15 shows the frequency spectrum distribution of the audible signals of the four PD defects. It can be seen that their discharge frequency spectrum energy is mainly within 5–10 kHz and 13–24 kHz, showing dual-band characteristics. Moreover, they have similar low-frequency interference noise.
Based on the difference between the frequency spectrum of the discharge audible signals and background noise mentioned in section 2.1, the low-frequency components (0–1 kHz) can be filtered using the speech enhancement algorithm directly when we analyze the characteristics of the discharge audible signal of the four PD defects. The purity of the discharge audible signal can be ensured by this method.
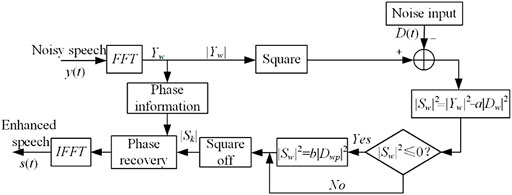
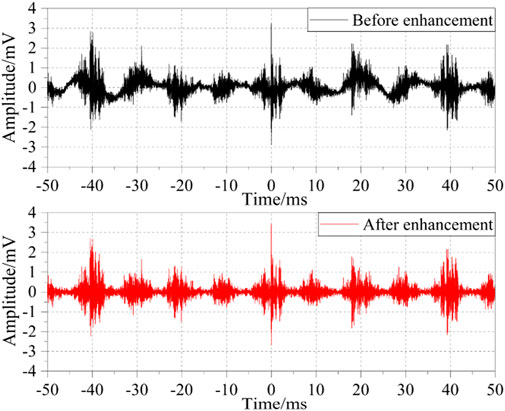
In this study, the speech enhancement method based on improved spectral subtraction is used to filter out the environmental noise. In order to reduce the influence of “music noise” caused by the traditional spectral subtraction method, in the process of spectral subtraction, over-subtraction processing and compensation are carried out. The algorithm flow is shown in Figure 16. In Figure 16, Dwp is the average value of the stationary segment of the environmental noise frequency spectrum. a is the over-subtraction factor and is set as 3. b is the compensation factor to set the point with negative amplitude after spectral subtraction as a positive value and is set as 0.01. Figure 17 shows the change of the metal burr defect discharge audible signal before and after spectral subtraction. The low-frequency noise is effectively filtered, and the curve becomes smoother.
3.2.3 Frequency-domain feature analysis of voiceprint
Based on the frequency spectrum of discharge audible signals, in this study, three feature vectors, namely, frequency spectrum complexity, high-frequency energy factor (Wu et al., 2019), and maximum frequency point, are further extracted to analyze the discharge voiceprint characteristics in the frequency domain.
1) Frequency spectrum complexity
Frequency spectrum complexity (H) indicates the concentration of frequency spectrum energy of audible signals. The smaller the H value, the better is the concentration of spectral energy on some characteristic frequency points. Eq. 2 is the calculation equation of H.
where Ai is the amplitude of the ith harmonic audible signal. Ri is the amplitude proportion of the ith harmonic audible signal.
2) High-frequency energy factor
We can analyze the spectral energy proportion of audible signals in high-frequency and low-frequency bands by using a high-frequency energy factor (Rfh), and its calculation equation is shown in Eq. 3. According to the FFT analysis results shown in Figure 15, the energy in 12.5–25 kHz is taken as the high-frequency component in this study.
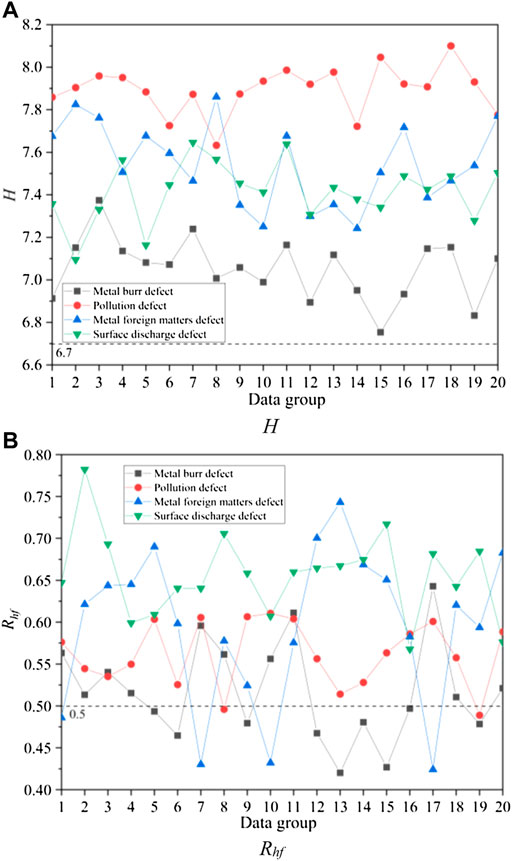
In this study, H and Rfh of 20 groups of audible signals are extracted. As shown in Figures 11–14, one group of signals consists of 100 ms audible signals. Figure 18 shows the calculation results of H and Rfh.
Based on the aforementioned feature extraction results, the variance (Var) and mean (Mean) of H and Rfh are further calculated to describe the frequency domain characteristics of discharge audible signals of the four PD defects more intuitively. The calculation formulas are shown in Eq. 4, 5, and the calculation results are shown in Table 1.
According to Figure 18 and Table 1, the following conclusions can be drawn. Figure 18A shows that the H of the four PD defects are all higher than 6.7. The pollution defect has the highest H level (Mean: 7.8939) so that its frequency spectrum energy is the most dispersed. The H level of the metal burr defect is the lowest (Mean: 7.0533), and its frequency spectrum energy is relatively concentrated. The H level of the metal foreign matter defect is similar to that of the surface discharge defect, but the Var of its H is 1.75, 3.02, and 1.86 times that of metal burr, pollution, and surface discharge defects, respectively. According to Figure 18B, except for the metal burr defect, the frequency spectrum energy of the other three PD defects is mainly high-frequency components. Among the 20 groups of audible signals, Rfh of the surface discharge defect are all higher than 0.5, and the high-frequency components account for the highest level (Mean: 0.6559). Rfh values of 16 groups of audible signals of the metal foreign matter defect are above 0.5, and its Var of Rfh is 2.56, 5.80, and 3.48 times that of metal burr, pollution, and surface discharge defect, respectively. Therefore, its Mean is greater than the pollution defect (Rfh of 18 groups of audible signals above 0.50). The Rfh level of the metal burr defect is the lowest (Mean: 0.5169).
3) Maximum frequency point
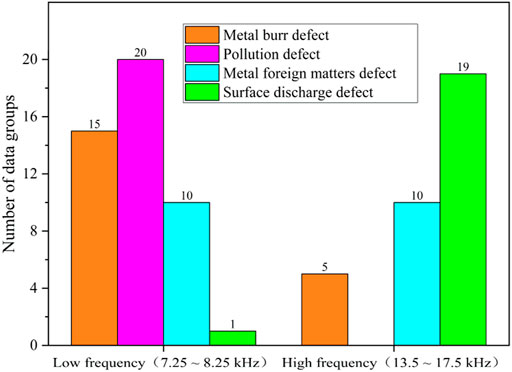
The maximum frequency point (MaxF) is the frequency point corresponding to the maximum frequency spectrum amplitude of the discharge audible signals. Figure 19 shows the MaxF statistical results of 20 groups of audible signals for each defect.
According to Figure 19, MaxF values of the pollution defect all appear at low frequencies (7.25–8.25 kHz) and are all around 7.6 kHz. For the surface discharge defect, MaxF of 19 groups of audible signals appear at a high frequency (13.5–17.5 kHz) and are all around 14.5 kHz; only one MaxF appears at 7.65 kHz of the surface discharge defect. MaxF of 15 groups of audible signals of the metal burr defect appears at a low frequency (7.25–8.25 kHz). MaxF of the metal foreign matter defect is evenly distributed in low and high frequencies, with 10 groups each. Combined with Figure 18B, although MaxF of the pollution defect appears at a low frequency, its frequency spectrum energy is mainly high-frequency components.
Thus, it can be suggested that the three frequency spectrum feature vectors extracted in this study can effectively distinguish the frequency domain characteristics of the audible signals with the four PD defects. It can be used for subsequent fault diagnosis.
4 Summary
Aiming at the problem that the characteristics of the audible signals of the epoxy resin with typical PD defects are not clear, an audible acoustic test platform of epoxy resin with PD defects is built in this study. Then, four typical PD defects of metal burr, pollution, metal foreign matters, and surface discharge are constructed. Finally, the time and frequency domain characteristics of their discharge audible signals are acquired. Here are the following conclusions:
1) PD of the epoxy resin can be detected by both audible acoustic and pulse current methods simultaneously, but the time domain characteristics are significantly different. The cycle of the metal burr defect discharge is 20 ms, and PD occurs in 60°–120° and 240°–300° at each cycle. An audible sizzling sound can be heard during the discharge. The pollution defect shows intermittent discharge. When there is discharge, one single-discharge audible signal is composed of several peaks with good cyclicity and sustainability. The discharge only occurs near 270° at the negative half cycle. The metal foreign matter defect discharge occurs in 60°–120° at each cycle and is continuous. The surface discharge defect discharge is continuous, and there are discharge signals in 0°–90° and 180°–270° at each cycle, but Lp is unstable, showing an intermittent “crackling” sound.
2) In the frequency domain, the discharge audible signals of the four PD defects are mainly composed of 5–10 and 13–24 kHz components, showing the dual-band characteristics. The feature extraction based on the frequency spectrum further found that the pollution defect has the highest H level. The H level of the metal burr defect is the lowest. The Rhf values of the surface discharge defect are all higher than 0.5, and Mean is 0.6559. The Var values of metal foreign matters defect Rhf are 2.56, 5.80, and 3.48 times that of metal burr, pollution, and surface discharge defect, respectively. Rhf of the pollution defect all appear at a low frequency near 7.5 kHz. Rhf of 95% audible signals of the surface discharge defect appears at a high frequency near 14.5 kHz. Moreover, although Rhf of the pollution defect appears at a low frequency, its frequency spectrum energy comprises mainly high-frequency components.
The feasibility of the audible acoustic detection method is preliminarily verified in this study. However, the environmental conditions of the electric power field are complex. Therefore, in order to promote the on-site application of this method, the next work needs to carry out extensive field experiments to develop more accurate speech enhancement algorithms.
Data availability statement
The raw data supporting the conclusion of this article will be made available by the authors, without undue reservation.
Author contributions
XZ: paper modification. KC: complete experiments and data analysis. GZ: guided the experiment and manuscript writing.
Acknowledgments
This project is supported by the Natural Science Foundation of Hubei Province (2020CFB166).
Conflict of interest
The authors declare that the research was conducted in the absence of any commercial or financial relationships that could be construed as a potential conflict of interest.
Publisher’s note
All claims expressed in this article are solely those of the authors and do not necessarily represent those of their affiliated organizations, or those of the publisher, the editors, and the reviewers. Any product that may be evaluated in this article, or claim that may be made by its manufacturer, is not guaranteed or endorsed by the publisher.
References
Ding, N., Mu, H., Ding, Q., Yao, B., Zhang, D., and Zhang, G. (2022). Moisture evaluation and influencing factors of epoxy resin based on frequency domain spectroscopy[J]. High. Volt. Eng. 48 (02), 706–715. doi:10.13336/j.1003-6520.hve.20210102
Fu, Y., Zhao, J., Li, J., Zhu, Z., Liu, R., and Yang, Y. (2019). Application of acoustic imaging technology to mechanical fault diagnosis of GIS[J]. High. Volt. Appar. 55 (11), 239–247. doi:10.13296/j.1001-1609.hva.2019.11.035
GB/T 1094.101-2008 (2008). Power transformers-Part 10.1: Deter-mi-nation of sound levels-Application guide[S]. Beijing: China Electrical Equipment Industry Association.
GB/T 26218.1-2010 (2010). Selection and dimensioning of high-voltage insulators intended for use in polluted conditions-Part 1: Definitions, information and general principles [S]. Beijing: China Electrical Equipment Industry Association.
He, N., Li, X., Zhou, X., Zhao, C., Ding, P., and Ma, F. (2021). Discharge characteristics of different types of void defects of solid insulation of GIS[J]. High. Volt. Eng. 47 (06), 2073–2083. doi:10.13336/j.1003-6520.hve.20200380
Lei, L., Zhang, K., Hong, B., Hu, J., and Lv, S. (2017). Study on the packaging defects and partial discharging properties of the epoxy packages[J]. Thermosetting Resin 32 (02), 43–47. doi:10.13650/j.cnki.rgxsz.2017.02.010
Li, Q., Liu, W., Han, S., and Xu, L. (2015). Analysis on partial discharge characteristics of epoxy resin insulation during high-frequency electrical-thermal aging[J]. High. Volt. Eng. 41 (02), 389–395. doi:10.13336/j.1003-6520.hve.2015.02.005
Liang, H., Du, B., and Jin, L. (2020). Electric field reconstruction inside gas insulated transmission line by induced charge tomography. IEEE Trans. Dielectr. Electr. Insul. 27 (4), 1372–1375. doi:10.1109/tdei.2020.008887
Liu, W., Chen, J., Jiang, P., and Huang, X. (2022). Environmental-friendly electrical insulating thermosets and preparation technology[J]. Trans. China Electrotech. Soc. 37 (05), 1115–1127. doi:10.19595/j.cnki.1000-6753.tces.210147
Lv, F., Li, H., Wang, Z., and Cheng, Y. (2013). Research on partial discharge detection and location of switchgear based on TEV and ultrasonic wave methods[J]. Electr. Meas. Instrum. 50 (11), 73–78. doi:10.3969/j.issn.1001-1390.2013.11.017
Muneaki, K., Umemoto, T., Yoshida, S., Takahiro, M., and Muto, H. (2021). Breakdown strength of TiO2/epoxy nanocomposites using centrifugation agglomerate removal[J]. Ieee Trans. Dielectr. Electr. Insulation 28 (1), 74–81. doi:10.1109/TDEI.2020.009005
Ning, L., Tian, D., Shan, D., Zang, C., Zheng, C., and Yajun, W. (2015). Analysis and discussion on the noise arised from substation in city [J]. High. Volt. Appar. 51 (01), 139–144. doi:10.13296/j.1001-1609.hva.2015.01.024
Shao, Y., Wang, X., Peng, P., Yuan, G., and Nan, K. (2021). Research on defect detection method of power equipment based on acoustic imaging technology[J]. China Meas. Test 47 (07), 42–48. doi:10.11857/j.issn.1674-5124.2020070052
Tu, Y., Sun, W., Yue, C., Wang, W., and Guanghui, C. (2013). Research on thermal aging electrical properties of polymer materials[J]. Trans. China Electrotech. Soc. 28 (01), 7–13. doi:10.19595/j.cnki.1000-6753.tces.2013.01.002
Wang, H., Chen, S., Zhu, Z., Xiang, F., and Cheng, X. (2019). Insulation characteristics of epoxy resin material for solid switchgear[J]. Insul. Mater. 52 (02), 35–40. doi:10.16790/j.cnki.1009-9239.im.2019.02.007
Wang, S., Wang, J., Zhao, L., and Chen, L. (2021). Influence of pollution composition on surface electric field of composite insulator[J]. Electr. Power 54 (07), 149–157. doi:10.11930/j.issn.1004-9649.202011094
Wu, X., Lu, L., Hu, S., Cao, H., Zeng, H., and OuYang, L. (2019). Statistics and analysis of audible noise features of 110 kV transformers[J]. High. Volt. Appar. 55 (11), 113–117+125. doi:10.13296/j.1001-1609.hva.2019.11.016
Xiao, J., Shu, N., Zhu, Y., Chang, Y., Liu, Y., and Li, Y. (2017). Research on identification method of distribution transformer internal discharge fault based on audible sound signal[J]. Eng. J. Wuhan Univ. 50 (03), 415–421. doi:10.14188/j.1671-8844.2017-03-015
Xiao, Z., Dong, M., Ren, M., Zhang, C., Bi, J., and Yan, C. (2015). Influence of epoxy resin on partial discharge development under non-uniform field[J]. Insul. Mater. 48 (03), 60–67+72. doi:10.16790/j.cnki.1009-9239.im.2015.03.013
Xie, Q., Liang, S., Yin, K., Zhao, Y., Huang, H., and Lv, F. (2018). Characteristics on DC surface flashover of epoxy resin and analysis of flashover voltage under different electric field[J]. High. Volt. Eng. 44 (06), 1757–1765. doi:10.13336/j.1003-6520.hve.20180529005
Xie, W., Li, W., Cheng, X., Gu, Y., Zheng, Y., and Chen, S. (2020). Study on electrical aging insulation properties of epoxy resin in solid insulated switchgear[J]. China Plast. Ind. 48 (06), 115–120. doi:10.3969/j.issn.1005-5770.2020.06.022
Xu, H., Ma, J., Wang, C., Zheng, S., Huang, X., and Liu, X. (2017). Study on digital X-ray imaging technology for detecting typical defects in GIS equipment[J]. Power Syst. Technol. 41 (05), 1697–1702. doi:10.13335/j.1000-3673.pst.2016.1844
Yun, T., Yang, J., Ma, Y., Zhao, K., Li, Y., and Yao, Y. (2020). Low frequency acoustic field simulation of GIL disruptive discharge[J]. High. Volt. Eng. 46 (03), 906–914. doi:10.13336/j.1003-6520.hve.20200331018
Zhang, X., Wu, Y., Wen, H., Chen, X., and Song, X. (2018). Study on microcapsules for self-healing system of insulating epoxy resins[J]. Proc. CSEE 38 (09), 2808–2814+2851. doi:10.13334/j.0258-8013.pcsee.170555-en
Zhao, L., Xu, S., Xie, R., Xue, J., Zhang, L., and Wang, Z. (2018). The selection of microphone in power transformer diagnosis technology based on the audible sound[J]. Electr. Meas. & Instrum. 55 (01), 102–108. doi:10.3969/j.issn.1001-1390.2018.01.017
Zhou, X., Tian, T., Li, X., Kang, C., Luo, Y., He, N., et al. (2022). Study on insulation defect discharge features of dry-type reactor based on audible acoustic. Aip Adv. 12 (2), 025210. doi:10.1063/5.0078735
Keywords: epoxy resin, audible acoustics, partial discharge, insulation defect, time–frequency feature
Citation: Zhang G, Chen K and Zhang X (2022) Audible acoustic characteristics of epoxy resins with partial discharge. Front. Energy Res. 10:1006834. doi: 10.3389/fenrg.2022.1006834
Received: 08 August 2022; Accepted: 31 August 2022;
Published: 27 September 2022.
Edited by:
Constantinos S. Psomopoulos, University of West Attica, GreeceReviewed by:
Leif Kari, KTH Royal Institute of Technology, SwedenAshraf Ahmed Fahmy, Swansea University, United Kingdom
Copyright © 2022 Zhang, Chen and Zhang. This is an open-access article distributed under the terms of the Creative Commons Attribution License (CC BY). The use, distribution or reproduction in other forums is permitted, provided the original author(s) and the copyright owner(s) are credited and that the original publication in this journal is cited, in accordance with accepted academic practice. No use, distribution or reproduction is permitted which does not comply with these terms.
*Correspondence: Guozhi Zhang, eW91emd6QDE2My5jb20=
 Guozhi Zhang
 Kang Chen
 Xiaoxing Zhang